Gigahertz NFA 1000 User manual

Made in Germany
NFA 1000
NFA 400
3D Low Frequency
Analyzer
with Data Logger
NFAsoft
Analysis and
Configuration
Software
Operating Manual
Version 7.9
About this Manual
e only significant difference between the NFA 1000 and the NFA
400 in this manual is the fact that the NFA 1000 allows a three-di-
mensional potentialfree measurement of the E-field, while the NFA
400 can only be used for one-dimensional potentialfree measure-
ments of the E-field. This distinction is specified in detail in the rel-
evant chapters

Made in Germany
Thank you!
We thank you for the confidence you have shown by buying this
product. It allows for a professional analysis of AC electric and AC
magnetic fields according to internationally recognized guidelines
and the recommendations of the building biology.
In addition to this manual you can watch the tutorial videos on
our channel “gigavideos” on youtube.com concerning the use of
this meter. However, binding in details and most up-to-date is this
manual.
Technical data and specifications are to be found on our website
www.gigahertz-solutions.com.
Contents
1 Quick Start Guide 1
2 NFA 1000 Front Cover 2
3 LEDs / Display / Audio Signals 3
4 Switches / Push-Buttons / Connectors 6
5 How to Measure and Data-Log 12
6 Power Supply 15
7 „NFAsoft“ 17
8 Firmware-Update 24
9 What if… (FAQ) 26
Do not leave in the hot car, protect from
humidity (also from condensing air humidity),
do not wipe or touch display foil!
(details on page 29)
This manual is based on the firmware version 84 and NFAsoft version 172.
The firmware and software of the NFA will be continuously improved and made available
via download from our homepage. .

© Gigahertz Solutions GmbH - 1 - December 2018
Made in Germany
1 Quick Start Guide
The instructions below refer to the default settings, which can
easily be customized with the help of the supplied software
„NFAsoft“.
After switching on, the CPU boots, performs some self tests and
then automatically starts measuring. When turning off the device,
allow some seconds for shutting down its operating system be-
fore switching it back on.
Set all switches to their top position!
(Auto, tRMS, M3D and On)
With these settings you will achieve your first meaningful results
without further knowledge about the instrument.
The LCD display will now indicate the 3D magnetic field
strength. The coloured frequency LEDs above the LCD display
show the comprised frequencies. The dominant axis x, y or z is in-
dicated by a red LED on the right of the LCD display.
NFA 1000:
To measure the E-field with ground-reference simply connect
the grounding cable. The NFA detects the attached cable and au-
tomatically shows the corresponding electric field strength and
frequencies. The ‘mode’ button toggles between this and the 3D magnetic
field.
To measure the three dimensional potential-free AC electric
field, switch to E3D and fix the instrument onto a potential-free
rod or onto a support. The ‘mode’ button toggles between this and the
magnetic Z-axis.
NFA 400:
For an E-field measurement, simply switch to Ey.
If the grounding cable is plugged in and connected to the
ground potential, you are measuring “against ground”.
If you attach the meter to a potentialfree rod or place it
onto a support, you are measuring “potential free”.
The ‘mode’ button toggles between this and the 3D magnetic field.
Should the meter not do what you expect, please turn to the
chapter on FAQs (frequently asked questions) at the end of this
manual (Chapter 9)!
Notes:
For potential-free E-field-measurements the highest accuracy will be reached when used
without the yellow silicone holster.
To allow a simplified freehand measurement, the meter is pre-adjusted with a 16 Hz high
pass filter for the magnetic field and a 50 Hz high pass filter for the electric field (see page
23 for measurements from 5 Hz onwards).

December 2018 - 2 - © Gigahertz Solutions GmbH
Made in Germany
2 Front Cover NFA 1000 and
NFA 400
Analogous front cover for NFA 1000 and NFA 400
NFA 400: „Ey“
12-15 V
Y
X
Z
Power
Signal
Made in Germany
R
GIGAHERTZ
Mode
NFA 1000
3D-NF-Analyser
5 Hz - 1000 kHz
Freq.
AC/DC
Peak
Rec.
Mode
mV
nT
mG
V/m
Band
E3D
M3D
tRMS
Auto
XYZ
On
Off
Log
I/O
X
Y
Z
Hold
/
TCO-Band I II

© Gigahertz Solutions GmbH - 3 - December 2018
Made in Germany
3 Display / LEDs / Audio
3.1 Display and LEDs
When switched to “On”, the NFA will briefly show the remaining
battery life in the log mode. When switched to “Log”, the remain-
ing battery life is shown cyclically with the elapsed log time and
name of the log file. After some self tests the measurement starts
automatically.
Time indications are set up as follows:
„Xd.XX“: X days and XX hours or
„XX.XX“: XX hours and XX minutes.
„XX.XX“: (with blinking dot): XX minutes und XX seconds.
1 day, 12 hours is the specified minimum logging time. The real
capacity can be higher, notably for new batteries.
The unit of the reading shown on the LCD
is indicated by the adjacent green LED
A flashing LED indicates the unit of a secondary
measurement parameter, which can be selected by
depressing the “Mode>” button.
If the LCD range for the standard unit is exceeded,
the next higher unit is displayed, that is uT instead of
nT and Volt instead of mV. Additionally the color of
the adjacent LED changes to red and the “x 1000”-LED is also lit
red.
LEDs to indicate the applicable frequency bands:
The frequency-LEDs change
their colour (“traffic light prin-
ciple”).
”16.7 Hz“: In use for railway
lines in some European coun-
tries. The reading also in-
cludes the 2nd harmonic.
”50/60 Hz“1:Mains fre-
quency. The bandwidth only covers individual frequencies of 50
Hz and 60 Hz with their respective lock-in ranges.
”100/120 Hz“1: This LED indicates the contribution of the second
through fourth “even” harmonics. The strongest frequency can be numerically
displayed when using “Freq” mode.
1The NFA automatically detects the mains frequency and adjusts the indication
of its harmonics. With “Freq.” the actual mains frequency can be determined ex-
actly. The LED’s for 16.7 Hz, mains frequency and its harmonics up to 2 kHz
have a suitable lock-in range to cover mains fluctuations.

December 2018 - 4 - © Gigahertz Solutions GmbH
Made in Germany
”150/180 Hz“1: This LED indicates the contribution of the third
through fourth “uneven” harmonics. The third harmonics will presently be
found in many homes and most offices as a significant portion of the total measurement.
The frequency of the strongest source can be numerically displayed when using “Freq”.
”R < 2kHz“: Means “Remainder of frequencies below 2 kHz”.
This LED does not show the whole band, but only the sum of all frequencies below 2 kHz
which are not covered by the LEDs on the left.
”> 2kHz“: Comprises frequencies within the upper TCO-band of 2
KHz up to 1 MHz.
Status LED
The “Status” LED indicates the current mode of operation
“Red” means “instrument is being charged”.
“Yellow” means “measurement in progress, NO recording”.
“Green” means “measurement in progress WITH recording”,
Note: with the switch set to “Log.”, the “Status”-LED is switched off after a short
while, in order to extend battery life.
“x 1000”-LED
Turns red when the scale increases to the superior unit.
Special LCD Display Messages
“Low Batt“: Please recharge the battery a.s.a.p.
“Err.“: Short for ‘Error’. Indicates an inappropriate configuration.
This can occur when a grounding cable or mains adapter is con-
nected AND potential-free E-field measurement is selected.
„----“: Instrument is in the process of determining the measure-
ment, or the value is too small to be measured.
„CHAr“: Instrument is being charged. (For technical reasons “FULL” will be
shown shortly before this, which is to be ignored)
„FULL“means: battery fully loaded or SD memory card is full.
„nbAt“:The processor cannot recognize the battery (see chapter 9)
or the 15 V AC adapter should be disconnected (the batteries have
reached their maximum possible capacity. Storage at this capacity level is not advised)
There are two display modes for the frequency-
LEDs:
“Simple/Steady“: (= preset)2
The red LED represents the strongest frequency , and the yellow
2 In order to allow for less fluctuations in this mode an internal high pass filter is
switched on. With NFAsoft it can be configurated to 16.7 and 50 Hz. Experience
has shown that the best combination for a freehand measurement is a filter set
to 16.7 Hz for magnetic fields and to 50 Hz for electric fields. Electric fields of the

© Gigahertz Solutions GmbH - 5 - December 2018
Made in Germany
LED the second strongest. The green LEDs indicate the total fre-
quency range in the current setting.
“Full Information/Volatile”: This makes the LEDs rather un-
steady/volatile. (To be configured with NFAsoft)
The proportion of the respective frequency band in relation to the
total signal is being displayed. These proportions are shown as
follows3:
RED = DOMINANT (> 50%)
YELLOW = MEDIUM (< 50%)
GREEN = SMALL (< 10%)
3.2 Audio Signal
The acoustic signal is always linked to the respective measured
value and has a „Geiger Counter” characteristic, i. e. an increasing
signal intensity will in turn cause an accelerated rattling sound.
If the “Mode”-switch is set to „ “, press the ‘Mode >’ button
to turn the volume up and the ‘Rec. >’ button to turn the volume
down (and finally: off), as long as no grounding cable is connected
to the instrument.
Please note: For extra-precise measurement requirements turn
the acoustic signal volume down or even switch it off completely.
16.7 Hz railway line power frequency (in some European countries) are quite rare
indoors and can still be evaluated in the “band” mode. They can still be sepa-
rately evaluated with NFAsoft.
3To make it more ergonomic for the user, frequencies below the nominal display
resolution (that is < 0.1 V/m or < 1 nT) are not indicated by an LED-signal but will
still be recorded down to the noise level. Hysteresis: 9/12% resp. 45/50%.
/

December 2018 - 6 - © Gigahertz Solutions GmbH
Made in Germany
4 Switches /Push-Buttons /
Connectors
4.1 On / Off switch (“Power“)
“On” = Standard Measurement Setting
Allow some seconds for self-testing until measurement starts au-
tomatically. LEDs and acoustic signal are activated for full infor-
mation during manual measurements. They remain activated
when you start logging by shortly switching to “Log” until the Sta-
tus-LED is lit green and then back to “On”.
“Log” = Logging / long term recording
All LEDs and the acoustic signal are deactivated in order to save
battery life during data logging.
“Off” = Device is off
When turning off the device allow some seconds for shutting
down its operating system before switching it back on.
4.2 Field Selection for
3D Measurement
M3D = Magnetic field measurement (3D)
The isotropic point or magnetic field sensors are below
the coordinate system printed on the meter faceplate.
The dominating axis is indicated by a red LED next to
the display.
XYZ = Axis indication
Here, the NFA 1000 will show either the magnetic or the electric
field in its three individual components depending on the field
type from which the switch was set to “XYZ”, whereas the NFA
400 will only show the individual components of the magnetic
field. Press the ‘Mode >’ button to switch from one axis to the
other. Please see chapter 4.9 for details to this or to the auto-
mated scrolling.
E3D(NFA1000) / Ey(NFA400) = Potential-free E-field meas-
urement
The field sensor pairs for the X-, Y- and Z-axis (directions corre-
spond to the imprint) are situated within the meter close to the
housing. For a proper measurement the meter has to be set up
Y
X
Z

© Gigahertz Solutions GmbH - 7 - December 2018
Made in Germany
more than 12 inches away from any metal objects on an insulated
“holder” (accessory PM1) or held with an insulated rod (mounting
aid PM5s). Also cables or probes must not be connected during
this measurement setting. In the case of an erroneous configura-
tion, the display will indicate “Err.” until the configuration is cor-
rected or the setting is changed to magnetic field measurement.
The measuring person should avoid hectic movements and keep
a distance of at least 1.5 m to the object of measurement.
For E-field measurements against earth potential, please plug in
the grounding cable and
- switch to “M3D” (automatic adjustment) on the NFA 1000
- switch to “Ey” on the NFA 400.
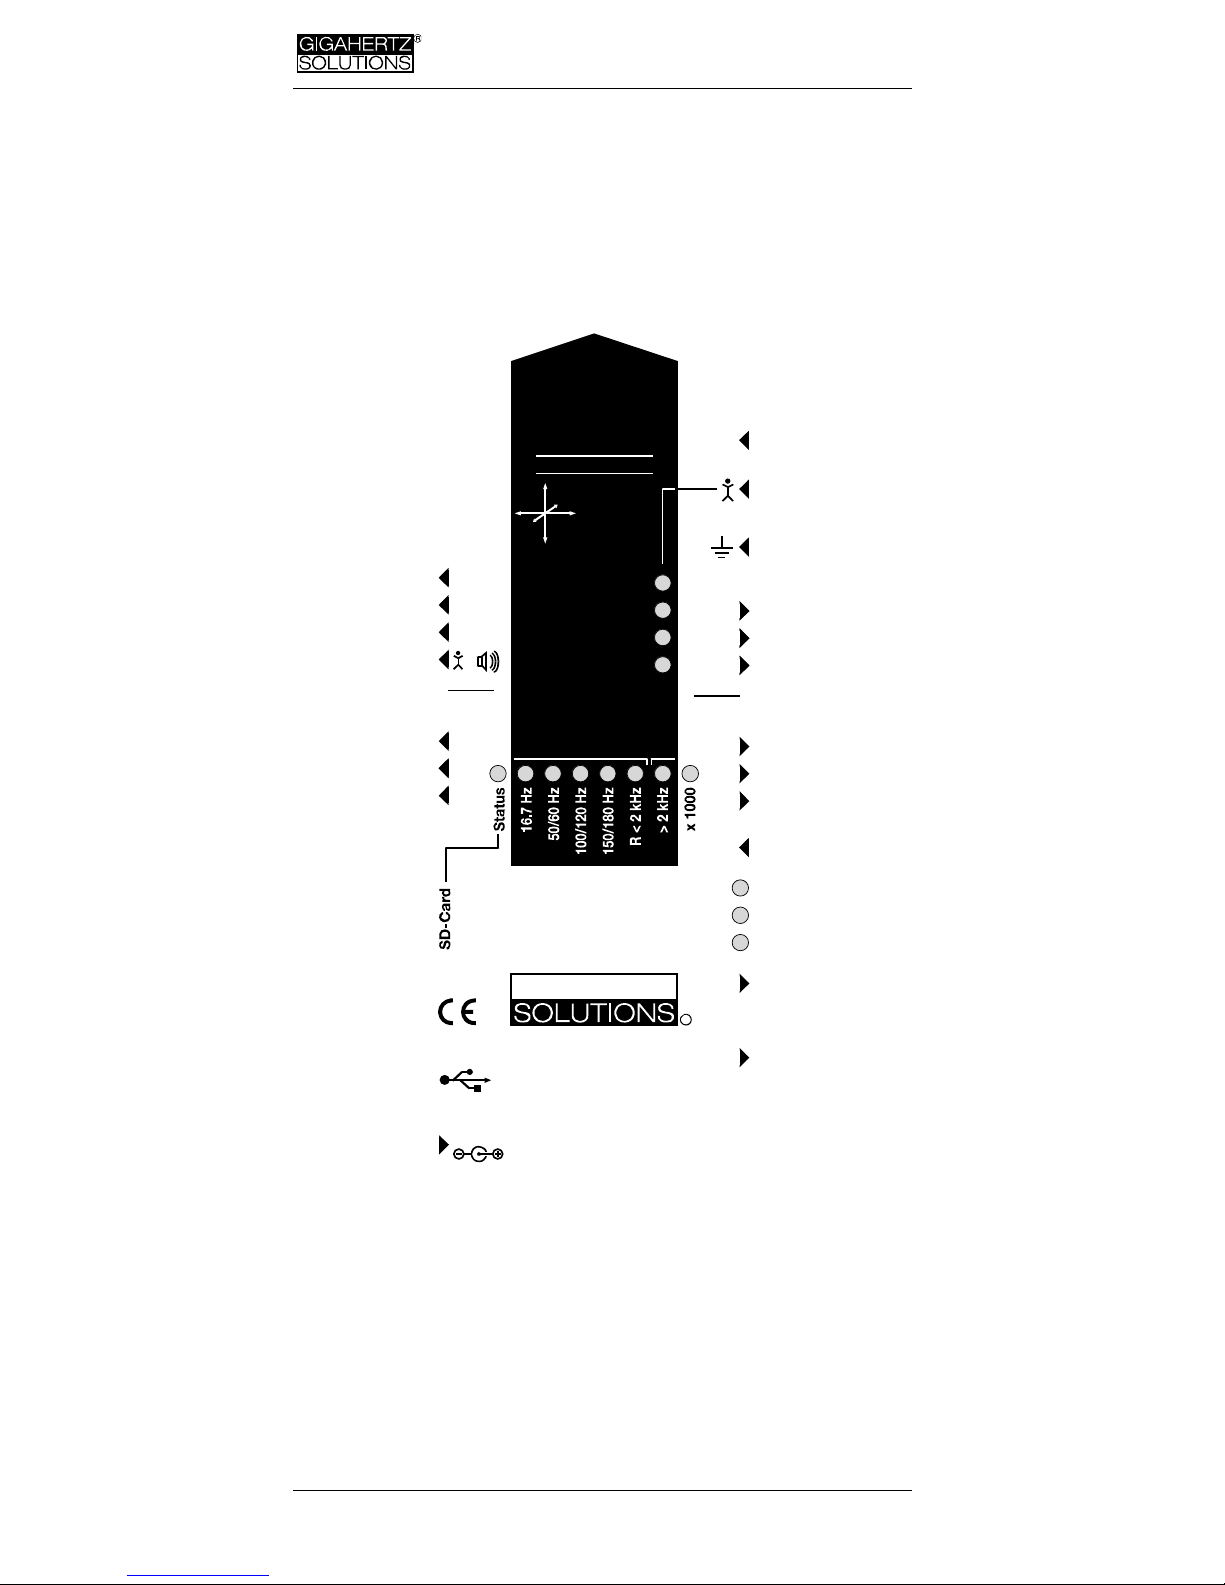
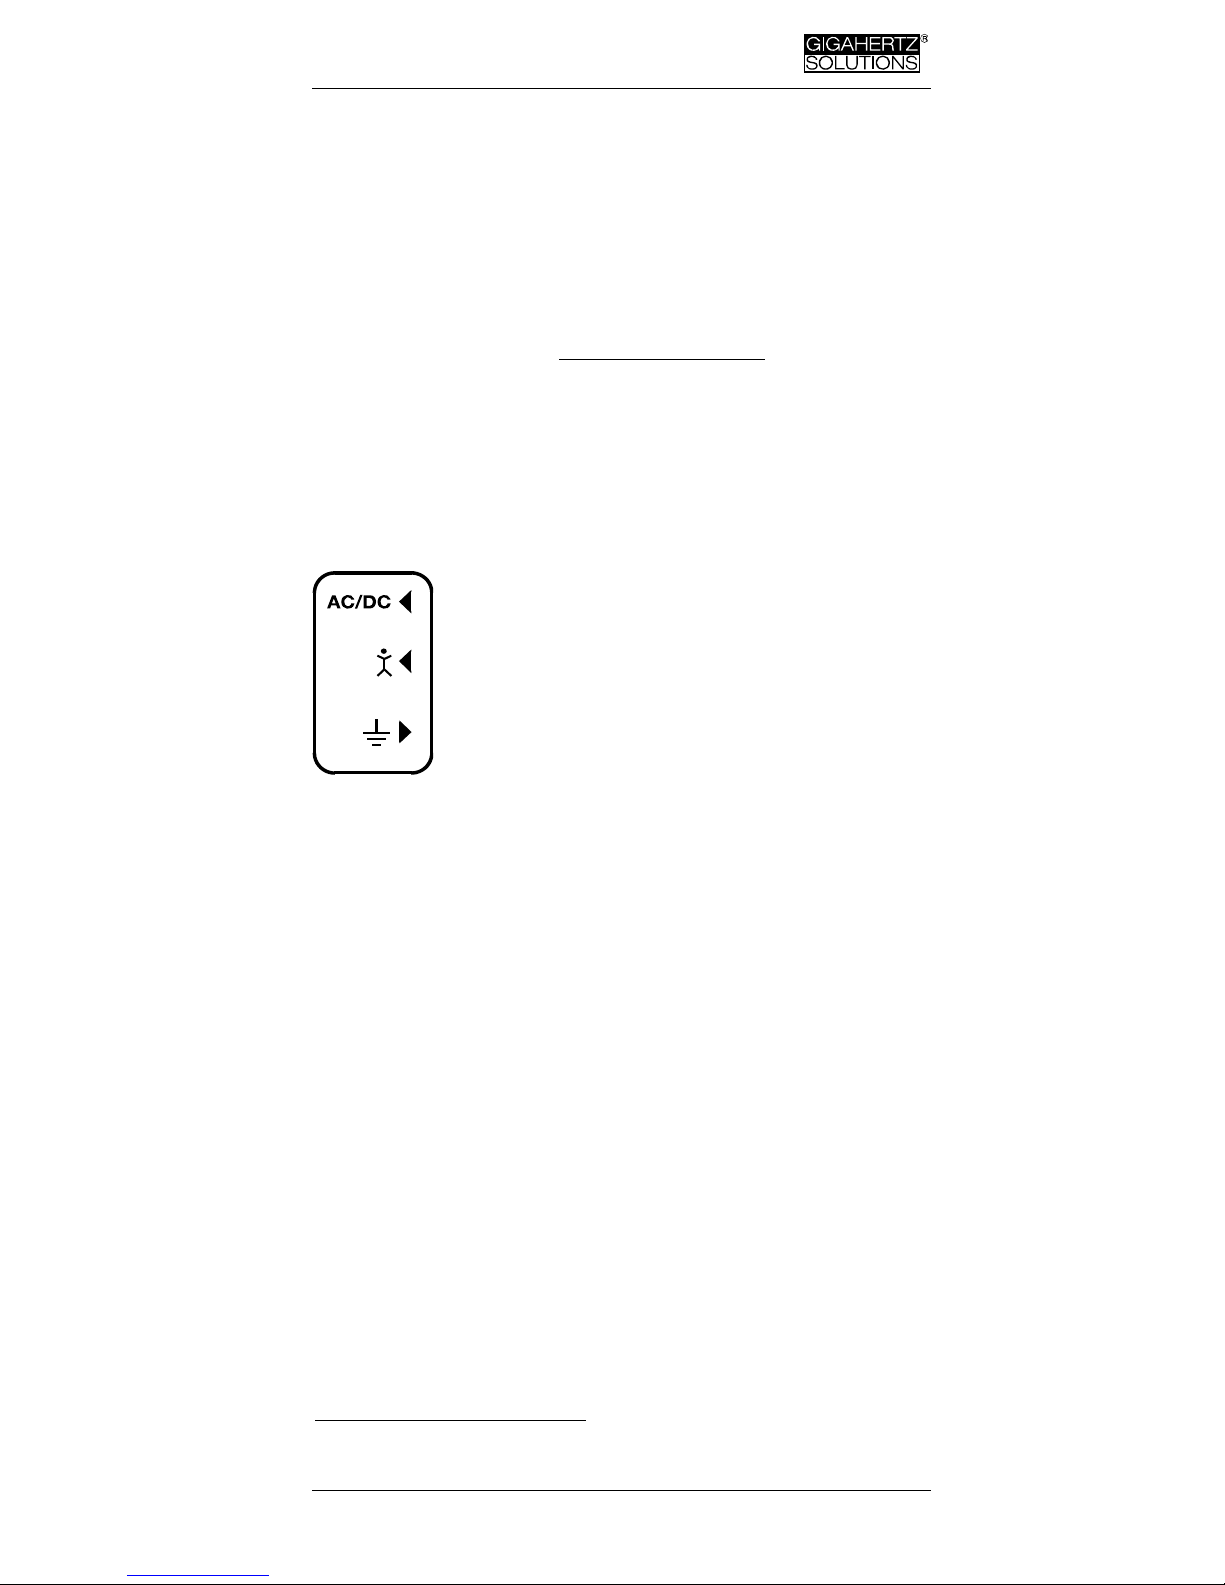
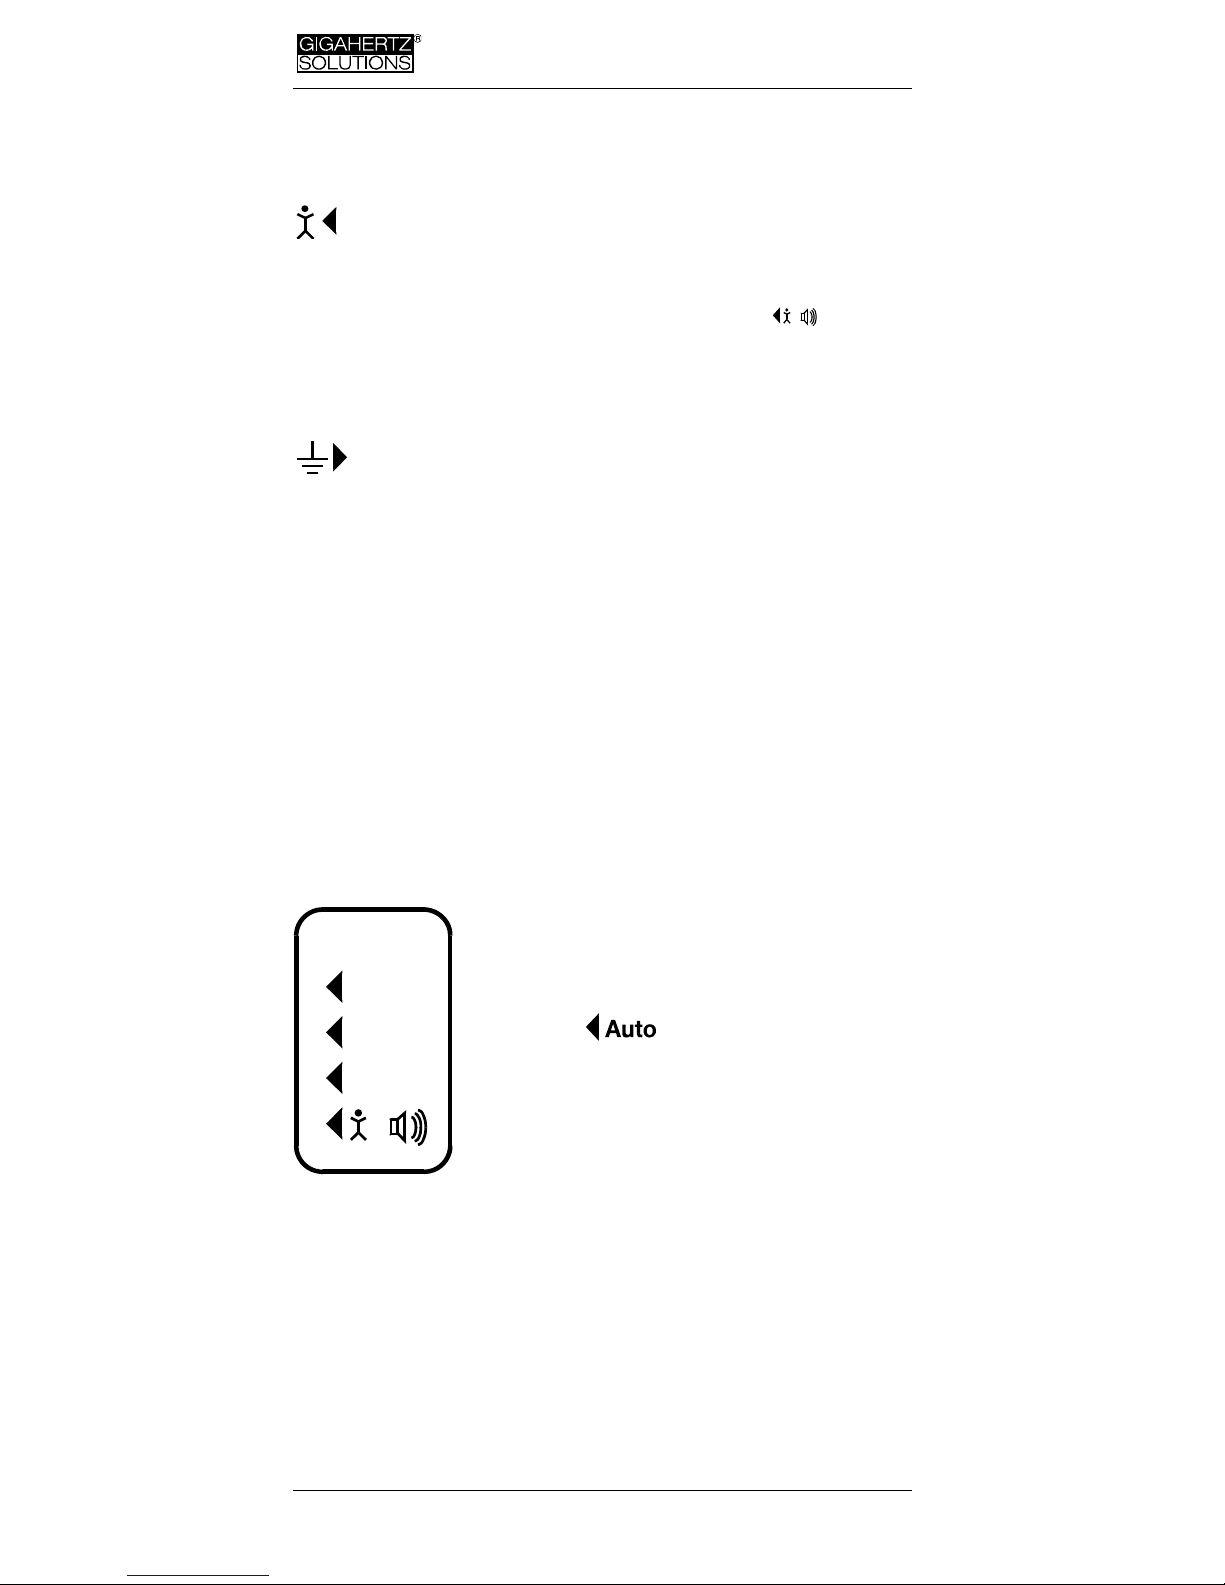
4.3 Sockets for Inputs and Grounding
AC/DC = Combined AC/DC-Input
The moment you connect an external sensor, its
signal will automatically be displayed in mV and
logged if required. (“Mode” switch is set to “Auto”.
Protected against overvoltage).
AC: A displayed value of 2000 corresponds to an
AC signal of “1VRMS”.
DC: It can linearly display and log signals from +/-
0.1 to +/- 1500mV, i.e. with an HF59B connected and set to
coarse (adjust to 1V), the values recorded will be between 1µW/m²
and approx. 30,000 µW/m². The value will be displayed in mV4.
For logging high frequencies please make sure to remember the
settings of the connected HF-Analyser, as they will not be regis-
tered by the NFA. You may use the audio note feature for that.
Available options for the AC/DC Socket
Connecting cable for an HF-Analyser for data logging high-fre-
quency (KAB0053). Potentially falsifying LF- or RF-inductions can
reliably be suppressed by means of our suppression kit (EDY).
Electrostatic probe for measuring electrostatic charges of sur-
faces (ES-NFA).
3D-magnetostatic probe for measuring the Earth’s magnetic
field and its distortions (MS3-NFA).
An AC signal being connected to the AC/DC socket will by default
be displayed as total RMS signal in CH4. For the analysis and mit-
igation of dirty power it is useful to have the signal of a current
clamp (e.g. the CA MiniFlex MA) to be split into the frequency
4For all measurement ranges, even when using an attenuator or amplifier, NFA-
soft offers a comfortable conversion tool. The random noise will make it impossi-
ble to properly display or record measurement values below 0.1µW/m², though.

December 2018 - 8 - © Gigahertz Solutions GmbH
Made in Germany
ranges of the NFA (like with the field strengths). Beginning with
firmware version 84 this feature can be activated optionally (FA1).
= Input socket for body voltage hand probe
Input for the connection of a hand probe for the measurement of
body voltage in mV. The connector is a 4 mm banana jack. For
displaying and recording, set the “Mode”-switch to and plug
in the grounding cable.
This is the only input which cannot be recognized automatically
(being single-pole).
= Socket for the grounding cable
Allows the connection of a grounding cable for an E-field meas-
urement with reference to ground (in compliance with TCO). This
will be detected automatically by the instrument and the display
will change to E-field with reference to ground correspondingly.
Socket for the TCO-conformed probe at the
front end of the meter
This is for the TCO-conformed probe available as an optional ac-
cessory from Gigahertz Solutions. No data logging!
4.4 Mode = Selection of
Measurement Mode
Selects all measurement and display options of
the instrument with the field selector switch
and the “Mode >” button. Configuration errors
will be detected and indicated by “Err.” on the
display until resolved.
When set to the NFA recognizes
probes connected to it, and shows the corre-
sponding values. If there is no external probe
connected to the instrument, it will show the
selected 3D field type. By pressing the mode
button, you can “toggle” between the primary
and secondary display measurements. The
secondary measurement field is indicated by a short flashing of
the corresponding unit-LED.
/
Mode
Freq.
Band
Auto
/

© Gigahertz Solutions GmbH - 9 - December 2018
Made in Germany
and = Display of the individual
frequency bands resp. the exact frequency of
the frequency bands5
Selection of the individual frequency bands is possible by clicking
the “Mode” button6. Please see chapter 4.9 for more details on
this feature or on automated scrolling.
= Capacitive body coupling / volume
In this setting, the display will show the signal generated by con-
necting a hand probe. The grounding cable needs to be con-
nected in order to assure proper measurements. For volume regu-
lation please see chapter 3.2.
4.5 Evaluation of Signal
= true RMS value
tRMS = “true Root Mean Square”. The values
displayed and recorded can be compared di-
rectly to classifications recommended by
building biologists.
This is the standard setting of the NFA, even
for logging the peak values of an HF-Analyser.
= Peak value
Real peak value measurement: With this setting the meter
measures the highest culminating point of the wave7. A new, still
experimental measurement feature for building biologists which
allows for a more detailed analysis of the LF world in a way which
has long since been considered essential in the analysis of high
frequencies. This option supplies important information for the
evaluation of “Dirty Power” (E-field > 2 kHz).
= retain maximum value
Retains „tRMS“ or „Peak“ of the signal, depending on the switch
position from which „Hold“ was chosen. When the signal switch is
set to „Hold“ only the reading on the display is held, the real time
value will still be recorded onto the SD card, if recording.
5 An exact frequency indication is only possible up to 30 kHz.
6 If the 50 Hz high pass filter has been set with the help of the configuration part of the NFA-
soft (maybe even as pre-setting), the 16.7 Hz LED will remain unlit. However, the filter only
applies to the display in the “Auto”-mode and to loggings in the “All3D”-channel. The aim is
to tranquilize the display. Nevertheless, possible frequency components up to 16.7 Hz can
be displayed by using “Band” and “Freq.”.
7The resolution of the frequencies during the analysis of the (actually by their na-
ture broadbanded) peak values does not consider phase information that is be-
ing a worst-case consideration. Tolerances are much higher than using the tRMS
analysis. It cannot be used with the floating potential E-field measurement for the
time being.
/
tRMS
pea
k
Hold
Signal
Peak
tRMS
Hold

December 2018 - 10 - © Gigahertz Solutions GmbH
Made in Germany
4.6 SD Memory Card
This is the slot for the SD memory card. To pre-
vent it from being ejected inadvertently slide it in
beyond the external surface of the casing until it
snaps (use fingernail or pencil, if necessary). To
extract it press again to undo the snap mecha-
nism.
Your PC will recognize the SD card as an external device when
connected by USB cable or slid into a card reading device. It can
then be processed with the standard functionality of your operat-
ing system. By inserting the SD memory card directly into a card
reader of the PC, data transfer will be 40 times faster than by us-
ing the USB cable.
Please note:
Do not remove the SD memory card while the NFA is running!
Please make sure to only use SANDISK cards! We have had a
lot of bad experiences with other manufacturers.
4.7 USB Socket
USB 1.0 computer interface connection: Used for
meter configuration with NFAsoft. Please take care
to have the NFA switched off when connecting or
disconnecting the USB-cable! Please note: for the
time being the USB connection works for windows and Linux only!
4.8 Charging Socket
15 V = charge
12 V = measure / log
Over the DC cables that connect the instrument
with the AC adapter, in certain situations the measurements can
be falsified through stray LF signals or RF overcoupling. There are
two options to avoid these falsifications:
the use of ferrites (of which we offer a low-cost do-it-your-
self solution (“EDY”).
the use of a 12 V external battery (motorcycle gel battery
(no lithium!8), we have configurated a universal connecting
cable for you (“BAK”)”.
8extensive testing with classical power banks and lithium polymer batteries for
flight models showed disappointing results.
1 2 - 1 5
V

© Gigahertz Solutions GmbH - 11 - December 2018
Made in Germany
4.9 „Mode >“ and „Rec.“ - Buttons
for Navigation / Voice Recording
In connection with the “Mode”-switch (left side of the housing)
and the switch for selecting the field type, the “Mode” and “Rec.”
keys form part of the many special functions of this device.
They are not needed for a simple measurement of the 3D mag-
netic field.
“Mode” = Toggle Displayed Reading or “Step
ahead”
The configuration of the “Mode”-button is context sensitive:
If the “Mode”-button on the left is set to “Auto”, the NFA recog-
nizes external probes connected to it, and displays their corre-
sponding values.
The “Mode >”- button toggles the display between the exter-
nal probe and M3D.
If no probe is connected to the NFA, “Mode >” toggles be-
tween M3D and Ey or E3D and Mz, depending on your selec-
tion.
If the “Mode”-button on the left is on “Band” or “Freq.”,
Click the “Mode>” button to select the next frequency band
(indicated by the corresponding LEDs), and also the axis per
band in the “XYZ” mode.
Click the “Mode>” and “Rec>” buttons at the same time to
display the individual axis one after the other in an infinite loop
until the “Mode>” button is pressed again.
“Rec” = Record an audio note
Keep this button pressed and so activate the internal microphone
to accept your live comments. The microphone is positioned
above the “Rec.” button (marked by the hole in the casing lid). It is
sufficiently sensitive to pick up audio comments from a few me-
tres distance.
While the “Rec.” button is pressed for taking your notes, these will
be recorded in a standard WAV file parallelly to logging value re-
cordings. These audio notes will then be directly allocated by
NFAsoft to the corresponding recording times in the graphic.
In order to be correctly allocated by NFAsoft, the WAV files
need to be saved in the same folder as the LOG file.

December 2018 - 12 - © Gigahertz Solutions GmbH
Made in Germany
5 How to Measure
and Data-Log
5.1 “Live”-Measurement
Of course the meter can be used the “conventional” way: simply
switch it on, set the required measurement parameters, and read
the values recorded. When operating in the conventional mode,
the “Status-LED” will be yellow.
In addition, the device is capable of logging all settings as well as
the measurement values of all four channels at once (i.e. the three
field axis values plus one additional channel). This data is stored
onto an SD-card for future analysis. This function can be activated
by temporarily switching the “Power” switch to “Log.” until the
status LED turns yellow. Then switch the “Power” switch back to
“On”. Please note: When logging with the power switch set to
”LOG” and changing the field of measurement and recording (for
instance from M3D to E3D), this will cause the recording session
to be closed and a new log file to be created.
These recordings can be annotated by real-time audio recordings
which will be assigned automatically to the respective measure-
ment for replay.
The chapters 5.2 and 5.3 are only relevant for the NFA 1000.
5.2 Guided 9 Point Measurement
of Sleeping Areas
For alternating electric fields, the guidelines
issued by the VDB e.V., Germany, require a
detailed analysis of the floating potential
electrical field in sleeping areas, specifying
nine points (three each in the head-, torso-
and foot area, with the outer edge of the in-
strument located 10 cm off the bed’s edge).
The NFA in combination with NFAsoft allows
for a “guided measurement” in order to efficiently accomplish
data collection and evaluation.
Preparation and start of the measurement:
Use a potential-free rod (mounting aid PM5s) or the holder
PM1 (stabilized by, for instance, a stiff piece of cardboard or a
plywood panel).
Switch the “Power”-button to “On” and choose “E3D”, “Auto”
and “tRMS” (choose M3D for magnetic fields).

© Gigahertz Solutions GmbH - 13 - December 2018
Made in Germany
Press the “Mode”-button until 9Pt is indicated on the LCD and
then let go. A beep will indicate the activation of the 9 point
measurement.
The NFA guides the user through the nine points by means of
short audio signals (“beeps”). These nine points shall always be
processed in the same order, head area: left, middle, right, fol-
lowed by torso area: left, middle, right and finally feet area: left,
middle, right.
The beeps are not time controlled but the NFA will adjust itself
to your personal work rhythm by “sensing” whether it is being
moved or it is lying still9. This way you can finish the nine point
measurement within less than a minute or – if you prefer to
take it a bit slower – you need not let yourself “be rushed
through the measurement by the beeps”.
The algorithm is as follows: after the activation (see above) the
NFA “waits patiently” to be moved (… that is being moved to
the first measurement position: top left) and it will not beep to
confirm the next measurement before the instrument has been
left still in that position for a couple of seconds10 (… in order to
pick up a valid measurement). After the beep – and in your
speed – you can proceed to the next measurement position11.
PLEASE NOTE: In order to support this algorithm move the
NFA more or less rapidly from one measurement position to
the next, and “bump” it onto the bed’s surface with a little im-
pact in order to give the transition movement a clear end12.
For an analysis of the collected data use NFAsoft.
5.3 Guided 6-Point-Measurement
of Working Places
The NFA and the NFAsoft also support the
measurement of working places. In this
case six measuring positions are to be col-
lected, as shown in the drawing. For a se-
lection of the working place measurement
on the NFA keep the “Mode” button
pressed until “6Pt” is displayed on the
LCD. For the further procedure follow the
instructions of the 9-Point-Measurement in the order: head, el-
bow, bottom, hands, knees, feet.
9The interval from beep to beep can vary between 3 and up to 20 seconds ac-
cording to your work rhythm and movement pattern.
10 This time delay is user-definable with NFAsoft.
11 After the beep the NFA will wait up to 20 seconds for a movement
12This way the NFA can distinguish more reliably whether it is in motion or kept
still. If you use a potential-free rod then try not to move the instrument after you
have “hit“ the measurement point, if you use a holder then withdraw quickly to a
minimum distance of 1.5 m and keep still there in order to avoid movement-in-
duced "pseudo-fields”.

December 2018 - 14 - © Gigahertz Solutions GmbH
Made in Germany
5.4 Long Term Data Logging
The normal approach in building biology is to record only the AC
magnetic field as tRMS. Recording the E-field usually gives little
additional insight but often causes confusion.
Recording the E-field leads to little or no additional insight but of-
ten returns confusing or meaningless results. Recording E-fields
with external power supply is completely senseless for obvious
reasons.
The interval for recording data is set to 10 data sets/sec.
Initiating Long Term Logging of the Meter
For a long-term recording of several hours or days, set the
“Power” switch to “Log”. (The status LED will turn green and long-
term recording will start off after a few seconds. In this mode the
LEDs and the sound are turned off to extend the battery life, after
a while also the green status LED.). The display will show the log-
file number (“L…”), the elapsed time of recording as well as the
remaining time of use in an infinite loop until the battery is empty
or the SD-card full. For information on the display format please
see chapter 3.1. When switching back to “On”, recording will be
continued without interruption.
The instrument records all data corresponding to its field selection
switch. The fourth channel will automatically record the E-field if
the field selection switch is set to M3D and the AC/DC socket is
not connected. However, if an HF analyzer is connected to the
AC/DC socket, it will automatically record the output of this exter-
nal device.
“Locking” of the Instrument
“Locking” ensures that the instrument exclusively executes the
predefined tasks when left at the customer's place for long-term
recordings. To lock, remove the SD memory card from the instru-
ment after predefining the measurement settings, set the micro
switch on the top left of the SD-card to “lock” or “write protect”
and reinsert it. Note: The data will still be recorded!
IMPORTANT: Don't forget to “unlock” the SD memory card
finishing a “locked” long term recording!

© Gigahertz Solutions GmbH - 15 - December 2018
Made in Germany
6 Power Supply
6.1 Internal Rechargeable Battery
The instrument features high performance Lithium Ion recharge-
able batteries (2 x 3.7 V). When fully charged, they will last for at
least one day, 12 hours of data logging13.
A vital factor for the durability of Lithium Ion rechargeable batter-
ies is to absolutely avoid a deep discharge and also avoid storage
when charged to a maximum. The NFA setting will prevent a deep
discharge in operation, however, in view of the inevitable self-dis-
charge, the meter should never be kept with “almost empty” bat-
teries.
Shelf life without deep discharge with initially ¾-full batteries:
3 to >9 Months (the big variation is caused by the varying “off-line” power con-
sumption of SD memory cards
>3 years with disconnected SD memory card
For longer storage the batteries should be disconnected from
the instrument.
6.2 Charging
To charge the batteries use the 15 V AC adaptor. If the device is
switched off while charging, the display will show “CHAr” and the
estimated running time in the log mode with the current capacity
status. Measurements or recordings during the charging process
are technically possible, but this is no specified status and thus
not recommendable.
Thanks to a sophisticated algorithm, the NFA charging process
will start off extremely quickly, but will slow down towards the end
in order to achieve maximum long time durability of the batteries.
Due to the large variation in the Lithium Ion batteries supplied by
their manufacturer, the maximum capacity as well as the charging
time are subject to fluctuations.
The specified battery life is typically reached after a charging pe-
riod of approx. 8 hours. A (significantly) longer charging period
may considerably extend the battery running time.
A “gentle” maximum capacity will be reached after 15 hours and
indicated by a “FULL” on the display.
“nbAt” on the display indicates that the 15 V AC adapter should
be disconnected in order to sustain the batteries’ durability.
13 Please note that Li-Ion batteries, even when treated with care, will lose some
of their original capacity within one or two years and their typical life expectancy
is 250-500 complete charge cycles. In this case please always replace both bat-
teries.

December 2018 - 16 - © Gigahertz Solutions GmbH
Made in Germany
6.3 Data Logging with External Power
Supply
You can perform this task with the supplied 12 V AC adapter. Be-
cause this adapter causes magnetic fields itself, it should be
placed as far as possible away from the instrument and turned in
such a way that the NFA is influenced as little as possible.14
The results can also be falsified by unwanted noise etc. through
the AC adapter or through RF overcoupling into the cable con-
nected to the NFA. RF overcoupling can also take place into a
connecting cable between RF detector and NFA.
Ring ferrites attached to both ends of the respective cables
avoid these falsifications (available from us as a low-cost do-it-
yourself solution “EDY”).
Another solution for avoiding these falsifications is the use of an
external 12 V battery for off-grid long-term recordings. Most suit-
able are gel or AGM (motorcycle) batteries (no lithium!15). We have
configured a universal adapter cable for you (“BAK”).
The longer the logging time exceeds the specified 36 hours, the
higher the risk of an unwanted shutdown – mainly caused by the
internal electronics of the SD memory card. Longer logging times
can therefore not be guaranteed.
Measuring / recording E-fields with an AC adapter or external
battery connected results in meaningless data.
6.4 Battery Change
For safety reasons, please only use original battery packs classi-
fied by us (integrated protection circuit. The two battery cells fit
tightly, but can easily be removed for the purpose of battery
change. In no case untighten the screws of the meter! Putting the
meter together is very complicated, and therefore subject to a fee
if it needs to be done by one of our technicians.
14 To determine the emission created by the AC adapter at the location of the
NFA, proceed as follows:
- Place the instrument and adaptor into their measurement location
- Connect the NFA to the AC-adapter. Wait for the readings to stabilize.
- Disconnect the adapter from the NFA without changing its position and ori-
entation; wait for the display to stabilize.
Evaluating the logged data on the PC will potentially show difference that can
be corrected, if necessary.
15 extensive testing with classical power banks and lithium polymer batteries for
flight models showed disappointing results.

© Gigahertz Solutions GmbH - 17 - December 2018
Made in Germany
7 „NFAsoft“
The provided software allows...
for the analysis of the data logged by the NFA
for the configuration of the NFA according to your preferences
and habits.
A double-click on the program-icon
opens the window shown on the
left. Here you can chose between the
tool for the analysis of the data and
the tool for the user-specific configu-
ration of your NFA .
The software is subject to continuous upgrade. The most current
revision can be downloaded from our homepage.
System requirements
NFAsoft is made for Windows (98 and up higher). Linux and Mac
versions are provided “as is”. NFAsoft requires no installation –
just pull to location of your choice, double-click and start!
In some cases, it might be necessary to temporarily disable
your anti-virus software. Anti-virus software may interpret NFA-
soft as a threat and hence might disable or even erase it. It may
be necessary to repeat this upon loading an upgraded version of
NFAsoft. NFAsoft can be loaded and executed directly form the
SD memory card through a card reader or through the USB inter-
face cable. The NFA is supplied with a “Class 6 SDHC”-SD
memory card (appropriate readers have been available since
2008, adapters are available for older computers).
7.1 Data Analysis: File Types
A click on the button opens the program and a Win-
dows-box for file selection. The following file types are
available (the consecutive numbering is independent
from the file type)
LOG00001.TXT log file (long time recording)
LOG00002.9PM 9-Point-Measurement (sleeping area)
LOG00003.6PM 6-Point-Measurement (workplace)
REC00004.WAV audio file (recorded note).

December 2018 - 18 - © Gigahertz Solutions GmbH
Made in Germany
7.2 Data Analysis: Longterm Recording
Double-click the appropriate log file for analysis. For longterm re-
cordings the following window will open (check chapter 7.2 for 9
point measurements):
The far left
column labelled “Chan-
nels“ displays statistic
evaluations of the plot
on the right (in real-
time)
The graph
shows the collected
data over time.
The “x”
(horizontal) axis of the plotted data is the time scale and the
“y” (vertical) axis shows the units of measurement corre-
sponding to the field of measurement.
Plotted Data Window
Units of measurement appear on the correspond-
ing channel window on the left and are not indi-
cated on the y-axis. The different plots are colour
coded. This allows for different channels to be
shown simultaneously.
The x-axis indicates the time span. The figures at
the left and the right end of the grey status line show the times of
start and end of the logging period.
If the status line is mouse clicked, the window on the right will ap-
pear. Here one can enter a preferred time span to view. The time
span can also be selected in the “View” menu.
The colouring scheme of the plot corresponds to the standards
for building biology measurements (SBM2015):
Green for “no concern”.
Yellow for “slight concern”.
Red for “severe concern”.
Purple for “extreme concern”.
If one selects two channels with different units, the SBM colour
scheme of the plot’s background will be the one corresponding to
the unit of the selected (= bold) channel. It will be bold for the one
and regular for the other, equalling the markings in the “Channels”
window.
Navigation within the Plotted Data
Within the plotted data you can easily navigate using a mouse and
its scroll wheel. Move the mouse pointer into the data plot. The
scale of the x-axis will be
Other manuals for NFA 1000
2
This manual suits for next models
1
Table of contents
Other Gigahertz Measuring Instrument manuals