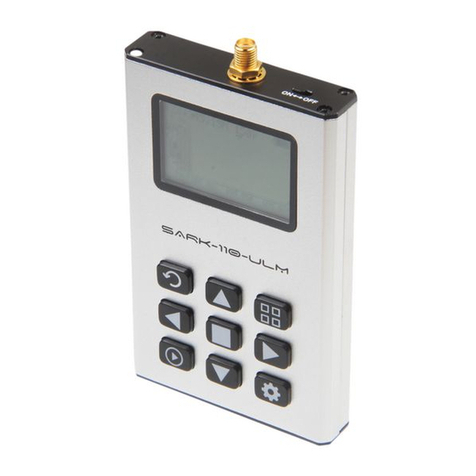
Seeed SARK-110 User manual

Chipsmall Limited consists of a professional team with an average of over 10 year of expertise in the distribution
of electronic components. Based in Hongkong, we have already established firm and mutual-benefit business
relationships with customers from,Europe,America and south Asia,supplying obsolete and hard-to-find components
to meet their specific needs.
With the principle of “Quality Parts,Customers Priority,Honest Operation,and Considerate Service”,our business
mainly focus on the distribution of electronic components. Line cards we deal with include
Microchip,ALPS,ROHM,Xilinx,Pulse,ON,Everlight and Freescale. Main products comprise
IC,Modules,Potentiometer,IC Socket,Relay,Connector.Our parts cover such applications as commercial,industrial,
and automotives areas.
We are looking forward to setting up business relationship with you and hope to provide you with the best service
and solution. Let us make a better world for our industry!
Contact us
Tel: +86-755-8981 8866 Fax: +86-755-8427 6832
Email & Skype: [email protected]om Web: www.chipsmall.com
Address: A1208, Overseas Decoration Building, #122 Zhenhua RD., Futian, Shenzhen, China

This document is licensed under a Creative Commons Attribution-NonCommercial-ShareAlike 3.0 Unported License.
© Melchor Varela –EA4FRB 2011-2018
SARK-110
Vector Impedance Antenna Analyzer
User’s Manual
Revision 1.3.8
Updated to Firmware Version 0.10.x

SARK-110 User’s Manual
Rev 1.3.8 30 July 2018 - 2 - © 2011-2018, Melchor Varela –EA4FRB
Contents
1INTRODUCTION.......................................................................................................................4
1.1 OVERVIEW ...........................................................................................................................4
1.2 MAIN FEATURES...................................................................................................................5
1.3 OVERVIEW OF FUNCTIONS....................................................................................................6
1.4 PRECAUTIONS......................................................................................................................7
1.5 REGULATORY COMPLIANCE ..................................................................................................7
2OPERATING THE SARK-110 ..................................................................................................8
2.1 SCREEN LAYOUT..................................................................................................................8
2.2 STATUS SYMBOLS MEANING .................................................................................................9
2.3 MEANS OF INPUT................................................................................................................10
2.4 MAIN MENU .......................................................................................................................11
2.5 CHANGING THE FREQUENCY ...............................................................................................13
2.6 CHANGING THE SPAN .........................................................................................................14
2.7 CHANGING THE START AND STOP FREQUENCIES .................................................................15
2.8 FREQUENCY PRESETS........................................................................................................16
2.9 USING MARKERS................................................................................................................ 17
2.10 CHANGING THE VERTICAL AXIS PARAMETER ....................................................................21
2.11 SAVING AND RECALLING MEASUREMENTS .......................................................................21
2.12 TAKING SCREENSHOTS................................................................................................... 27
2.13 CHANGING THE OPERATING MODE ..................................................................................28
2.14 CHANGING THE SETTINGS ...............................................................................................28
3OPERATING MODES............................................................................................................. 43
3.1 SCALAR CHART MODE........................................................................................................ 43
3.2 SMITH CHART MODE ..........................................................................................................45
3.3 SINGLE FREQUENCY MODE ................................................................................................48
3.4 CABLE TEST MODE (TDR) .................................................................................................54
3.5 FIELD MODE ......................................................................................................................57
3.6 MULTI-BAND MODE ............................................................................................................59

SARK-110 User’s Manual
Rev 1.3.8 30 July 2018 - 3 - © 2011-2018, Melchor Varela –EA4FRB
3.7SIGNAL GENERATOR MODE ................................................................................................62
3.8 COMPUTER CONTROL MODE ..............................................................................................67
3.9 BAND SCAN MODE .............................................................................................................69
4SPECIAL FUNCTIONS...........................................................................................................71
4.1 TRANSMISSION LINE ADD/SUBTRACT ..................................................................................71
4.2 CIRCUIT MODELS ...............................................................................................................74
4.2.1 Loop Antenna/Coil ................................................................................................74
4.2.2 Capacitor ..............................................................................................................77
4.2.3 Quartz Crystal.......................................................................................................78
4.2.4 Transmission Line ................................................................................................80
4.3 TUNING STUBS...................................................................................................................83
APPENDIX A: THEORY OF OPERATION..............................................................................85
APPENDIX B: FUNDAMENTAL PARAMETERS.................................................................... 87
APPENDIX C: UPGRADING THE FIRMWARE ......................................................................89
APPENDIX D: OSL CALIBRATION ........................................................................................90
APPENDIX E: FREQUENCY CALIBRATION.........................................................................95
APPENDIX F: DETECTOR CALIBRATION............................................................................96
APPENDIX G: FREQUENCY PRESETS FILE......................................................................100
APPENDIX H: SCALE PRESETS .........................................................................................101
APPENDIX I: CUSTOM CABLE SETTINGS ...........................................................................103
APPENDIX J: SPECIFICATIONS .........................................................................................104
APPENDIX K: ACKNOWLEDGMENTS ................................................................................106

SARK-110 User’s Manual
Rev 1.3.8 30 July 2018 - 4 - © 2011-2018, Melchor Varela –EA4FRB
1 Introduction
1.1 Overview
The SARK-110 Antenna Analyzer is a pocket size instrument providing fast and accurate
measurement of vector impedance, VSWR, vector reflection coefficient, return loss and R-L-C
(as series or parallel equivalent circuits). Additionally, the analyzer features a TDR (Time
Domain Reflectometer) mode which is intended for fault location and length determination in
coaxial cables as well as a programmable RF signal generator.
The SARK-110 is intended for standalone operation but also operates when connected to a
personal computer in combination with SARK Plots client software for Windows, further
enhancing the device’s capabilities.
Typical applications include checking and tuning antennas, impedance matching, component
testing, cable fault location, measuring coaxial cable losses and cutting coaxial cables to precise
electrical lengths. As a signal generator it is ideal for receiver calibration, sensitivity tests and
signal tracing.
The SARK-110 features a Direct Digital Synthesis (DDS) generator with a range of 0.1 to 230
MHz and a frequency resolution of 1 Hz. The instrument has full vector measurement capability
and accurately resolves the resistive, capacitive and inductive components of a load. The
measurement reference plane is automatically adjusted via the Open/Short/Load calibration
procedure for higher measurement accuracy. Also, the analyzer implements a transmission line
addition or subtraction feature in order to make antenna measurements while discounting the
effect of the feed line.
The user interface, based on a color display, has been designed to be intuitive and easy to use.
The graphical impedance displays provide a quick view of the antenna impedance
characteristics on a user-selected sweep range. This includes the graphical plot of two user-
selectable parameters in a scalar chart or a complex reflection coefficient in Smith chart form.
To help speed up measurements, two markers are available, both of which are user positionable
or can operate in automatic tracking mode.
The Multiband mode is a unique feature of the SARK-110, whereby it is able to display
simultaneously the plot of an impedance parameter in four scalar charts. This feature is ideal for
tuning multiband antennas.
Also included is a single frequency measurement mode that presents a complete impedance
parameter analysis at a user selectable frequency and displays diagrams of equivalent circuits.
The analyzer uses an internal 2MB flash disk for the storage and recall of measured parameters,
screenshots, analyzer configuration and firmware updates. This disk is accessible via USB so
the measured parameters can be downloaded to a PC for analysis using the ZPLOTS
spreadsheet program or the SARK Plots client software for Windows.

SARK-110 User’s Manual
Rev 1.3.8 30 July 2018 - 5 - © 2011-2018, Melchor Varela –EA4FRB
Please let us have your suggestions through the website http://www.sark110.com as we are
highly motivated to extend this device’s functionality, based on community requests.
1.2 Main Features
•Pocket size and lightweight
•Solid aluminum case
•Intuitive and easy to use
•Operating modes: Scalar Chart, Smith Chart, Single Frequency, Cable Test (TDR), Field
Mode, Multi-band, Signal Generator, Computer Control and Band Scan
•Good accuracy over a broad range of impedances
•Resolves the sign of the impedance
•Manual and automatic positioning tracking markers
•Internal 2MB USB disk for the storage of measurements, screenshots, configuration and
firmware upgrade
•Exports data in ZPLOTS-compatible format for further analysis on a PC
•SARK Plots client software for Windows
•Lifetime free firmware upgrades
•Open to community requested features
•Open source Software Development Kit (SDK) including a device simulator for
development of user applications

SARK-110 User’s Manual
Rev 1.3.8 30 July 2018 - 6 - © 2011-2018, Melchor Varela –EA4FRB
1.3 Overview of Functions
Power Switch
Mini USB Port
Navigator A
Navigator B
Run/Hold
Select
Save Screen
Save Conf.
Test Port
3" TFT LCD
SARK-110
é••• ê
-•••+
Ø||
USB
ON
Test
Port
The unit has a Test Port located on its left side, to connect to the device under test. This
receptacle accepts straight MCX plug connector types. The product pack includes an MCX to
SMA female connector adapter and a 20-cm SMA plug to SMA female cable adapter.
The USB port located on the right side facilitates connection to a personal computer for
communication and internal battery charging using a compatible mini-USB cable (not included).
The unit charges the internal battery when connected to USB. The internal battery charger
automatically manages the charge cycle and stops the process when the battery is fully charged.
The complete charge cycle takes around 3.5 hours.
Slide the Power Switch button located on the right side to the ON position to turn the unit on. An
automatic power-off feature can be set for power-saving after a user-specified period of
inactivity.
Operation is controlled by four buttons and two navigation keys located on the top side of the
unit. A 3” TFT color LCD is used to display diagrams.

SARK-110 User’s Manual
Rev 1.3.8 30 July 2018 - 7 - © 2011-2018, Melchor Varela –EA4FRB
1.4 Precautions
1. Never connect the unit to an antenna during a lightning storm and windy dry days.
Lightning strikes and static discharges can damage the unit and may kill the operator.
2. Static build-up on an antenna may cause damage to the unit when connected. As a
precaution, before pluging the coax cable into the analyzer always discharge the
antenna by momentarily shorting the center and outer conductors of the connecting
coax cable together and then touching the coax connector shell to the analyzer to
equalize the charge. After operation, always disconnect the antenna.
3. Maximum safe RF input is 2V peak (+16 dBm). Exceeding this RF level may damage
the unit. Note that powerful active transmitters nearby may induce a high RF voltage on
the antenna.
4. Test port is DC coupled. Use an external series capacitor for measurement scenarios
whereby a DC voltage is present.
5. This product emits a low power RF signal during its active measurement mode. When
connected to an antenna system, this radiation may cause interference to nearby
communication systems. Connect only for as long is necessary.
6. On first time use, it is recommended saving the factory files in a safe place. Please
connect the device to a PC via an USB cable and copy the files in the internal disk to a
location in your PC.
1.5 Regulatory Compliance
SARK-110 is certified for CE compliance under regulations EN61000-4-2 and EN55022.

SARK-110 User’s Manual
Rev 1.3.8 30 July 2018 - 8 - © 2011-2018, Melchor Varela –EA4FRB
2 Operating the SARK-110
This chapter provides information about the SARK-110’s basic functionality and user interface.
2.1 Screen Layout
The following figure shows the screen layout in Scalar Chart mode. It shows diagram areas that
are the same for all operating modes of the SARK-110. Screen layouts that show specifics for
each operating mode are provided in corresponding sections of this manual.
1
Diagram
10
Transmission Line length setting
2
Traces
11
Reference impedance setting
3
Markers
12
Calibration profile
4
Vertical axis labeling
13
Filter setting
5
Horizontal axis labeling
14
Sampling setting
6
Active main menu option
15
Calibration status
7
Submenu
16
Run/Hold status
8
Selected submenu option
17
USB/Battery status
9
Markers information window

SARK-110 User’s Manual
Rev 1.3.8 30 July 2018 - 9 - © 2011-2018, Melchor Varela –EA4FRB
2.2 Status Symbols Meaning
Calibration
status
Calibrated
Not calibrated
Run/Hold status
Measurements in progress
Measurements on hold
USB/Battery
status
Device operating from USB
Battery charge status when operating from battery
Disk
Disk write operation in progress
Zoom
(Smith Chart)
Zoom:E
Zoom Extends
Zoom:1o
Zoom 1st Octave
Zoom:1s
Zoom 1st Sixteenth
Zoom:nq
Zoom 1st to 4th (n) Quarter
Sampling
d/s
Double sampling
r/2
Normal sampling –resolution ½
r/4
Normal sampling –resolution ¼
r/8
Normal sampling –resolution 1/8
Filter
ave
Average
smo
Smoothing

SARK-110 User’s Manual
Rev 1.3.8 30 July 2018 - 10 - © 2011-2018, Melchor Varela –EA4FRB
2.3 Means of Input
There are four buttons and two navigation keys on the SARK-110.
Navigator A
Navigator B
Run/Hold
Select
Save Screen
Save Conf.
é••• ê
-•••+
Ø||
SARK-110
Navigator A
Navigator A is used to navigate within the main menu.
Navigator B
Navigator B is used for changing the value of the active option in the main menu (for Freq, Span,
Marker1, Marker2, LeftY and RightY) and to navigate within the popup submenus.
Run/Hold [►||]
The Run/Hold button is used to control the operating state of the SARK-110: Running or
Holding. In the holding state the signal generator and measurement circuits are inactive.
ØNote: when loading a stored data file the analyzer is automatically placed in a
holding state.
Select [■]
The button is used to activate the popup submenu associated with the highlighted option and for
selecting the desired option within the popup submenu.
ØNote: Pressing any other button will cancel a selection.
Save Screen [●]
The Save Screen button is used to take a screenshot of the current screen. The screenshot is
stored on the internal flash disk.
ØSince firmware version v0.10.7, Save Screen [●] button can be used to launch
Setup menu if pressed for few seconds.

SARK-110 User’s Manual
Rev 1.3.8 30 July 2018 - 11 - © 2011-2018, Melchor Varela –EA4FRB
Save Conf. [▲]
The Save Conf. button is used to store the complete analyzer state and settings. The stored
state is restored automatically after the device is powered on.
ØSince firmware version v0.10.7, the analyzer state and settings are saved
automatically. Save Conf. [▲] button can be used to launch Mode menu.
2.4 Main Menu
The main menu is the primary navigation tool. Navigator A is used to change the active menu
option. If the Main Menu setup option is enabled, a popup menu is shown automatically when
the Navigator A right or left buttons are pressed; see the screenshot below. The active menu
option is shown on the top left side of the screen
Figures below illustrate the main menu options available for each mode.

SARK-110 User’s Manual
Rev 1.3.8 30 July 2018 - 12 - © 2011-2018, Melchor Varela –EA4FRB

SARK-110 User’s Manual
Rev 1.3.8 30 July 2018 - 13 - © 2011-2018, Melchor Varela –EA4FRB
2.5 Changing the Frequency
There are two methods of editing the frequency (center frequency for sweep modes):
(i) Use Navigator A to select «FREQ» in the main menu. Press the Select [■] button to display
the popup dialog associated with «FREQ». Then use Navigator B to change the frequency. The
frequency will change according to the current frequency multiplier that is highlighted in reverse
video. Use Navigator A to change the frequency multiplier position if needed. Press the Select
[■] button to validate the frequency selection. Press any other button to cancel the operation.
The screenshot below is of the frequency edit dialog, showing the highlighted frequency
multiplier positioned over digit 5 from right to left (frequency increments of 10 KHz).

SARK-110 User’s Manual
Rev 1.3.8 30 July 2018 - 14 - © 2011-2018, Melchor Varela –EA4FRB
(ii) Use Navigator A to select «FREQ» in the main menu. Then use Navigator B to change the
frequency. The frequency will change according to the current frequency multiplier. The
frequency multiplier can be changed from the popup dialog, see (i) above.
ØNote: the span range will be adjusted automatically if the resultant upper or lower
frequency entry causes it to fall outside operational limits.
2.6 Changing the Span
There are two methods of editing the Span:
(i) Use Navigator A to select «SPAN» in the main menu. Press the Select [■] button to display
the popup dialog associated with «SPAN». Then use Navigator B to change the span. The span
will change according to the current span frequency multiplier that is highlighted in reverse video.
Use Navigator A to change the span frequency multiplier position if needed. Press the Select [■]
button to validate the span selection. Press any other button to cancel the operation.
The screenshot below is of the span edit dialog, showing the span frequency multiplier
positioned over digit 6 from right to left (frequency increments of 100 kHz).

SARK-110 User’s Manual
Rev 1.3.8 30 July 2018 - 15 - © 2011-2018, Melchor Varela –EA4FRB
(ii) Use Navigator A to select «SPAN» in the main menu. Then use Navigator B to change the
span. The span will change according to the current span frequency multiplier. The span
frequency multiplier can be changed from the popup dialog, see (i) above.
2.7 Changing the Start and Stop Frequencies
For sweep modes it is also possible specifying the Start and Stop frequencies. Use Navigator A
to select «FREQ» or «SPAN» in the main menu and then press Navigator A to change the entry
mode. These main menu options will change to display «START» and «STOP». Pressing the
Navigator A again will revert to the «FREQ» and «SPAN» entry mode.
The screenshot below shows the main menu changed to allow the entry of «START» and
«STOP» frequencies.
Operation is similar to the «FREQ» or «SPAN» entry:
(i) Use Navigator A to select «START» or «STOP» in the main menu. Press the Select [■]
button to display the popup dialog. Then use Navigator B to change the frequency. The
frequency will change according to the current frequency multiplier that is highlighted in reverse
video. Use Navigator A to change the frequency multiplier position if needed. Press the Select
[■] button to validate the frequency selection. Press any other button to cancel the operation.
(ii) Use Navigator A to select «START» or «STOP» in the main menu. Then use Navigator B to
change the frequency. The frequency will change according to the current frequency multiplier.
The frequency multiplier can be changed from the popup dialog, see (i) above.

SARK-110 User’s Manual
Rev 1.3.8 30 July 2018 - 16 - © 2011-2018, Melchor Varela –EA4FRB
2.8 Frequency Presets
The analyzer provides predetermined frequency and span settings including the amateur radio
bands and other suitable settings. Use Navigator A to select «PRESET» in the main menu.
Press the Select [■] button to activate the Preset popup submenu. Use Navigator B to highlight
the desired preset. Press the Select [■] button to validate the preset selection. Press any other
button to cancel the operation.
See in the screenshot below the available presets:

SARK-110 User’s Manual
Rev 1.3.8 30 July 2018 - 17 - © 2011-2018, Melchor Varela –EA4FRB
2.9 Using Markers
The SARK-110 has two markers that can either be manually positioned by the user or set to
operate in automatic tracking mode. The markers indicate the horizontal and vertical position of
the point on which they are positioned. The horizontal position of a marker is shown by a dotted
vertical line which extends from the top to the bottom of the measurement diagram. The markers
information window, in blue background, shows the frequency (or distance in cable test mode)
and the two values that correspond to the plotted values at each of the markers.
Use Navigator A to select either «MARK 1» or «MARK 2» in the main menu.
Press the Select [■] button to activate the Marker popup submenu. Available options are:
«Enable» for activating or deactivating the marker, «Tracking» for selecting the tracking mode,
«Info»to display detailed information and «Center» to set the center frequency at the marker
position; see screenshot below:
The automatic tracking feature makes positioning of the markers easier, thus helping the user to
speed up measurements.
The following tracking modes are available:

SARK-110 User’s Manual
Rev 1.3.8 30 July 2018 - 18 - © 2011-2018, Melchor Varela –EA4FRB
•Peak Min (p)
•Peak Max (P)
•Absolute Min (m)
•Absolute Max (M)
•Value Cross Any (X)
•Value Cross Up (^)
•Value Cross Down (v)
The automatic positioning of markers is activated in the «Tracking» sub-option. Select the
tracking mode from any of the modes above and then the applicable parameter to track. In
addition, a detection value must be specified for the Cross detection modes.
For example, you could set Marker 1 to automatically track the minimum VSWR values in the
trace: «MARK 1» «Tracking» «Peak Min» «VSWR»; and Marker 2 to track the crossovers on
the 50-ohm impedance value: «MARK 2» «Tracking» «Cross Any»«Z» «50.0».
You could also program the unit to detect the bandwidth by setting «MARK 1» «Tracking»
«Cross Down» «VSWR» «2.0»; and «MARK 2» «Tracking» «Cross Up»«VSWR» «2.0».
Navigator B will be used to move to the different detection points, except for the Max and Min
tracking modes where logically there is only a single detection point.
The tracking mode for each marker is shown in the markers information window. This
information is displayed in red if either the data is not available or if the tracking condition cannot
be resolved; otherwise it is displayed in green.
The screenshot below shows Marker 1 tracking the minimum value of VSWR and Marker 2,
tracking all |Z| crossing at 50-ohms:

SARK-110 User’s Manual
Rev 1.3.8 30 July 2018 - 19 - © 2011-2018, Melchor Varela –EA4FRB
The «Info»option displays detailed information of the readings at the marker position, including
the difference in frequency between both markers. One possible use of this feature is
determining the VSWR bandwidth of an antenna.
Besides, the display includes the calculation of electrical length of a line that will be useful for
applications such as tuning stubs; see section 4.3.
The «Info»option can be also selected by pressing Navigator A when either «MARK 1» or
«MARK 2» are highlighted.
The «Center» menu option can be used to set the center frequency at the marker’s frequency
value.
This manual suits for next models
1
Table of contents
Other Seeed Measuring Instrument manuals
Popular Measuring Instrument manuals by other brands

Littelfuse Startco
Littelfuse Startco SE-135 manual

Mitutoyo
Mitutoyo 572-200-20 manual

BRUEL & KJAER
BRUEL & KJAER 2203 Instructions and applications

Endress+Hauser
Endress+Hauser Liquiphant FTL64 operating instructions

PCB Piezotronics
PCB Piezotronics P357B21 Installation and operating manual

AurAir
AurAir B1 quick start guide