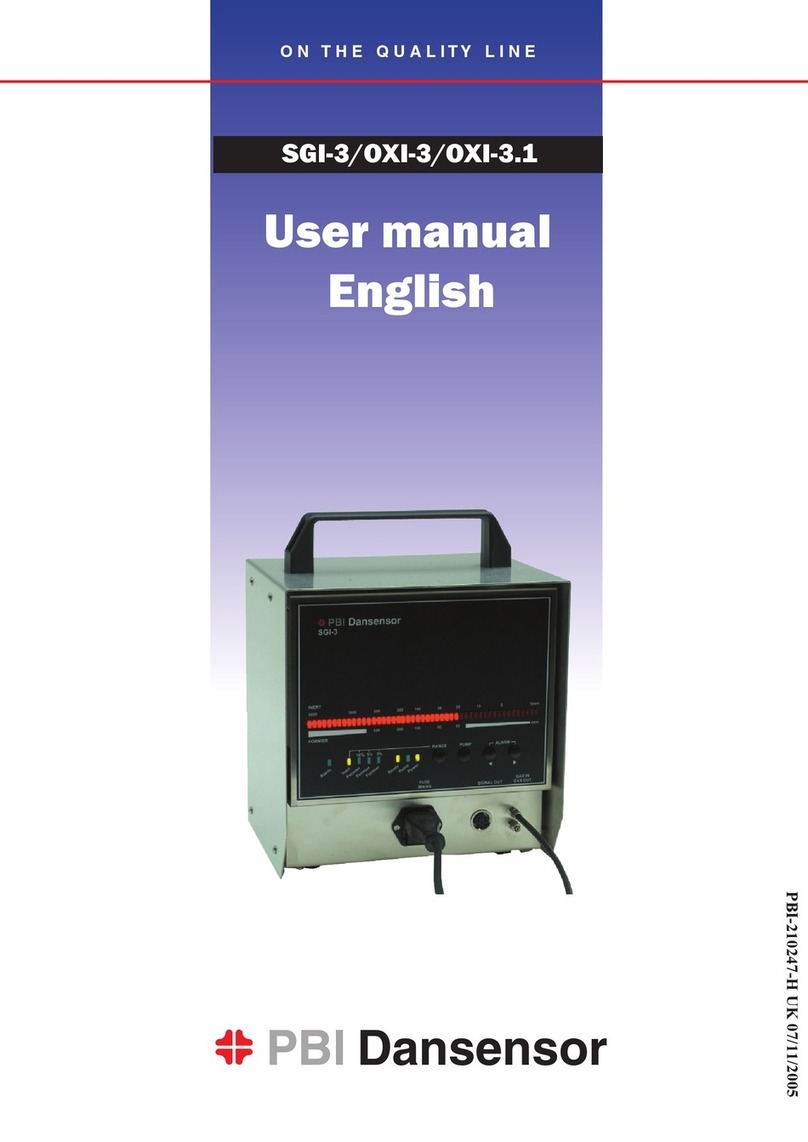
Sound Technology 1700B User manual

SOUND TECHNOLOGY
1400
Dell
Avenue
Campbell,
CA
95008
Tel:
(408)
378-6540
Telex:
357445
SOUND TECHNOLOGY
MODEL 17008
DISTORTION MEASUREMENT
SYSTEM
5-
T
Model
7700
Series
U.
S.
Patents:
3940775,
3978407,
4032857
Manual
Part
Number:
7900-0001
Manual
printed
in
U.S.A.
Copyright
July
1979

WARRANTY
All
new
Sound
Technology
products
are
warranted
against
defects
in
materials
and
workmanship
for two
years
from
the
date
of
delivery.
Any
instrument
or
component
that
is
found
to
be
defective
within
the
warranty
period
after
exami-
nation
by
Sound
Technology
or
an
authorized
representative
thereof
will
be
repaired
or
replaced
without
charge
for
labor
or
material.
No
other
warranty
is
expressed
or
implied.
We
are
not
liable
for
consequential
damages.
Before
returning
a
product
to
Sound
Technology
for
service,
authorization
must
be
obtained
from
the
factory.
For
products
not
covered
by
the
warranty,
a
purchase
order
should
be
forwarded
to
avoid
unnecessary
delay.
Please
include
instrument
model
number
and
serial
number
with
all
requests
for
parts
or
service
to faci I
itate
the
fastest
possible
response.
All
products
returned
to
the
factory
must
be
shipped
prepaid.
For
products
under
warranty,
Sound
Technology
will
pay
for
shipment
back
to
the
customer.

fSl
SOUND
L!:J
TECHNOLOGY
MANUAL
CHANGES
CHANGE SECTION 5 -
PARTS
LISTS -
AS
FOLLOWS:
1.
Page
5-1,
Parts
List:
AC
receptacle
(P/N:
3110-0000)
replaced
by
Line
Filter
(P/N:
3110-0005).
2.
Page
5-2,
Parts
List,
Oscillator:
R40
same
as
R8
(P/N:
1100-0051).
R34
now
392K,
1%
(P/N:
1016-3392).
RS
(500
ohm
trimpot)
now
P/N:
1410-0015.
R20 (SK
trimpot)
now
P/N:
1410-0017.
R7
(1M
trimpot)
now
P/N:
1410-0020.
3.
Pages
5-2/5-3,
Parts
List,
THD
Analyzer:
U108
same
as
U106
(P/N:
0100-0001).
U105
now
type
2605
grade
6
(P/N:
0100-0014).
R213
now
18.2K,
1%
(P/N:
1015-2182).
R203
now
120
ohms,
5%
{P/N:
1100-0120).
R359
now
750
ohms,
5%
{P/N:
1100-0750).
R167
and
R173
same
as
R130
{P/N:
1100-3100).
R170
same
as
R149 {P/N:
1100-4100).
R157
etc.
and
R354 {100
ohm
trimpot)
now
P/N:
1410-0013.
R146
etc.
{1K
trimpot)
now
P/N:
1410-0016.
R129
etc.
(lOOK
trimpot)
now
P/N:
1410-0019.
R351 (20K
trimpot)
now
P/N:
1410-0018.
C151
same
as
C107
{P/N:
2000-0027).
C211
now
68
pf,
5%
{P/N:
2000-0068).
Entry
for
P/N:
2040-0000
{.01
uf)
should
read:
C140,
141,219,
220,329,330,335,336.
4.
Page
5-3,
Parts
List,
Power
Supply:
R610
same
as
R604 {P/N:
1015-1422).
R609
same
as
R602
{P/N:
1015-1464).
R606
now
1.5K,
1%
{P/N:
1015-1150).
R607
now
9.09K,
1%
{P/N:
1015-1909).
R603
and
R614 {500
ohm
trimpot)
now
P/N:
14HY-0015.
5.
Page
S-3,
Parts
List,
Anal
Freq
3rd
Digit:
R67
now
392K,
1%
{P/N:
1016-3392).
R66
now
523K,
1%
{P/N:
1016-3523).
R65
now
806K,
1%
{P/N:
1016-3806).
R61
now
1.15M,
1%
(P/N:1016-4115).
R60now
1.33M,
1%
{P/N:1016-4133).
R59and
R64
now
1.58M,
1%
{P/N:
1016-4158).
R58
now
2M,
1%
{P/N:
1016-4200).
R57
now
2.67M,
1%
{P/N:
1016-4267).
R56
now
4.02M,
1%
{P/N:
1016-4402).
R55
now
8.06M,
1%
(P/N:
1
016-4806).
6.
Page
5-3,
Parts
List,
Osc
Freq
3rd
Digit:
R140, R149
now
392K,
1%
{P/N:
1016-
3392). R139, R148
now
523K,
1%
{P/N:
1016-3523).
R138, R147
now
806K,
1%
(P/N:
1016-3806).
R137, R146
now
1.58M,
1%
{P/N:
1016-4158).
7.
Page
S-3,
Parts
List,
Input
Switch:
R140
same
as
R103 {P/N:
1005-1698).
R119
now
909K,
1%
{P/N:
1016-3909).
8.
Page
5-3,
Parts
List,
Ratio
Switch:
C325
now
35
uf
(P/N:
2100-0023).

MODEL
1700B
MANUAL
CHANGE
INFORMATION
1.
The
Sound
Technology
Model
17008
incorporates
two
design
refinements
not
found
on
the
1700A: a
front
panel
SIGNAL
OFF
switch,
and
an
ANALYZER
SELECT
switch.
The
functions
of
these
switches
are
as
follows:
a.
SIGNAL
OFF:
When
depressed,
this
switch
replaces
the
front
panel
SIGNAL
OUTPUT
jack
with
a
floating
short
circuit.
This
enables
the
user
to
make
signal-to-
noise
ratio
measurements
without
the
necessity
of
dis-
connecting
cables.
b.
ANALYZER
SELECT:
When
depressed,
this
switch
isolates
the
INPUT
connectors,
and
allows
the
17008
to
monitor
the
signal
appearing
at
the
SIGNAL
OUTPUT
jack.
The
user
may
then
select
either
VOLTS/POWER
to
measure
the
voltage
output,
or
DISTORTION
to
measure
the
residual
distortion
of
the
output
signal.
2.
Late
production
versions
of
the
17008
incorporate
two
rear
panel
connectors
to
faci
I
itate
interconnections
be-
tween
the
1700B
and
the
Sound
Technology
Model
1200A
Stereo
Test
Panel.
These
connectors
are:
EXT
Fl
LTERS
and
SYNC
OUT;
their
use
is
fully
explained
in
the
1200A
Instruction
Manual.
3.
With
the
exception
of
the
added
switches
and
connec-
tors
as
described
above,
the
balance
of
this
manual
is
fully
usable
with
either
the
1700A
or
the
17008.
IMPORTANT
THE
PUSHBUTTON
SWITCHES
ARE
PERMANENTLY
LUBRICATED.
AP-
PLICATION
OF
ANY
LUBRICANT
OR
CONTACT
CLEANER
WILL
SHORTEN
THEIR
OPERATIONAL
LIFE.

Section
I
II
CONTENTS
OPERATION.
• • . • • • • • • • • • •
1-1.
SCOPE
OF
SECTION
• • . • •
1-2.
INTRODUCTION
••••.••
1-3.
INPUT
POWER
REQUIREMENTS
•
1-4.
POWER
CABLE.
• . • • • • •
1-5.
CONTROLS
AND
INDICATORS
••
1-6.
TEST
SETUP
• • • • •
••.•••
1-10
1-18.
1-7.
Power
Connections.
1-8.
Ground
Connections
1-9. Signal Connections
•••
OPERATING
PROCEDURES
• • • •
1-11. Test Connections
•••••••••.
1-12.
Meter
Zero
Mechanical
Adjustment •
1-13. Distortion
Measurement
•••••..•..•.
1-14. Distortion
Measurement
with External Oscillator
..
1-15.
AC
Voltage/Power
Measurement
••..
1-16.
AC
Voltage
Measurement-Extended
Range
...••
1-17. Voltage Ratio
Measurement
•••••..••.•
AUDIO
MEASUREMENTS
• • • • • • • • • • • • • • • • • . •
1-19.
Maximum
Power
Output
at
Rated
Total
Harmonic
1-20.
1-21.
Distortion
at
1
kHz
••.••.••.
Power
Bandwidth
••••.••••..
Hum
and
Noise/Signal-to-Noise Ratio.
PRINCIPLES
OF
OPERATION.
• • • • • . . •
2-1.
INTRODUCTION
• • • • • • • • • •
2-2.
DISTORTION
ANALYZER
••••••
2-3.
General
Description.
2-4. Buffer Amplifier
•••
2-5. Overload Detector
••
2-6.
Notch
Filter
•••••••••••.
2-7. Distortion Amplifier
and
Attenuator
•••
2-8.
Amplitude
Null
Control
•••
2-9.
Phase
Null
Control
••
2-10.
Sum-Point
Buffer •
2-11.
Tuning
Indicator •
2-12.
Filters
•.••••
2-13. Function Switches.
2-14.
AC
Meter
•••••
2-15.
OSCILLATOR
• • • • • • • •
••
Page
•
1-1
• .
1-1
•
1-1
• •1-1
•
1-1
•
1-1
•
1-3
•
1-3
.1-3
•1-3
• •
1-5
•
1-6
.
1-6
.1-6
.
1-7
.
1-7
.1-8
.1-8
•
1-9
•
.1-9
.
1-9
•1-10
•
••
2-1
.2-1
.2-1
.2-2
.2-2
.2-2
•
.2-2
.2-2
•
.2-2
.2-3
.2-3
.2-3
.2-4
.2-4
•
••
2-4
.2-4
2-16.
General
Description.
• • • •
.2-4
2-17.
Oscillator
Circuit
••
2-18.
Amplitude
Control
••
2-19.
POWER
SUPPLY
•••••••.••
2-20.
General
Description.
2-21. Input
Circuit
••
2-22. +
15
Vdc
Supply
.•••
2-23. -
15
Vdc
Supply. • • •
.2-4
.2-4
.2-6
.
.2-6
.2-6
.2-6
.2-7

Section
III
IV.
v.
CONTENTS,
Continued
MAINTENANCE.
• • . . • . • .
3-1.
INTRODUCTION
•..
3-2.
TEST
EQUIPMENT
• . • • • •
3-3.
PERFORMANCE
CHECK
••.•••••••••••
3-17.
3-18.
3-4. General Information
•••••••
3-5. Overall
System
Check
3-6. Distortion Test
.•.•••••
3-7.
Circuit
Common
Isolation
Check
3-8.
Oscillator
Check
••••••
3-9. Frequency Test
••.•••
3-10. Distortion Test
.•••••
3-11. Distortion Analyzer
Check
••
3-12.
dB
Volts Test
••.••
3-13. Volts
Power
Test
••••••
3-14.
Filters
Test
•.•••••
3-15. Residual
Noise
Test
•••••••••••
3-16.
Common
Mode
Rejection
Test.
ADJUSTMENT
AND
CALIBRATION
PROCEDURE
• •
•••••
OSCILLATOR
SECTION
• • . . • • • • • • • • • • •
Page
•••••
3-1
.3-1
.
3-1
.3-1
•
3-1
•
3-1
.
3-1
• •3-3
.3-3
• .3-4
.3-4
• .3-4
.3-4
.3-5
• .
3-5
.3-6
•
3-6
•3-6
.3-7
3-19.
+15
Volt Adjustment
••••.••••••••••
• .3-7
3-20. Photocell
AC
Voltage Adjustments
••••••••
• •
3-7
3-21.
Oscillator
Integrator Voltage
Change
Adjustment
••
• • •
3-7
.3-7
.3-8
.3-8
3-22.
Oscillator
Integrator Output
and
Adjustment
••
3-23.
Oscillator
XlOOO
Frequency
Range
Adjustment
•••
3-24.
3-29.
3-30.
3-31.
3-32.
ANALYZER
SECTION
• • • • • . • • • . • • • • . • •
3-25.
De
Zero
Adjustment
•••.••••.•••
3-26.
Null
Adjustment
•.••••••••.•••
3-26A.
Phase
Null
Integrator Voltage Adjustment •
3-27.
Tuning
Indicator Adjustment
•••..••
3-28. Calibration
at
1
kHz
••••••••••
TROUBLESHOOTING.
• • • • . • • • • • • • • • • • • •
SYMPTOM/CAUSE
TABLE
.•...••••••••••••
COMPONENT
REPLACEMENT
-
CALIBRATION
and
ADJUSTMENT
• •
REPLACEMENT
and
REPAIR
• • • • • • • • • • • • •
• .3-8
.3-8
• • • •
3-9
.3-9a
• .3-10
• •3-10
• •3-11
3-33. Special Precautions. •
•••
• •3-11
•
3-12
.3-12
3-34. Contamination. •
•••
3-35.
3-36.
3-37.
WIRir~G
• . • • • • • • • . • • •
•••••••
3-41.
DIAGRAMS
4-1.
4-2.
4-3.
SOLDERING
TECHNIQUES
.•••
COMPONENT
REPLACEMENT
••..
3-38. Multi-Lead
Devices
•
3-39. Potentiometers
..
3-40.
Power
Supply
• . .
FREQUENCY
MODULE
REPAIR.
. . •
3-42. General
.•••..•
3-43.
Removal/Replacement
••
3-44. Repair
Instructions.
INTRODUCTION
. . . . . . . .
SCHEMATIC
DIAGRAMS
. . . . .
COMPONENT
LOCATION
DIAGRAMS.
SPARE
PARTS.
• • . . . • • . .
5-l.
INTRODUCTION
•••.•
5-2.
ORDERING
INFORMATION
••
5-3
PARTS
LIST
.•
.
• .3-12
•
3-12
.3-12
•
3-12
•
••••
3-15
•
••..
3-15
•
3-15
.
3-15
•
••
3-15
•
••.•
3-15
• •
3-17
• .4-1
•.
4-1
.4-1
.4-1
•
•.
5-l
.
5-1
.5-1

1-1.
SCOPE
OF
SECTION
SECTION
I
OPERATION
The
section contains information
and
instructions
necessary for the operation of the
Sound
Technology
Model
1700A
Distortion
Measurement
System. Included are
power
requirements,
cabling information
and
operating
instructions.
1-2.
INTRODUCTION
The
Model
1700A
Distortion
Measurement
System
combines
an
ultra-low
distortion
os-
cillator,
a high-resolution automatic-measuring
distortion
analyzer,
and
an
accurate
ac
voltage/power meter in
one
instrument. Pushbutton operation permits the operator to
quickly
measure
voltage
or
power,
set
level,
and
then
measure
distortion.
The
oscillator
section provides a pure
sine
wave
signal for
testing
from
10
Hz
to
110
kHz.
Amplitude
is
variable
from
3 volts to
less
than 1
mV.
The
analyzer section contains a tracking notch
filter
which
is
always tuned to the os-
cillator
frequency.
The
analyzer measures
total
harmonic
distortion
with a
sensitivity
ran-
ging
from
100%
to
.01%
full
scale,
with automatic nulling
on
all
ranges. Active
filters
may
be
selected
for
low
frequency
and
high frequency noise suppression, enhancing the measure-
ment
resolution.
A
differential
front
end
rejects
common-mode
noise.
The
ac
voltage/power meter inherent in the analyzer measures
ac
voltage,
or
power
ac-
ross
an
8-ohm
external load.
The
measurement
range for
ac
voltage
is
3
mV
to
300
V
full
scale
(30
~V
to 1
mV
in Extended
Range
Para. 1-16)
and
for
power
is
1
~W
to
10
kW
full
scale.
Voltage
ratio
measurements with a
100
dB
or
more
of
dynamic
range
can
also
be
made.
1-3.
INPUT
POWER
REQUIREMENTS
The
Model
1700A
System
may
be
operated
from
either
a 95-125
volt
or
200-250
volt
50
to 60Hz
power
source. A two-position
selector
switch
on
the
rear
panel
selects
the
power
source. Before connecting the instrument to the
power
outlet,
check
that
the
selector
switch
setting
matches the
nominal
line
voltage
of
the source.
The
Model
1700A
System
is
protected
from
ac
power
overloads
by
a fuse (lA, fast-blown)
located in a
cartridge-type
fuse holder
on
the
rear
panel.
1-4.
POWER
CABLE
The
International Electrotechnical
Commission
(IEC)
recommends
that
instrument panels
and
cabinets
be
grounded to
protect
operating
and
servicing personnel.
The
Model
1700A
system
is
equipped with a three-conductor
power
cable assembly which,
when
plugged into the
appropriate
outlet,
grounds the
unit
through the
round
offset
pin.
1-5.
CONTROLS
AND
INDICATORS
The
data sheet
at
the
front
of
the
manual
illustrates
and
describes
briefly
the
Model
1700A
Distortion
Measurement
System's front panel controls
and
indicators.
The
following
provides additional explanatory information:
a.
POWER
ON
switch connects
ac
power
to
Model
1700A
System.
Pilot
lamp
glows
when
instrument
is
turned
ON.
b.
+INPUT
and
-INPUT
terminals
--
Provide connections
for
signal being measured.
c.
GND
(rfJ)
terminal Provides connection
to
chassis ground.
d.
c~
(~)
terminal Provides connection to
circuit
common.
e.
VOLTS/POWER
pushbutton--
Selects Volts
or
Power
measurement
function.
1-1

f.
INPUT
switch
--
Selects
full
scale
meter range
for
Volts
or
Power
measurement
function.
Readings are in
volts
rms
or watts.
g.
OVERLOAD
indicator
--
Indicator
is
lit
when
input signal overloads input
buffer.
This
warns
operator
that
Volts or
Power
measurement
is
no
longer accurate.
h.
i .
j.
k.
l.
m.
n.
o.
p.
q.
r.
s.
t.
SET
LEVEL
pushbutton
--
Selects Set
Level
function
whereby
meter displays reference
signal level
for
Distortion
or
Ratio measurement.
SET
LEVEL
ADJUST
--
Adjusts reference signal level for Distortion or Ratio measure-
ment.
When
control
is
set
to
CAL
position
(max.
counterclockwise),
RATIO
ranges
ex-
tend voltage measurement
capability
to
30
~V
full
scale (Paragraph 1-16).
DISTORTION
pushbutton
--
Selects Distortion
measurement
function.
dB
VOLTS
pushbutton
--
Selects Ratio
measurement
function.
RATIO
Switch
--Selects
full
scale
meter range for Distortion
and
Ratio measurement
functions.
Readings
are
in percent
or
dB.
NOTCH
FREQUENCY
indicators--
Facilitate
tuning
when
using
an
external
oscillator.
When
LOW
indicator
is
lit,
Model
1700A
System
frequency
is
low
with respect to in-
coming
signal,
when
HIGH
indicator
is
lit,
Model
1700A
System
frequency
is
high with
respect to incoming
signal.
System
is
correctly
tuned
when
both
indicators are
extinguished.
(It
is
normal
for
one
of these indicators
to
glow
when
there
is
no
input
to
the
1700A.)
SIGNAL
COMMON
switch
--
Switches
circuit
common
from
chassis ground, breaking
ground
loops.
FLOAT
position
floats
(disconnects)
circuit
common
of
System
from
chassis
ground; Chassis
Ground
(r,h) position connects
circuit
common
of
System
to chassis
ground.
FILTERS
--
400Hz pushbutton
selects
a
filter
which
suppresses low-frequency noise
(such as
60
Hz
hum)
below
400
Hz.
80
kHz
pushbutton
selects
a
filter
which
suppresses
high-frequency noise
above
80
kHz.
The
80
kHz
filter
also reduces
effects
of
AM
radio
station
pickup.
Both
filters
affect
meter reading only
on
Distortion
and
Ratio
measurement
functions.
They
do
not
affect
meter reading
on
Volts/Power,
and
Set
Level
measurement
functions.
The
400
Hz
filter
is
usable with fundamental frequencies
down
to
400
Hz
when
making
distortion
measurements.
METER
--
Indicates signal level
of
measurement
selected
by
Function pushbutton.
DISTORTION
OUTPUT
BNC
connector
--
Provides
distortion
product
of
signal being analyzed
(suitable
for
viewing
on
oscilloscope)
on
Volts/Power, Set Level,
and
Distortion
measurement
functions.
On
Ratio
measurement
function,
this
output provides a scaled
version
of
input
signal.
Output
is
31.6
mV
full
scale.
FAST
RESPONSE/LOW
DISTORTION
switch
--Selects
operating
mode
of
oscillator.
FAST
RESPONSE
causes
oscillator
amplitude to
settle
quickly
after
a frequency change.
This
mode
is
recommended
when
ultra-low
distortion
measurements are not required,
for
ex
amp
1e
when
making
frequency response measurements.
LOW
DISTORTION
se1
ects
full
ultra-low
distortion
capability
of
oscillator.
The
settling
time
in
this
mode
is
less
than 5 seconds. Actuation
of
FREQUENCY
pushbuttons generally causes
oscillator
to
go
first
to
FAST
RESPONSE
mode
and
then to
settle
in
LOW
DISTORTION
mode.
This
switch controls only the
oscillator
and
is
not connected to the
distortion
analyzer.
FAST
RESPONSE
indicator--
Indicates operating
mode
of
oscillator.
When
lit,
oscilla-
tor
is
in Fast Response
mode
and
does not
have
ultra-low
distortion.
FREQUENCY
pushbuttons --Simultaneously
select
oscillator
and
distortion
analyzer
fre-
quency.
Four
Multiplier
switches
and
30
Digit switches permit
3-digit
resolution
within each range. Frequency range of
Model
1700A
System
is
10
Hz
to 109.9
kHz.
One
button
in
each
row
must
be
depressed
at
all
times.
1-2

u.
OSCILLATOR
LEVEL
control
--Adjusts
amplitude of
oscillator.
Level
is
variable
from
3
volts
to
below
1
millivolt.
Control
is
single-turn logarithmic potentiometer.
v.
SIGNAL
OUTPUT
BNC
connector--
Provides
oscillator
output
signal.
Output
impedance
varies with
setting
of
OSCILLATOR
LEVEL
control
and
reaches a
maximum
of
625
ohms
at
mid-range.
w.
BUFFERED
INPUT
SIGNAL
BNC
connector (located
on
rear
panel)
--
Provides replica of
input signal being analyzed. This signal
is
referenced to
ground
and
intended to
be
connected to
an
oscilloscope.
1-6.
TEST
SETUP
In
order to ·take
full
advantage of the unique ultra-low
distortion
measuring cap-
abilities
of
the
Model
1700A
System
it
is
extremely imoortant
that
the cabling
between
the
Model
1700A,
the amplifier under
test,
and
other
test
equipment
be
connected in compliance
with the arrangement
shown
in Figure
1-1
and
described in the following paragraphs.
The
connections
and
controls
numbered
in Figure
1-1
are
similarly
identified
in the
test.
These
connections
have
been
found
to provide the
optimum
test
setup in
most
cases.
1-7.
POWER
CONNECTIONS
a.
Check
that
power
slide
switch
on
rear
panel
of
Model
1700A
is
set
to correct position
for
available
ac
power
(see Paragraph 1-3 for
details).
b.
Do
not
float
the
earth
ground
lead
of
the
power
cord of the
Model
1700A.
(The
dif-
ferential
input
makes
this
step unnecessary for breaking
ground
loops.)
c.
Plug
the
Model
1700A,
amplifier under
test
and
the oscilloscope
(if
used) closely to
each
other
into the
ac
power
bus.
1-8.
GROUND
CONNECTIONS
a.
Connect
Model
1700A
GND
(roh)
terminal (1) to
ground
terminal (chassis
ground)
of
am-
plifier
under
test.
NOTE
This reduces
common
mode
60-Hz
potential differences
and
provides a path to
ground
for
60-Hz
current
that
may
be
injected into the chassis
of
the amplifier
under
test
from
its
own
primary
power
circuits.
b.
Connect
oscilloscope
(if
used) to
BUFFEREDI~PUTSIGNAL
BNC
connector
(2)
on
rear
panel
of
Model
1700A
via cable (3).
NOTE
1. This output
is
from
the
differential
to single-ended converter in the
Model
1700A
which
provides a replica
of
the input
signal.
This signal
is
referenced to
ground.
2.
If
a
BNC
cable
is
not
used
for
this
connection, the oscilloscope
common
(low)
terminal
must
be
returned to the
Model
1700A
System
GND
(r,h)
terminal (1) via
a
direct
connection (4}.
c.
This completes the
ground
connections necessary for proper
Model
1700A
operation.
1-9.
SIGNAL
CONNECTIONS
CAUTION
CONNECTING
OSCILLATOR
OUTPUT
TO
A
HOT
CHASSIS
MAY
BLOW
FUSE,
F2
or
F3.
(Fuses located
on
bottom
of instrument. A
blown
fuse will
make
FLOAT
switch
ineffective
and
cause
hum
problems.)
DO
NOT
EXCEED
THE
INPUT
VOLTAGES
LISTED
BELOW
TO
PREVENT
BLOWING
FlOl
AND
Fl02.
With
Input
Range
Switch
--
3 V
and
Lower.
1.
300V
Below
60Hz
2.
50
V
Above
1
kHz
1-3

• 0
@
• 0
0.
0
0
1-4
c.
::s
+>
Q)
(/')
+>
VI
Q)
1-
c:(
0
0
r--.
..-
r-
Q)
"'0
0
:::E
..-
I
Q)
s...
::s
C'l
u..

a. Connect oscilloscope
(if
used)
to
DISTORTION
OUTPUT
connector (5) via cable
(6).
This
permits monitoring
the
distortion
products
of
the signal being analyzed.
NOTE
The
shell of the
DISTORTION
OUTPUT
BNC
connector
is
returned inside the
Model
1700A
System
to
circuit
common
through a 1
~F
capacitor.
The
shell of the rear-panel
BNC
connector
is
at
chassis ground.
The
above
connections place
this
1
~F
between
the
Model
1700A
System
circuit
common
and
the chassis
when
using
an
oscilloscope.
This permits reasonably
noise-free
viewing
of
the
waveforms
while
still
retaining
a
considerable
amount
of
immunity
to
ground
loop currents flowing
between
the
Model
1700A
SIGNAL
OUTPUT
and
the
input of the
amplifier
under
test.
b.
Turn
OSCILLATOR
LEVEL
control (7)
fully
counterclockwise
(minimum
level).
c. Set gain control
on
amplifier
under
test
to
its
lowest
setting.
d. Connect cable (8)
between
SIGNAL
OUTPUT
BNC
connector (9)
and
input
of
amplifier under
test.
e. Set
SIGNAL
COMMON
switch (10) to
FLOAT.
NOTE
This achieves
the
ultimate
rejection
of
unwanted
power-line
related
noise (es-
pecially
in the leads of the input
of
the
amplifier
under
test).
With
no
other
equipment
such
as
an
oscilloscope connected to the system,
there
is
only a
nominal
.001
~F
of capacitance
between
the
System
circuit
common
and
chassis ground.
The
corresponding reactance,
greater
than 2
megohms
at
60
Hz,
effectively
opens the
ground loops
between
the
Model
1700A
and
the
amplifier under
test.
f.
Connect output of
amplifier
under
test
to a
suitable
8
ohm
load
resistor.
(Load
resistor
should
be
in a location
free
from
any
ac
magnetic
field,
such as caused
by
a
power
transformer, to avoid
hum
pickup).
g.
Connect signal to
be
measured (voltage developed across 8
ohm
load)
between
+INPUT
and
-INPUT
terminals (11).
Use
shielded
twisted-pair
cable
for
this
connection
and
keep
test
leads as
short
as possible to avoid extraneous pick
up
from
stray
ac
fields.
h.
Connect shield (12)
of
input wiring to
COM
(
~)
terminal (13).
Leave
shield
(14)
at
other
end
unconnected.
NOTE
1.
The
input terminals
do
not
have
a
polarity
(as indicated)
for
ac
and
may
be
connected
either
way
with
no
damage
to the
amplifier
under
test.
2.
Each
INPUT
terminal
has
its
own
input
attenuator
and
buffer amplifier. In-
put
impedance
is
100
kilohm
from
each terminal to the
Model
1700A
System
circuit
common.
The
true
differential
input
circuits
of the
Model
1700A
System
help break
the ground loop
that
causes
60-Hz
pickup
on
the input leads of
most
measuring equip-
ment.
3.
Do
not connect
one
channel of
the
oscilloscope
directly
to the output of
the amplifier-under
test
as
this
can
upset the noise
rejection
capability
of the
Model
1700A
System
differential
input
circuitry.
If
it
is
absolutely
essential
to
monitor
this
signal,
leave the
ground
lead of the scope channel disconnected
from
the
amplifier
under
test.
1-lO.OPERATING
PROCEDURES
CAUTION
CONNECTING
OSCILLATOR
OUTPUT
TO
A
HOT
CHASSIS
MAY
BLOW
FUSE,
F2
or
F3.
(Fuses located
on
bottom of instrument. A
blown
fuse will
make
FLOAT
switch
ineffective
and
cause
hum
problems.)
DO
NOT
EXCEED
THE
INPUT
VOLTAGES
BELOW
TO
PREVENT
BLOWING
FUSES
FlOl
AND
Fl02.
1-5

With
Input
Range
Switch
--
3V
and
Lower
1.
300
V
Below
60Hz
2.
50
V
Above
1
kHz
1-11.
TEST
CONNECTIONS
Before
making
measurements
with the
Model
1700A
System,
ensure
that
the
equipment
has
been
connected
as
shown
in Figure
1-1
and
following the instructions given in Paragraphs
1-6
through 1-9.
1-12.
METER
MECHANICAL
ZERO
ADJUSTMENT
The
meter
is
correctly
zero
set
when
the pointer rests over the zero calibration
marks
on
the scale
when
the
Model
1700A
INPUT
switch
is
set
to
300
V,
the
VOLTS
POWER
pushbutton
is
depressed,
and
there
is
no
input signal (input leads disconnected).
To
adjust the zero
set
proceed
as
follows:
a. Rotate zero adjustment
screw
(lbcated
on
front
panel
below
meter) until pointer
is
left
of
zero.
Reverse
rotation until pointer
is
exactly
at
zero.
1-13.
DISTORTION
MEASUREMENT
To
measure
the
total
harmonic
distortion
of a
signal,
proceed
as
follows:
a. Set
FAST
RESPONSE/LOW
DISTORTION
switch to
LOW
DISTORTION
and
select
fundamental
test
frequency in
Hz
by
depressing appropriate
FREQUENCY
pushbuttons.
NOTE
1.
Four
Multiplier pushbuttons (Xl,
XlO,
XlOO,
XlOOO)
and
30
Digit pushbuttons
permit
3-digit
resolution of frequency
selection.
For
example,
453
Hz
would
be
selected
by
depressing the following pushbuttons:
Multiplier
XlO
lst.
Digit
40
2nd.
Digit
5
3rd. Digit
.3
Frequency
40xl0=400
5xl0=
50
•
3xl0=
3
453
Hz
The
11
100
11
Digit pushbutton provides a
10%
overlap
in
range.
For
example,
1010
Hz
can
be
selected in
two
ways:
Multiplier
lst.
Digit
2nd.
Digit 3rd. Digit
Freguencx
XlO
100
lOOxl0-1000
lxlO=
10
0
OxlO=
0
1010
Hz
XlOO
10
lOXlOO=lOOO
0
OxlOO=
0
•
1
.lxlOO=
10
1010
Hz
2.
In
the
Xl
range, operation of the frequency pushbuttons
may
not
always
cause
the
oscillator
to
go
through
its
automatic
stabilization
cycle.
If
the
oscillator
amplitude appears to
be
unstable, momentarily
set
the
FAST
RESPONSE/LOW
DISTORTION
switch to the
FAST
RESPONSE
position
and
then return
it
immediately to the
LOW
DIS-
TORTION
setting.
b.
Depress
VOLTS
POWER
pushbutton
and
set
ADJ.UST
contro1 fully
CCW
to
CAL
position.
c. Set
INPUT
switch to expected
range
setting.
d. Adjust
OSCILLATOR
LEVEL
control and/or gain control
on
amplifier
under
test
for
de-
sired
voltage/power level as indicated
on
Model
1700A
meter.
Up
range
INPUT
switch
when
meter pointer passes
full
scale
and
down
range
when
meter pointer
goes
below
1/3
of
full
scale.
1-6

NOTE
If
OVERLOAD
indicator
lights
and
meter reads
less
than full
scale,
meter reading
is
incorrect
due
to
ADJUST
control being
incorrectly
set.
To
regain accuracy, turn
ADJUST
control
down
(CCW)
until
OVERLOAD
light
is
OFF.
e. Depress
SET
LEVEL
pushbutton
and
rotate
set
level
ADJUST
control until meter pointer
rests
on
SET
LEVEL
mark.
f.
Depress
DISTORTION
pushbutton
and
rotate
RATIO
switch
until
meter
pointer
reaches upper
2/3's
of
scale.
If
desired,
depress 400Hz and/or
80
kHz
FILTER
pushbutton to
filter
noise
from
input
signal.
g. Observe
distortion
either
in percentage or
dB,
as
indicated
by
meter
deflection
and
RATIO
switch
·setting.
For
example,
if
meter reads .67
and
RATIO
setting
is
.1%,
dis-
tortion
measured
is
.067%.
1-14.
DISTORTION
MEASUREMENT
WITH
EXTERNAL
OSCILLATOR
a.
Connect
equipment
as
shown
in Figure 1-1, with the following exceptions:
1. Connect
power
cord of external
oscillator
to
power
source close to source
used
by
Model
1700A,
amplifier
under
test,
and
oscilloscope.
2. Connect output
of
oscillator
to input of amplifier under
test.
The
oscillator
output
may
be
floated
if
this
gives
better
test
results.
3. Connect chassis
of
oscillator
to
GND
(r.h)
terminal
on
Model
1700A.
4. Set
SIGNAL
COMMON
switch
on
Model
1700A
to~(ground)
position.
b. Set external
oscillator
to desired frequency
and
signal
level.
c.
Preset
Model
1700A
FREQUENCY
pushbuttons
to
approximate frequency
of
external
oscil-
lator.
d. Set
ADJUST
control
fully
counterclockwise
(CCW)
to
CAL
position
and
depress
VOLTS
POWER
pushbutton.
e.
Set
INPUT
switch to expected range.
f.
Adjust external
oscillator
amplitude control and/or gain control of amplifier under
test
for
desired voltage/power level as indicated
on
Model
1700A
meter.
g. Depress
SET
LEVEL
pushbutton. Rotate
ADJUST
control
until
Meter
pointer
rests
on
SET
LEVEL
mark.
h. Set
1700A
frequency or external
oscillator
frequency
so
both
NOTCH
FREQUENCY
indicators
are
off
and
that
the tuning
is
approximately centered.
i.
Depress
DISTORTION
pushbutton
and
set
RATIO
switch
so
that
meter pointer
rests
within
upper
2/3's
of
scale.
If
desired,
depress 400Hz and/or
80
kHz
pushbutton to
filter
noise
from
input
signal.
j.
Observe
distortion
in
either
percentage or
dB,
as
indicated
by
meter
deflection
and
RATIO
range
setting.
1-15.
AC
VOLTAGE/POWER
MEASUREMENT
The
Model
1700A
is
an
accurate
ac
voltage/power meter over
its
entire
frequency range.
The
power
scale
is
calibrated
for
an
8-ohm
load,
which
must
be
provided
externally.
Vol-
tage
may
be
measured
directly
from
3
mV
to
300
V
full
scale
and
power
from
1
uV
to
10
kW
full
scale.
To
measure
ac
voltage or
power,
proceed
as
follows:
a. Ensure
that
the
power
and
ground connections are
as
described
in
Paragraphs 1-7
and
1-3
respectively.
1-7

b.
c.
d.
Connect signal to
be
measured between +
INPUT
and
-
INPUT
terminals.
Use
shielded
twisted-pair
cable
for
low-level inputs. Connect
shield
to
COM
(~)
terminal.
Set
ADJUST
control to
CAL
position
and
depress
VOLTS
POWER
pushbutton.
Rotate
INPUT
switch
for
an
on
scale
reading
(pointer
in upper
2/3's
of
scale).
NOTE
The
400
Hz
and
80
kHz
FILTERS
do
not
affect
readings
on
the ac Voltage
Power
measurement function.
1-16.
AC
VOLTAGE
MEASUREMENT-
EXTENDED
RANGE
The
sensitivity
of
the ac voltmeter
can
be
extended to
30
~V
full
scale through the
use of
the
RATIO
switch.
To
obtain
this
increased
sensitivity
carry out the following
steps:
a.
b.
c.
d.
Ensure
that
power
and
ground connections
are
as
described in Paragraphs 1-7
and
1-8
respectively.
Connect signal to
be
measured between +
INPUT
and
-
INPUT
terminals.
Use
shielded
twisted-pair
cable
for
signal connection. Connect
shield
to
COM
(~)
terminal.
Set
Model
1700A
controls
as follows:
dB
VOLTS
switch
---------------------------------------
depressed
INPUT
switch
------------------------------------------
.3
V
ADJUST
control
----------------------------------------
CAL
Meter
full
scale
sensitivity
is
now
controlled
by
RATIO
switch as follows:
RATIO
switch
-80
dB
-70
dB
-60
dB
-50
dB
NOTE
Full Scale
Sensitivity
30
llv
100
llV
300
J.!V
1
mV
The
400Hz
and
80kHz
FILTERS
will
affect
meter readings in
this
mode
of
opera-
tion.
1-17.
dB
VOLTS
MEASUREMENTS
The
dB
Volts function
facilitates
the measurement
of
voltage
ratio,
signal-to-noise
ratio,
and frequency response, in
dB
or
percent.
The
signal-to-noise
ratio
measurement
described
below
provides
an
example
of
the
use
of
this
function.
a.
Ensure
that
power
and
ground connections
are
as
described in Paragraphs 1-7
and
1-8
respectively.
b. Set
ADJUST
control to
CAL
position
and
depress
VOLTS
POWER
pushbutton.
c.
Set
INPUT
switch to expected range
and
adjust
appropriate signal level
controls
for
desired
output
signal,
as indicated
on
meter.
d. Depress
SET
LEVEL
pushbutton
and
rotate
ADJUST
control
until
meter
pointer
rests
on
0
dB
mark.
NOTE
For proper 0
dB
or
100%
set
level,
reference signal
must
be
at
least
.1 V
and
not exceed
300
V.
e.
Remove
input signal
to
amplifier
under
test
and
replace with a
short
circuit
across
am-
plifier's
input
terminals.
Set
SIGNAL
COMMON
switch to
rt
1 (ground)
position.
1-8

NOTE
When
the input signal
to
the
amplifier
under
test
is
removed
and
replaced with a
short,
this
floats
entire
Model
l?OOA
measuring
circuits.
Proper grounding
can
be
restored
by
setting
the
CIRCUIT
COMMON
switch
to
the
r.h
(ground)
position.
f.
Depress
dB
VOLTS
pushbutton.
Select
RATIO
switch range
which
places meter
pointer
in
upper
2/3's
of
scale,
Read
test
result
in
dB.
g.
At
end
of
signal-to-noise
ratio
measurement, return
SIGNAL
COMMON
switch to
FLOAT
position.
1-18.
AUDIO
MEASUREMENTS
Operating
instructions
for
performing
certain
audio measurements as
specified
by
the
Institute
of
High
Fidelity
(1960) are given below.
For
these
tests,
ensure
that
the
fol-
lowing
test
conditions are maintained:
a.
b.
c.
d.
e.
f.
g.
Line:
120
V
~
1%,
60
Hz,
less
than
2%
total
harmonic
distortion.
0
Temperature:
25
~
3
C.
Preconditioning: Unit under
test
should
be
preconditioned
for
1
hour
at
1/10 rated
power.
(FTC
requires 1/3 rated power).
Amplifier
Gain
Controls: Set to
maximum.
Amplifier
Tone
Controls:
Flat.
Amplifier Balance Control: Set to normal.
Test Equipment:
Model
l?OOA
exceeds
all
IHF
requirements
for
test
equipment accuracy.
1-19.
MAXIMUM
POWER
OUTPUT
AT
RATED
TOTAL
HARMONIC
DISTORTION
AT
1
kHz
NOTE
Amplifier
must
be
able to maintain
this
power
for
30
seconds.
a.
Set
Model
1700A
for
frequency output 1
kHz.
b. Connect
SIGNAL
OUTPUT
to
amplifier's
AUX
or
TAPE
INPUT
on
all
channels.
c.
Set
RATIO
SWITCH
so
that
amplifier's
rated
distortion
gives
maximum
on-scale reading,
and
observe
distortion
products
on
oscilloscope.
d. Increase
OSCILLATOR
LEVEL
setting
until
distortion
products
on
oscilloscope
are ex-
cessive while (1) monitoring
power
with
VOLTS
POWER
pushbutton depressed
and
(2)
keeping signal
on
scale
with
INPUT
switch.
e.
When
excessive
distortion
products are
present,
refine
measurement
by
adjusting
OS-
CILLATOR
OUTPUT
while measuring
distortion
until
the
amplifier's
rated
distortion
is
reached.
f.
Switch
Model
l?OOA
to
VOLTS
POWER
function
and
determine
amplifier's
power
eutput
at
rated
distortion.
1-20.
POWER
BANDWIDTH
a.
Maintain
test
setup
as
described in Paragraph
l-19.
b. Adjust
amplifier
level
until
power
is
3
dB
beiow
rated
power
(1/2
power)
at
midband
(full
rated
power
for
FTC).
c. Increase
Model
l?OOA
frequency in steps
from
midband
while measuring
distortion.
Stop
when
distortior'l
is
equal to
amplifier's
specifications.
This
is
upper
power
band-
width
point.
l-9

d. Repeat step
c,
this
time decreasing
Model
1700A
frequency until lower
power
bandwidth
point
is
found.
The
result
may
be
expressed
briefly
(for
example:
Power
Bandwidth
=
15Hz to 37kHz);
or
it
may
be
shown
as
a graph of
distortion
versus frequency, with
power
held constant
at
3
dB
below
rated power.
1-21.
HUM
and
NOISE
or
SIGNAL-to-NOISE
RATIO
Make
this
measurement
following the
instructions
given in Paragraph 1-17 for measuring
voltage
ratios.
Drive the amplifier to
its
rated
power
output with gain controls
set
to
maximum.
Then
remove
the input
and
obtain a
dB
ratio
reading
as
described in 1-17.
1-10

2-1.
INTRODUCTION
SECTION
II
PRINCIPLES
OF
OPERATION
The
Model
1700A
Distortion
Measurement
System
consists
of
an
ultra-low
distortion
os-
cillator,
a
total
harmonic
distortion
analyzer,
and
a
de
power
supply.
The
system
makes
total
harmonic
distortion
measurements
by
applying a sine-wave of ultra-low
distortion
from
the
oscillator
to the input
of
the amplifier under
test
while the
distortion
analyzer
measures the amplifier output. A tunable notch
filter
in the analyzer, mechanically
ganged
to the
oscillator
by
the
front
panel frequency
select
switches, suppresses the fundamental
signal.
Automatic nulling
circuitry
fine
tunes the notch
filter
and
ensures
that
the null
is
retained.
The
signal remaining
at
the output
of
the notch
filter
consists of the
dis-
tortion
products
and
noise.
This
is
displayed
by
an
average-reading voltmeter in the
analyzer.
The
ratio
of
the
measured
distortion
components
to a previously
set
fundamental
signal reference level
is
defined
as
the
total
harmonic
distortion
and
can
be
read out
directly
on
the meter in percent
or
dB.
Switchable low-frequency
and
high-frequency
filters
are
provided to enhance the readout
of
the harmonic products.
Other
features
of
the
Model
1700A
include separate Voltage
and
Distortion
measurement
range switches, separate Set
Level
monitoring without range changing,
and
automatic nul-
ling
on
all
ranges.
The
power
supply provides regulated
de
voltages of
+15
volts
and
-15
volts to
power
the
oscillator
and
analyzer.
Both
of
these supplies are
internally
protected against
accidental short
circuit.
2-2.
DISTORTION
ANALYZER
2-3.
GENERAL
DESCRIPTION
Refer
to
Figure 4-2
for
a schematic diagram of the
distortion
analyzer assembly.
Note
that
the
circuit
is
divided into the following
circuit
blocks: Buffer
amplifier,
overlaod
detector,
notch
filter,
distortion
amplifier
and
attenuator,
amplitude null
filters,
fun-
ction switches,
and
ac
meter.
The
operation
of
the assembly
is
discussed
first
at
a
circuit
block level
and
is
then followed
by
details
of
each
block.
In
operation, the signal to
be
measured
is
connected to the input
of
the buffer
amp-
lifier.
This
circuit
has
two
outputs: a fixed output
which
may
be
connected to the
ac
voltmeter,
and
a
variable
output
(controlled
by
the
ADJUST
control)
which
is
connected to
the notch
filter.
The
voltmeter
is
an
average reading type
which
measures the signal level
selected
by
the appropriate function switch.
The
overload
detector
monitors the variable output
of
the buffer amplifier.
If
an
excessively high output voltage
is
detected,
the
detector
turns
on
the
front
panel
OVER-
LOAD
indicator.
The
notch
filter
is
mechanically
ganged
to the
oscillator
frequency
select
switches
and
suppresses the fundamental
from
the output
of
the buffer amplifier.
The
output
of
the notch
filter
is
connected to the input
of
the
distortion
amplifier through a step
attenuator
controlled
by
the
front
panel
RATIO
switch.
The
attenuator
adjusts signal
level
for
the
distortion
amplifier
for
various percentages
of
distortion
or
ratio
readings.
The
amplitude null control
and
phase null control
circuits
supply the notch
filter
with
its
automatic nulling feature.
Both
circuits
monitor the output
of
the
distortion
amplifier
and
feed control signals back to the notch
filter.
The
sum-point buffer supplies reference signals to the tuning
indicator
and
to the
amplitude null control
circuit.
The
tuning
indicator
circuit,
using frequency information
from
the notch
filter,
provides the operator with a visual indication of the frequency being analyzed versus the
input frequency. This
circuit
operates the
NOTCH
FILTER
HIGH
and
LOW
indicators.
The
switchable low-frequency
and
high-frequency
filters
are connected to the output
of the
distortion
amplifier.
This permits
them
to
be
selected for
DISTORTION
and
dB
VOLTS
measurements only.
2-1

The
switchable low-frequency
and
high-frequency
filters
are connected to the output
of
the
distortion
amplifier.
This permits
them
to
be
selected
for
DISTORTION
and
dB
VOLTS
measurements only.
The
function switches
select
the
circuit
to
be
measured
by
the
ac
voltmeter.
When
the
VOLTS
POWER
switch
is
depressed, the meter monitors the output via a stepped
attenuator
from
the
buffer
amplifier.
When
the
SET
LEVEL
switch is depressed, the meter monitors the
variable
output of the buffer
amplifier.
Operation
of
the
DISTORTION
switch routes the
signal
from
the
distortion
amplifier
via the low-frequency
and
high-frequency
filters
(if
selected)
to the meter.
When
the
dB
VOLTS
switch
is
depressed,
it
connects the
variable
output
from
the buffer amplifier
directly
to the
attenuator
at
the input of the
dis-
tortion
amplifier
and
hence to the meter.
2-4.
BUFFER
AMPLIFIER
The
input of the buffer
amplifier
contains a
pair
of
step
attenuators,
one
for
each
INPUT
connector.
The
attenuators
are controlled
by
Sections SlA,
B,
C,
D
of
the
INPUT
switch.
The
attenuator
outputs
are
connected to input signal preamplifiers
UlOl
and
Ul02.
The
gain of these
units
is
controlled
by
section
SlE
of
the
INPUT
switch.
Gain
is
unity
on
the 3 Vrange
and
above, 3.16
on
the 1 Vrange,
and
10
on
the
.3
V range
and
below.
The
preamplifier
outputs are coupled to Ul03, a bridge
amplifier
circuit
which
effectively
acts as a
differential
to single-ended converter with
high
common-mode
noise
rejection.
The
gain
of
the bridge
amplifier
is
controlled
by
ADJUST
potentiometer
Rl25
and
provides
the
variable
signal supplied
by
the
buffer.
The
range
of
gain
is
10
dB
and
full
scale
voltage
is
3.16
volts.
The
fixed output
from
the buffer
is
obtained
between
the wiper
of
Rl25
and
ground. This signal remains fixed regardless
of
the
setting
of
Rl25, except
when
the
buffer
overloads.
2-5.
OVERLOAD
DETECTOR
The
overload
detector
signals
an
overload condition
when
the variable output
of
the
buffer
amplifier
exceeds approximately
6.5
volts
rms
sine
wave
or
9 volts peak.
The
circuit
consists
of
comparator Ul07, a half-wave
rectifier
and
filter,
a
light-emitting
diode
driver,
and
OVERLOAD
indicator
CR120.
2-6.
NOTCH
FILTER
The
notch
filter
consists
of
two
90-degree phase
shifters
connected in
series,
making
the
output
180
degrees out of phase with the
input.
By
summing
the input
and
output
at
summing
amplifier
U203,
the fundamental
of
the input signal
is
cancelled
out.
Feedback
from
the output
of
the
summing
amplifier
to the input
of
the
filter
increases the Q
of
the
circuit
and
narrows the
rejection
band
of
the
filter.
Tuning
is
controlled
by
changing a
set
of
RC
elements
for
each phase
shifter
through
operation
of
the
front
panel
Multiplier
and
Digit pushbutton switches.
When
the reactance
of
the capacitance equals the
resistance
at
the incoming frequency, the phase
shift
is
90
degrees.
The
RC
components are contained in the frequency
module
(see Figure 4-5 for
schematic diagram).
2-7.
DISTORTION
AMPLIFIER
AND
ATTENUATOR
The
output of the notch
filter
is
coupled through a
7-step
attenuator
to the input
of
distortion
amplifier
U204.
The
attenuator
is
controlled
by
section
S2D
of
the
front
panel
RATIO
switch
and
reduces the
distortion
product of the notch
filter
such
that
the
full
scale
voltage input to the
amplifier
is
1
mV
on
ranges
.03%
through
100%
and
.316
mV
on
the
.01%
range.
Amplifier
U204
is
a wide-band high-gain
unit
with gain controlled
by
section
S2E
of
the
RATIO
switch.
The
gain
is
31.6
for
ranges
.03%
through
100%
and
100
for
the
.01%
range. This gives a
full
scale
output voltage
of
31.6
mV
on
all
ranges.
2-8.
AMPLITUDE
NULL
CONTROL
The
amplitude null control
circuit
controls the amplitude
of
the signal
from
the
cascaded phase
shifter
so
that
exact balance occurs
when
it
is
summed
with the input to
the phase
shifters.
This ensures the
total
cancellation
of
the fundamental
signal.
The
components
which
perform
this
function include phase
detector
U310,
floating
integrator
and
voltage follower
U312,
integrating
amplifier
U311,
integrating
capacitors,
and
a
photocoupler
controlling
a variable
resistor
element in the
summing
network.
2-2

The
reference
input
to
phase
detector
U310
is
a signal
which
is in phase with the fun-
damental
and
the
signal
input to
U310
is
the
distortion
product output
of
the
distortion
amplifier.
With
these
inputs,
the phase
detector
monitors the notch
filter
output
for
an
in-phase
signal.
When
this
occurs the output
of
the phase
detector
supplies drive to the
integrator
causing
the
charge
on
the
integrating
capacitors to change. This in turn causes
the photocoupler to change the value
of
the
variable
resistor
which
in
effect
adjusts
the
summing
current
until
the in-phase
component
is
no
longer
there.
The
integrating
capacitors
are changed
by
the
RATIO
attenuator
S\vitch. This in
effect
maintains the automatic null control loop gain
at
a
relatively
constant
level,
resulting
in
high-speed nulling
on
all
ranges.
The
capacitors
are
precharged to the
integrator
output
voltage level through
resistor
R360.
This avoids switching
transients
and
improves the
speed
of
the
circuit.
2-9.
PHASE
NULL
CONTROL
The
phase null control
circuit
fine
tunes the phase of the second phase
shifter
in the
notch
filter
so
that
the overall phase
shift
is
exactly
180
degrees. This ensures
total
cancellation
of
the fundamental
signal.
The
components
which
perform
this
function include
phase
detector
U307,
floating
integrator
and
voltage follower
U309,
integrating
capacitors,
and
a photocoupler
controlling
a
variable
resistor
in the
resistive
branch
of
the second
phase
shifter.
The
reference
input
to phase
detector
U307
is
the
distortion
product output of the
distortion
amplifier.
With
these inputs the phase
detector
monitors the notch fi
Iter
output
for
an
out-of-phase
signal.
When
this
occurs, the phase
detector
output supplies drive to
the
integrator
causing the charge
on
the
integrating
capacitors to change.
The
integrator
output drives the
variable
gain
amplifier,
U313,
and the voltage to
current
converter,
U314,
which
in turn causes
the
photocoupler to
change
the value of the
variable
resistor
which
in
effect
adjusts
the phase angle
until
the out-of-phase
component
is
no
longer
there.
The
integrating
capacitors are changed
by
the
RATIO
attenuator
switch. This in
effect
maintains the automatic null control loop gain
at
a
relatively
constant
level,
resulting
in
high-speed nulling
on
all
ranges.
The
capacitors are precharged to the
integrator
output
voltage level through
resistor
R344.
This avoids switching
transients
and
improves the
speed
of
the
circuit.
A
set
of
resistors
that
feed signal
from
integrator
U308
to
U313,
which
acts
as a gain
control,is
switched
by
the
front
panel
FREQUENCY
switches. This maintains a
relatively
constant
integrator
voltage
when
frequency
is
changed
and
helps to achieve
perfect
nulling
in
less
than 5 seconds.
2-10.
SUM-POINT
BUFFER
The
sum-point
buffer
supplies a signal
from
the notch
filter
summing
point
to the
tuning
indicator
and
the
amplitude null
control,
each
of
\vhich
uses the signal
as
the
reference input to a phase
detector.
The
buffer
consists
of unity-gain
amplifier
U301
and
high-gain high-speed amplifier
U302.
These
components convert the
sine
wave
at
the
summing
point
into a square
wave
signal.
2-11.
TUNING
INDICATOR
The
tuning
indicator
monitors the phase
relationship
between
the signal input to the
notch
filter's
first
phase
shifter
and
its
output.
The
relationship
is
frequency de-
pendent
and
is
90
degrees
when
the incoming frequency
is
exactly the
same
as
the tuned
fre-
quency
of
the notch
filter.
The
components performing
this
function include phase
detector
U303,
high-speed
amplifier/drivers
U304,
U305
and
HIGH
and
LOW
indicators
CR301,
CR302.
The
reference
input
to phase
detector
U303
is
the signal
at
the input to the phase
shifter
(connected via
the
sum-point buffer)
and
the signal input to
U303
is
the output
of
the phase
shifter.
When
the incoming frequency
is
exactly the
same
as
the tuned
fre-
quency
of
the notch
filter
(90-degree phase
relationship),
there
is
no
output
from
the
phase
detector.
Under
these conditions both
indicators
are
off.
However,
if
the
fre-
quency
of
the notch
filter
is
high
compared
with the input frequency,
U303
produces a
de
output
which
turns
on
the
HIGH
indicator.
Conversely,
if
the frequency of the notch
filter
is
low
compared
1vith
the input frequency, a
de
output
of
the opposite
polarity
from
U303
turns
on
the
LOW
indicator.
2-3

2-12.
FILTERS
Each
filter
is
an
active
3-pole Butterworth having a
flat
response within
its
pass-
band
and
an
attenuation
slope of -18 dB/octave.
The
-3
dB
point
is
80
kHz
for
the
low-
pass
filter
and
400Hz
for
the high-pass
filter.
2-13.
FUNCTION
SWITCHES
The
function switches
select
the
circuit
to
be
measured
by
the
ac
voltmeter.
When
the
VOLTS
POWER
switch
is
depressed the meter monitors the fixed output, via a
step
attenuator,
from
the
buffer
amplifier.
When
the
SET
LEVEL
switch
is
depressed, the meter monitors the
signal
from
a
divider
connected to the
variable
output
of
the buffer
amplifier.
Operation
of
the
DISTORTION
switch routes the signal
from
the
distortion
amplifier via the low-frequency
and
high-frequency
filters
(if
selected) to the meter. This connection
is
not
made
directly
by
the
DISTORTION
switch but
by
the release
of
the
SET
LEVEL
and
VOLTS
POWER
switches
which
occurs automatically
when
the
DISTORTION
switch
is
depressed.
When
the
dB
VOLTS
switch
is
depressed,
it
connects the variable output
from
the buffer amplifier
directly
to the
at-
tenuator
at
the input
of
the
distortion
amplifier
and
hence
to the meter.
2-14.
AC
METER
The
ac
meter
circuit
consists
of
high-gain wide-band amplifier
Ul04,
a full-wave
bridge
rectifier
circuit,
and
de
milliammeter
Ml.
It
indicates the average value of
an
ac
signal.
The
input
sensitivity
is
31.6
mV
full
scale.
The
gain
of
the meter
is
adjusted
by
potentiometer
Rl57.
2-15.
OSCILLATOR
2-16.
GENERAL
DESCRIPTION
Refer to Figure 4-4
for
a schematic diagram of the
oscillator
assembly.
The
oscillator
is
basically
a
Wein
bridge type with a unique ultra-low
distortion
amplitude control
cir-
cu.it. This control
circuit
provides (1) wide frequency range (2)
fast
settling
(3)
flat
frequency response
and
(4) ultra-low
distortion.
No
one
of
these
characteristics
is
sacrificed
in order to achieve
an
improvement
in the
others.
The
oscillator
has
two
operating
modes
-Fast
Response
and
Low
Distortion.
When
Fast
Response
is
selected
the
oscillator
amplitude
settles
quickly
after
a frequency change;
when
Low
Distortion
is
chosen, the
oscillator
settling
time to
.002%
distortion
is
less
than 5 seconds.
Built-in
control
circuitry
automatically guides the
oscillator
through
these
modes
whenever
there's
disturbance to the amplitude,
for
example, a change of
fre-
quency
setting.
2-17.
OSCILLATOR
CIRCUIT
The
basic
Wein
bridge
oscillator
consists
of a reactive
positive
feedback network
and
a
resistive
negative feedback network, both
of
which
are
tied
to the output of
oscillator
amplifier
Ul.
The
positive
feedback network feeds
back
to the
positive
terminal of the
amplifier
and
the negative feedback network
is
coupled to the negative terminal of the
amplifier.
Frequency
of
oscillation
is
determined
in
the
positive
feedback network
by
the
relationship:
f =
---,2::---'-7T--:R::-:::C:--
Where
front
panel
Multiplier
switches change a
set
of capacitors for each frequency
range
and
the Digit switches change the
resistance
value.
These
components
are located
in
the
frequency
module
(see Figure 4-5
for
schematic diagram}.
2-18.
AMPLITUDE
CONTROL
The
ultra-low
distortion
amplitude control
circuit
consists
of
two
control loops:
A high-speed loop
and
a low-speed loop. These
two
loops, acting together,
effectively
vary the negative feedback
ratio
to regulate the
oscillator
amplitude.
2-4
Table of contents
Other Sound Technology Measuring Instrument manuals
