Suin SA2100 User manual

User’s Guide
SA2100/SA2100E
Power Quality Analyzer
Shijiazhuang Suin Instruments Co.,Ltd. 12/2016

SA2100/ SA2100E Power Quality Analyzer User’s Guide
Shijiazhuang Suin Instruments Co.,Ltd.
-1-
Introduction
With dual DSP processor architecture, large-scale integrated circuits (FPGA), and embedded
system (uClinux), the SA2100/ SA2100E Power Quality Analyzer can calculate a large number
of electrical parameters and process all data quickly. The Analyzer is designed specially for
power inspection and maintenance department, offering extensive and powerful measurements
to check power distribution system, detecting quality and electrical characteristics of power
grid rapidly and conveniently. The analyzer has large-screen color LCD display interface, and
easy-to-use keyboard.
Main features:
Waveform real-time display(4 voltages/4 currents)
Half cycle RMS measurement (voltage and current)
intuitive operation
variety of optional current clamps
Measure DC component
Measurement, calculation and display of harmonics and interharmonics can be
up to 50 times.
Transient capture
Vector, Trend, Bar Graph and events table display
Active power, reactive power, apparent power and energy, shift power factor and
true power factor
Three-phase unbalance (voltage and current)
Flicker
Inrush current
Detection and record of Dips& Swells, Voltage Rapid Change, Interruption.
Detect according to EN50160 or grid with user-defined limit.
data storage and screenshots (can be replayed or output to a PC)
Through the LAN interface PC can keep real-time remote communication
with the Analyzer, operate the Analyzer and read back measurement data.
Built-in 8G memory card.

SA2100/SA2100E Power Quality Analyzer User’s Guide
Shijiazhuang Suin Instruments Co.,Ltd. -2-
The Analyzer and its accessories
SA2100/SA2100E Power Quality Analyzer 1
Program software for PC (CD) 1
2-meter-long voltage cable (with 4mm caliber banana plug) 5
Crocodile clip 5
Power adapter 1
Power cord 1
Bag 1
Hang strap 1
Options
KLC8C-5A(5A)
CTC0080(50A)
CTC0130(100A)
CTC1535(1000A)
PY-3000A (3000A)
PY-5000A(5000A)

SA2100/ SA2100E Power Quality Analyzer User’s Guide
Shijiazhuang Suin Instruments Co.,Ltd.
-3-
General Safety Information
The Analyzer is designed and produced according to IEC61010-1 strictly, and complies with
CAT III 1000V, CAT IV 600V and pollution degree II. Learn about below safety precautions to
avoid personal injury, and damage to the Analyzer or any other products connected to it.
To avoid electrical shock or fire:
Review the manual before use of the Analyzer and its accessories.
Read all instructions carefully.
Avoid working alone.
Do not operate the Analyzer around explosive gas, vapor or moist environment.
Use the Analyzer as specified, or the protection provided by the Analyzer might be
impaired.
Use only insulated current probes, test leads and adaptors as supplied with the
Analyzer, or indicated as suitable for the Analyzer.
Keep your fingers behind the finger guard on the probes.
Before use, inspect the Analyzer, voltage probes, test leads and accessories for
mechanical damage and replace when damaged. Look for cracks or missing plastic.
Pay special attention to the insulation surrounding the connectors.
Verify operation of the Analyzer by measuring known voltage.
Remove all probes, test leads and accessories that are not in use.
Always connect the power adapter first to the AC outlet before connecting it to the
Analyzer.
Do not touch high voltage: voltage>AC RMS 30V, or DC 60V.
Use the ground input only to ground the Analyzer and do not apply any voltage.
Do not apply input voltage above the rating of the Analyzer.
Do not apply voltages in excess of the marked ratings of the voltage probes or
current clamps.
Pay special attention when connecting or removing flexible current probes: power
down the device being tested or put on suitable protection suit.
Do not insert metal objects into connectors.
Use only power adapter provided by the Analyzer.

SA2100/SA2100E Power Quality Analyzer User’s Guide
Shijiazhuang Suin Instruments Co.,Ltd. -4-
Introduction ............................................................................................................................... 1
The Analyzer and its accessories .............................................................................................. 2
Options ........................................................................................................................................ 2
General Safety Information ...................................................................................................... 3
Chapter 1 Getting started ......................................................................................................... 6
1.1 Overview of The Analyzer ................................................................................................. 6
1.2 Charge the Battery and Prepare for Use ............................................................................... 6
1.3 Input Connections ................................................................................................................ 7
1.4 Rapid Overview of Measuring Modes .................................................................................. 7
1.5 Screen and Function Keys ..................................................................................................... 9
Chapter 2 Basic Operations ................................................................................................... 14
2.1 Tilt Stand and Hang Strap ................................................................................................... 14
2.2 Power on/off ...................................................................................................................... 14
2.3 Display Brightness .............................................................................................................. 15
2.4 Update Firmware ................................................................................................................. 15
2.5 Input Connections ................................................................................................................ 15
2.6 Display Information ............................................................................................................. 16
2.7 Set Up the Analyzer ............................................................................................................. 17
2.8 Using Memory and PC ........................................................................................................ 20
Chapter 3 Application examples .......................................................................................... 22
3.1 Scope ................................................................................................................................... 22
3.2 Voltage/Current/Frequency ................................................................................................. 22
3.3 Dips and Swells .................................................................................................................. 23
3.4 Harmonics ........................................................................................................................... 26
3.5 Power and Energy ................................................................................................................ 28
3.6 Flicker (only for SA2100) .................................................................................................. 29
3.7 Unbalance ........................................................................................................................... 30
3.8 Transients (only for SA2100) ............................................................................................. 31
3.9 Inrush currents (only for SA2100) ...................................................................................... 32
3.10 Power Quality Monitoring ................................................................................................ 33
3.11 Logger ............................................................................................................................... 37
Chapter 4 Service and Support .............................................................................................. 39
4.1 Warranty ............................................................................................................................. 39
4.2 Contact us ........................................................................................................................... 39

SA2100/ SA2100E Power Quality Analyzer User’s Guide
Shijiazhuang Suin Instruments Co.,Ltd.
-5-
Chapter 5 Specifications........................................................................................................ 40
5.1 Frequency Measurement ..................................................................................................... 40
5.2 Voltage Input ...................................................................................................................... 40
5.3 Current Input ....................................................................................................................... 40
5.4 Sampling System ............................................................................................................... 40
5.5 Display Mode ..................................................................................................................... 40
5.6 Measuring Modes and Parameters ...................................................................................... 41
5.7 Measurement Range, Resolution, Accuracy ...................................................................... 41
5.8 Wiring Combinations ........................................................................................................ 43
5.9 General Characteristics ...................................................................................................... 44
Note: The contents contained in this document subject to modification without
further warning. This document may contain technical inaccuracies or typographical
errors. Shijiazhuang Suin Instruments Co., Ltd will don’t guarantee for any form of
this document, including but not limited to the implied guarantee of merchantability
and applicability for a specific purpose.
SA2100/SA2100E Power Quality Analyzer User’s Guide
Shijiazhuang Suin Instruments Co.,Ltd. -6-
Chapter 1 Getting started
If this is your first time to use the Analyzer, or there is no time for you to read this manual
carefully, browsing the content of this chapter is a rapid method for you to learn about the
simple and practical functions of the Analyzer. For using more complex functions, please
continue to read chapter 2 “Basic Operations”, and chapter 3 “Application Example” if you
have difficulties during use.
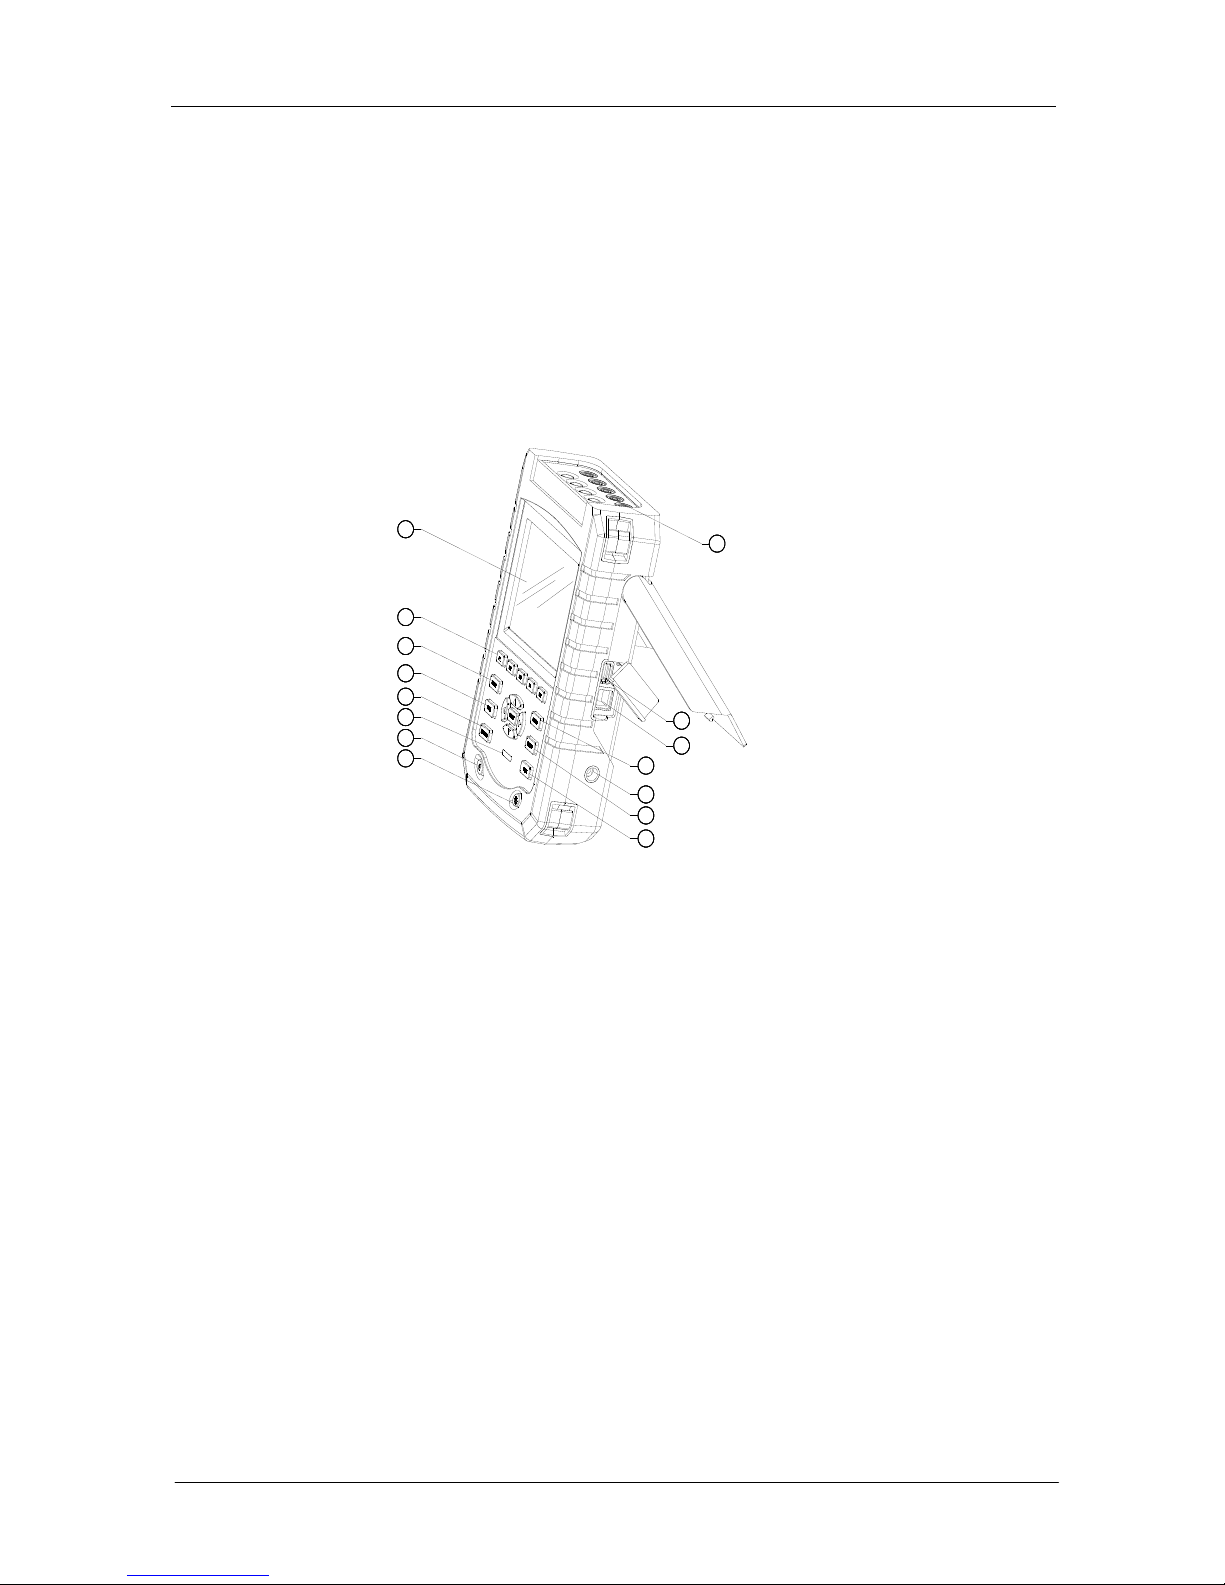
1.1 Overview of The Analyzer
1. Menu keys 2. Scope mode
3. Measurement menus 4. Power Quality Monitoring
5. Power On/Off 6. Display brightness
7. Save 8. Storage information
9. Power adapter 10. Setup
11. LAN 12. USB Host
13. Input 14. Display screen
15. Charging indicator
1.2 Charge the Battery and Prepare for Use
At delivery, the built in chargeable battery may be empty and it is recommend to charge it
before use. A full charge for the first time takes at least 6 hours, it means the battery is fully
charged when the charging indicator change from Flicker to Always. No damage will occur if
the adapter is connected with the Analyzer for long periods. The Analyzer automatically cuts
off charging when the battery is fully charged. Before use, check that the adapter voltage and
11
12
13
14
15
1
2
3
4
5
6
7
8
9
10
SA2100/ SA2100E Power Quality Analyzer User’s Guide
Shijiazhuang Suin Instruments Co.,Ltd.
-7-
frequency range match the local line power range. To prevent decrease of batter capacity,
charge it at least twice a year.
Before measurements, set the Analyzer according to the line voltage, frequency and wiring
configuration of power system you want to measure, read section ”Set the Analyzer” for more
information.
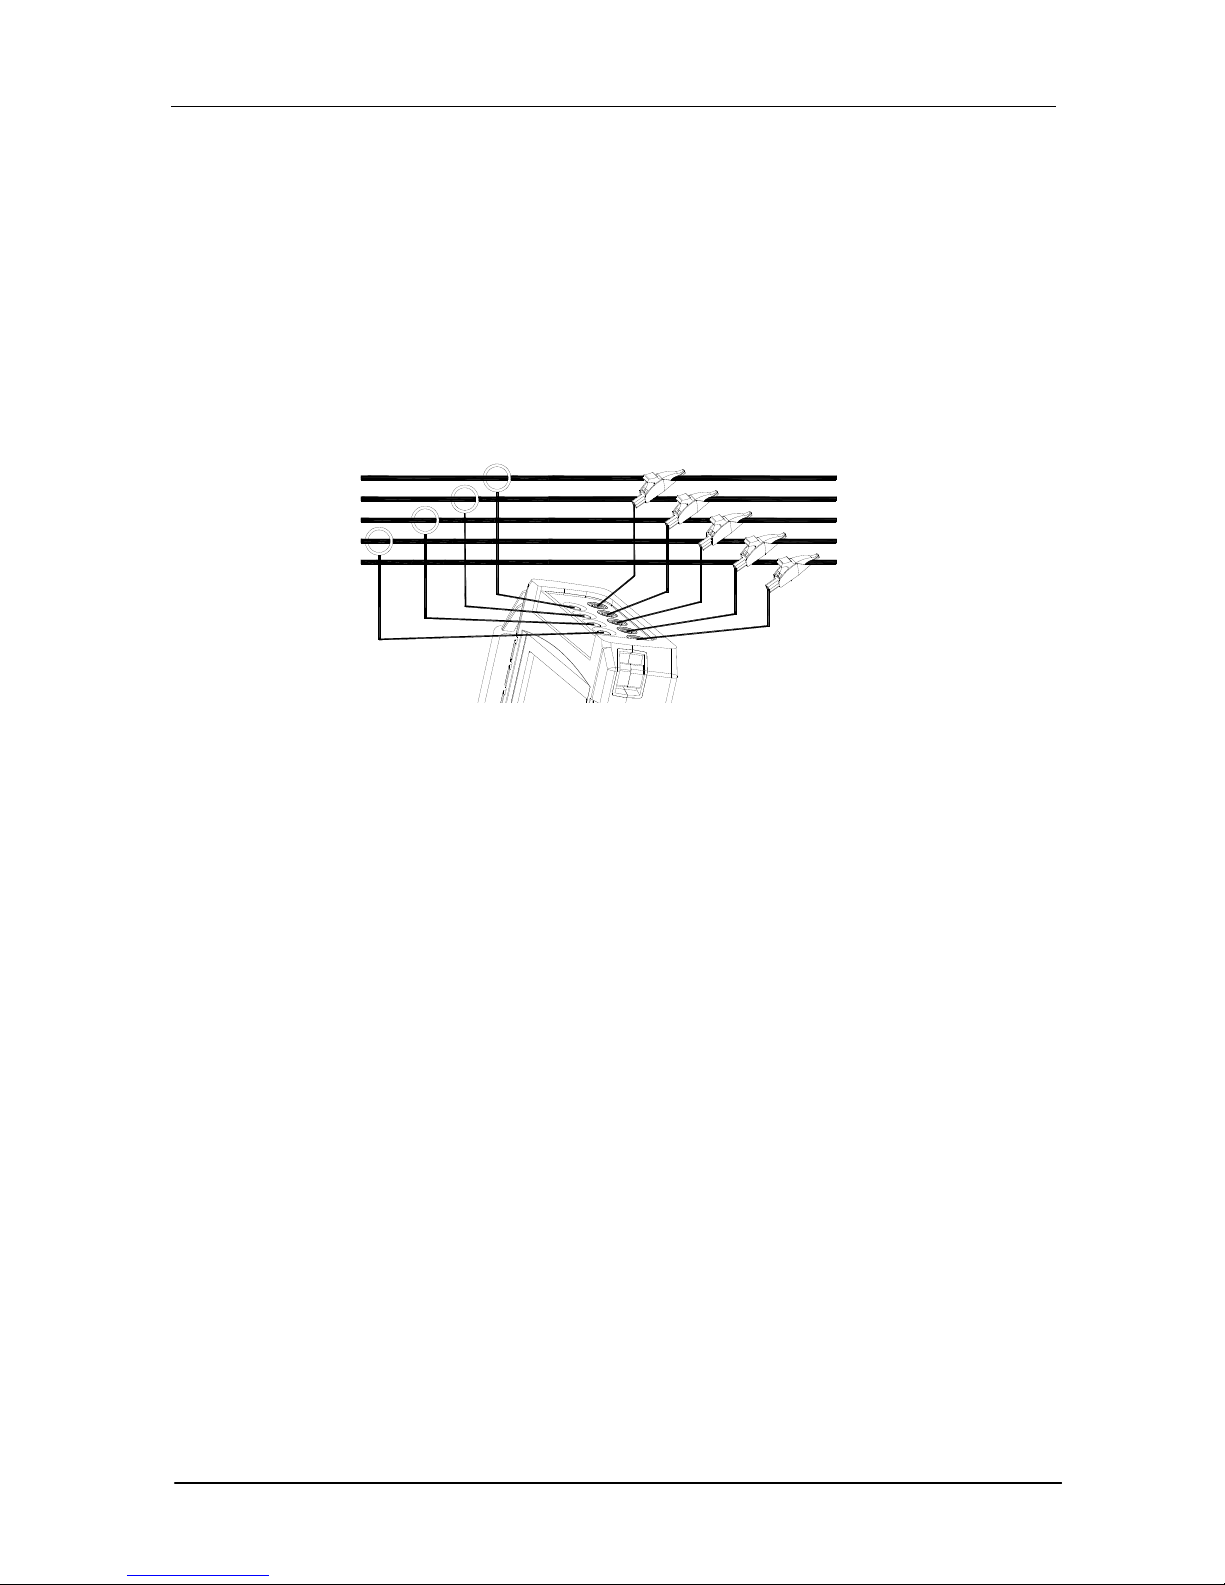
1.3 Input Connections
Fig.1-3-1 Connection of Analyzer to 3-phase distribution system
The Analyzer has 4 BNC-inputs for current clamps and 5 banana-inputs for voltages. For a 3-
phase system, make the connections as shown in Figure 1.
First put the current clamps around the conductors of phase A (L1), B (L2), C (L3) and N
(neutral). The clamps are marked with an arrow indicating the correct signal polarity.
Next make the voltage connections: start with Ground and then succession N, A (L1), B (L2), C
(L3). For correct measuring results, always connect the Ground input.
For single phase measurements, use voltage input A (L1) or current input A (L1) or voltage
inputs Ground.
1.4 Rapid Overview of Measuring Modes
This section provides an overview of all measuring modes. The screen information and the use
of function keys of the Analyzer will be explained in detail in the following sections.
SCOPE mode
Scope mode shows voltage/current by means of waveforms and numerical values, with cursor
and zoom functions.
A
B
C
N
GND

SA2100/SA2100E Power Quality Analyzer User’s Guide
Shijiazhuang Suin Instruments Co.,Ltd. -8-
Measuring mode Screen type Form of measuring results
Scope Waveforms Scope shows waveforms of voltage or current
MENU
Below measurements are available with MENU key:
Measurement mode Screen type Form of measuring results
Voltage/Current/Frequency Table screen
Numerical values: voltage, current, frequency and
waveform factor
Trend Trends of voltage, current, frequency and
waveform factor over time
Dips & Swells Trend Trends of voltage and current rapid update over
time
Events table Record events violate limit
Harmonics Bar graph Voltage, current harmonic, interharmonic, THD,
DC component
Table screen Voltage, current harmonic, interharmonic,THD,
DC component
Power and Energy Table screen Numerical values: active power, reactive power,
apparent power, power factor, shift power factor,
voltage, current, energy usage
Trend Trends of the numerical values in Table screen
over time
Flicker Table screen Numerical values: short time flicker Pst (1
minute), Pst (10 minutes), long time flicker Plt
Trend Trends of the instantaneous flicker sensation level
over time
Unbalance Table screen Numerical values: voltage, current negative
unbalance percentage and zero unbalance
percentage, fundamental voltage, current
component and phase angle
Vector Phase relation and numerical values of voltage
and current

SA2100/ SA2100E Power Quality Analyzer User’s Guide
Shijiazhuang Suin Instruments Co.,Ltd.
-9-
Transient Waveforms Voltage, current waveforms and values Record
events violate limit
Inrush current Trend Record events exceed limit
Logger Table screen Numerical value: all selected readings
MONITOR
Below functions are available:
Measurement mode Screen type Form of measuring results
Monitor Bar graph
Display specifications like voltage, harmonics, flicker,
swells, dips, voltage rapid change, interruption,
unbalance, frequency etc. of power quality parameters
Bar graph Detailed bar graph of harmonics
Trend Trends of selected data set over time
Events table Record events violate limit
1.5 Screen and Function Keys
The Analyzer uses five different screen types to present measuring results in the most effective
way.
Table screen
Fig. 1-5-1 Table screen
This screen gives an instantaneous overview of important numerical measuring values. Such as
Table screen under VOLTS/AMPS/HERTZ mode.
Screen information:
SA2100/SA2100E Power Quality Analyzer User’s Guide
Shijiazhuang Suin Instruments Co.,Ltd. -10-
① The screen header shows current measurement mode.
② Status indicator and status line.
③ Measurement parameters and values. The content depends on the measurement
mode, phase number and wiring configuration.
Function keys:
F1: For 3-phase Y type wiring configuration, switch between phase voltage and line
voltage.
F4: Access to the Trend screen.
F5: Switch between RUN and HOLD.
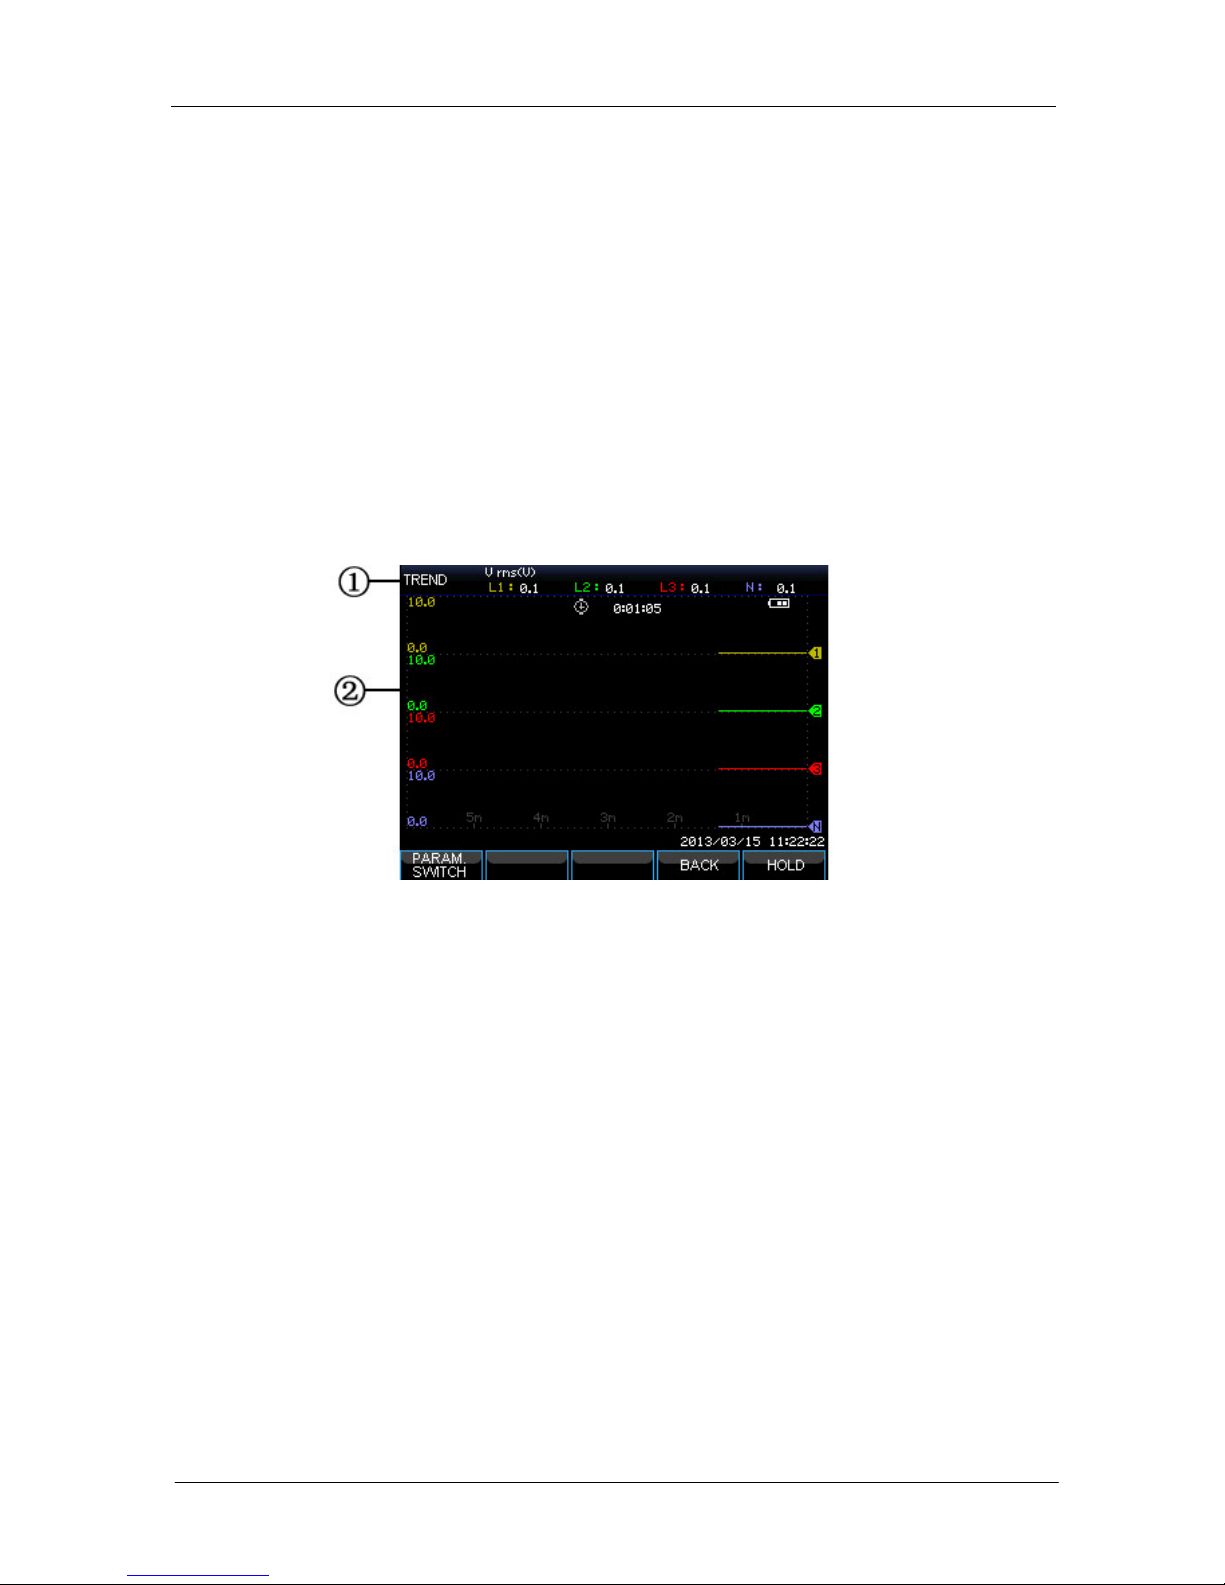
Trend screen
Fig. 1-5-2 Trend screen
Trend shows the course over time of measuring values from the table. Such as dips&swells,
time is horizontally displayed, the Trend is built up gradually from the right of the screen.
Screen information:
① Shows latest value of the Trend. If the Cursor is on, the Trend value at the cursor
is displayed.
② Display area of Trend.
Function keys:
F1: Switch parameters to display
F4: Return to table screen
F5: Switch between RUN and HOLD
Waveform screen

SA2100/ SA2100E Power Quality Analyzer User’s Guide
Shijiazhuang Suin Instruments Co.,Ltd.
-11-
Fig. 1-5-3 Waveform screen
Screen information:
① The screen header shows the RMS value of waveforms.
② Show measured frequency
③ Display area of voltage/current waveforms
Function keys:
F1: Select waveform set to display: V displays all voltages; A displays all currents.
L1, L2, L3 and N display voltage and current of selected phase synchronously.
F3: Access to Cursor
F4: Switch between Cursor and Zoom.
F5: Switch between RUN and HOLD.
Phasor screen
The phase relation between voltages and currents are shown in a vector diagram. Phasor screen
is available under Unbalance mode. Below figure explains this:
Fig. 1-5-4 Phasor screen

SA2100/SA2100E Power Quality Analyzer User’s Guide
Shijiazhuang Suin Instruments Co.,Ltd. -12-
Screen information:
① The screen header shows the Unbalance value.
② Vector diagram, The vector of reference phase A(L1) points to the positive of X
axis
③ Other data. Such as fundamental voltage, phase angle.
Function keys:
F1: Select waveform set to display: V displays all voltages; A displays all currents.
L1, L2, L3 display voltage and current of selected phase synchronously.
F4: Return to table screen
F5: Switch between RUN and HOLD.
Bar graph screen
Bar graph screen contains harmonic bar graph and power quality monitoring bar graph, the bar
height indicates the percentage of represented parameter. Related parameter value will be
shown in the screen header when moving cursor to specified bar.
For instance power quality monitoring bar graph screen contains: Voltage RMS, harmonics,
flicker, rapid voltage change, dips, swells, interruption, unbalance and frequency. The related
bar length will increase if a parameter exceeds its nominal value. .
Below figure explains this:
Fig. 1-5-4 Bar graph screen
Screen information:
① Limits value of bar graph under Cursor. Use left/right arrow keys to move cursor
to another bar graph.
② Power quality monitoring screen, shows parameter time within high and low
tolerance by a bar.

SA2100/ SA2100E Power Quality Analyzer User’s Guide
Shijiazhuang Suin Instruments Co.,Ltd.
-13-
Function keys:
F1: Access to Voltage RMS submenu.
F2: Access to Harmonics submenu.
F3: Access to Flikcer submenu.
F4: Access to Dips&Swells submenu.
F5: Aceess to Unbalance and Frequency submenu.

SA2100/SA2100E Power Quality Analyzer User’s Guide
Shijiazhuang Suin Instruments Co.,Ltd. -14-
Chapter 2 Basic Operations
2.1 Tilt Stand and Hang Strap
The Analyzer has a tilt stand that allows viewing the screen at an angle when placed on a flat
surface. With the tilt stand folded out, the USB Host port and LAN interfaces can be accessed
as shown in the figure.
Fig. 2-1-1 Tilt stand and locations of interfaces
A hang strap shown as below figure is supplied with the Analyzer.
Fig.2-1-2 Fixing the hang strap
2.2 Power on/off
Press the Power key and a single beep can be heard, then the screen shows initial interface.
Press the Power key to cut off the power of the Analyzer under power on state.

SA2100/ SA2100E Power Quality Analyzer User’s Guide
Shijiazhuang Suin Instruments Co.,Ltd.
-15-
2.3 Display Brightness
The Analyzer provides 4 degrees of brightness, which is adjustable by pressing the brightness
adjustment key. Low brightness is suggested to save the battery power when powered by the
battery.
2.4 Update Firmware
If any defective was found during the use of the Analyzer, please contact the customer service
representative to get the update pack.
Place the update pack under the root directory of U disk before making connection to the
Analyzer. Press the Power key, then press F3 to start update, do not operate the Analyzer
during update process, or the Analyzer may be damaged and could not work normally. The
Analyzer will start properly if updated successfully.
If the update was failed, check the reason with the help of the prompt information on the screen.
Cancel the update by powering off the Analyzer if update was failed.
2.5 Input Connections
Check that the Analyzer setup meets the characteristics of the system under test. This concerns:
wiring configuration, nominal frequency, nominal voltage, current clamp ratio and range.
The Analyzer has 4 BNC inputs for current clamps and 5 banana-inputs for voltages. De-
energize power systems before making connections whenever possible, always use proper
personal safety equipment.
For a 3-phase system, make the connections as shown in Fig. 2-5-1.
First put the current clamps around the conductors of phase A (L1), B (L2), C (L3) and N
(neutral). The clamps are marked with an arrow indicating the correct signal polarity.
Next make the voltage connections: start with Ground (GND) and then in succession N, A (L1),
B (L2) and C (L3). For correct measuring results, always connect the Ground (GND) input.
Always double-check the connections.
For single phase measurements, use current input A (L1) and the voltage inputs Ground, N
(neutral) and phase A (L1). The voltage inputs A (L1) is the reference phase for all
measurements.
Before making any measurements, set the Analyzer up for the line voltage, frequency, and
wiring configuration of the power system you want to measure.
Scope Waveform and Phasor display are useful to check if voltage leads and current clamps are
connected correctly. In the vector diagram, the phase voltages and currents A (L1), B (L2) and

SA2100/SA2100E Power Quality Analyzer User’s Guide
Shijiazhuang Suin Instruments Co.,Ltd. -16-
C (L3) should appear in sequence when observing them in clockwise direction as shown in
below figure:
Fig. 2-5-1 Vector diagram for correctly connected Analyzer
2.6 Display Information
The Analyzer uses five different screen types to present measuring results in the most effective
way.
Fig. 2-6-1 Survey of Display types
Phase colors
Measuring results belonging to different phases are presented with individual colors. The
default colors are yellow for phase A (L1), green for phase B (L2), red for C (L3), and gray for
N (neutral).
Screen types

SA2100/ SA2100E Power Quality Analyzer User’s Guide
Shijiazhuang Suin Instruments Co.,Ltd.
-17-
① Table screen: gives an instantaneous overview of important numerical measuring
values.
② Trend screen: this type of screen is related to a table screen. Trend screen shows
the course over time of measuring values from the table.
③ Waveform screen: shows voltage and current waveforms as displayed on an
oscilloscope. Channel A (L1) is reference channel.
④ Phasor screen: shows the phase relation between voltages and currents in a vector
diagram. The vector of reference channel A (L1) points to the positive horizontal
direction.
⑤ Bar Graph screen: shows the density of each measuring parameters as a
percentage by means of a Bar Graph.
Screen information common for all screen types
○
A Measuring mode: the active measuring mode is shown in the screen header.
○
B Measuring values: main numerical measuring values. If cursor is off, the newest
values are shown; otherwise, the values at the cursor are shown.
○
C Status indicators: Display working states of battery or adapter, and time that a
measurement has been going on.
○
D Main area with measuring data.
○
E Status line: shows present date and time.
○
F Softkey text area: softkey functions that can be selected with F1 … F5 are
indicated in white. Functions currently not available are indicated in gray. Active
function key selections are highlighted with a blue background.
2.7 Set Up the Analyzer
At power-on, a welcome screen is displayed that shows settings currently in use. Check if the
Date and Time of the system clock are correct. Also the wiring configuration must match the
configuration of the power system to be checked. The 【SETUP】 key accesses menus to view
and change Analyzer settings.
The settings are grouped in four functional sections which are explained respectively as below:
General settings: wiring configuration, nominal frequency, nominal voltage, current
clamps, current range and language.
User preference: date and time, LAN interface.

SA2100/SA2100E Power Quality Analyzer User’s Guide
Shijiazhuang Suin Instruments Co.,Ltd. -18-
Limits settings: For recall, save and definition of the limits for power quality
monitoring.
Setup interface
Press 【SETUP】 key to access to setup interface, use up/down arrow keys to select options to
be adjusted, then press left/right arrow keys to adjust. Settable options:
Wiring configuration: after selecting wiring configuration, press 【ENTER】
key to access to wiring configuration interface. Press【F4】to confirm selection.
Nominal frequency: adjust nominal frequency, after selecting nominal frequency,
switch between preset 50Hz, 60Hz and 400Hz with left/right arrow keys.
(Measurement 400Hz function is only for SA2100)
Nominal voltage: adjust nominal voltage, after selecting nominal voltage, press
【ENTER】key to access to voltage configuration interface and press 【F5】
key to confirm your selected nominal voltage.
Language: select language then press left/right arrow keys to switch between
Chinese and English.
Zooming: select the zooming setup and press 【ENTER】key to access to set
up interface. Current clamp type and zoom of voltage/current are selectable.
Press 【F5】to confirm the setting.
Available function keys:
F2 User preference: access to user preference interface, configure data, time, LAN
interface etc.
F3 Calibration: access to calibration interface, calibrate the Analyzer.
F4 Monitor limits: configure limits value parameters for power quality monitoring.
F5 Confirm, access to menu interface.
User preference
User preference allows you to customize time and LAN interface, press 【F4】 to access
selected parameter preference menu, and 【F5】 to return to SETUP entry menu.
Date and time: chose Date and time, then press 【F4】to select and access the time
setting interface, use the up/down arrow keys to chose parameters, and the left/right
SA2100/ SA2100E Power Quality Analyzer User’s Guide
Shijiazhuang Suin Instruments Co.,Ltd.
-19-
arrow keys to set up each parameter, press 【F5】 to confirm the selection and make
the setting active.
LAN interface configuration: Press up/down arrow keys to select LAN SETUP, then
press 【F4】 to access to setting interface of LAN interface, 【F1】 Tab keys to
switch configuration parameters. When DHCP or fixed IP is highlighted, press
【ENTER】 key radio button to select this option. Access to IP address with 【F1】
Tab key, then press up/down keys to change figure, and left/right keys to move the
cursor. Make the change active by pressing 【F4】confirmation key, press 【F5】to
cancel the change and return to previous menu.
Calibration interface
Press 【F3】 to access calibration interface which shows current firmware version, correct
password is requested for processing calibration, do not calibrate the Analyzer arbitrarily but
have it calibrated by specified institution or the manufacturer. Press 【F5】to return to setting
interface.
Monitor limits
The Analyzer presets a set of limits according to EN50160 standard, and reserves two user-
defined options, which the users can modify under EN50160 standard set of limits and save as
user-defined set of limits.
Use the up/down arrow keys to move the highlighted row, then press 【ENTER】 key radio
button to select highlighted row. Selected by the radio button means this set of limits is
currently active.
Press 【F4】to access to limits edition interface and edit current highlighted set of limits, a
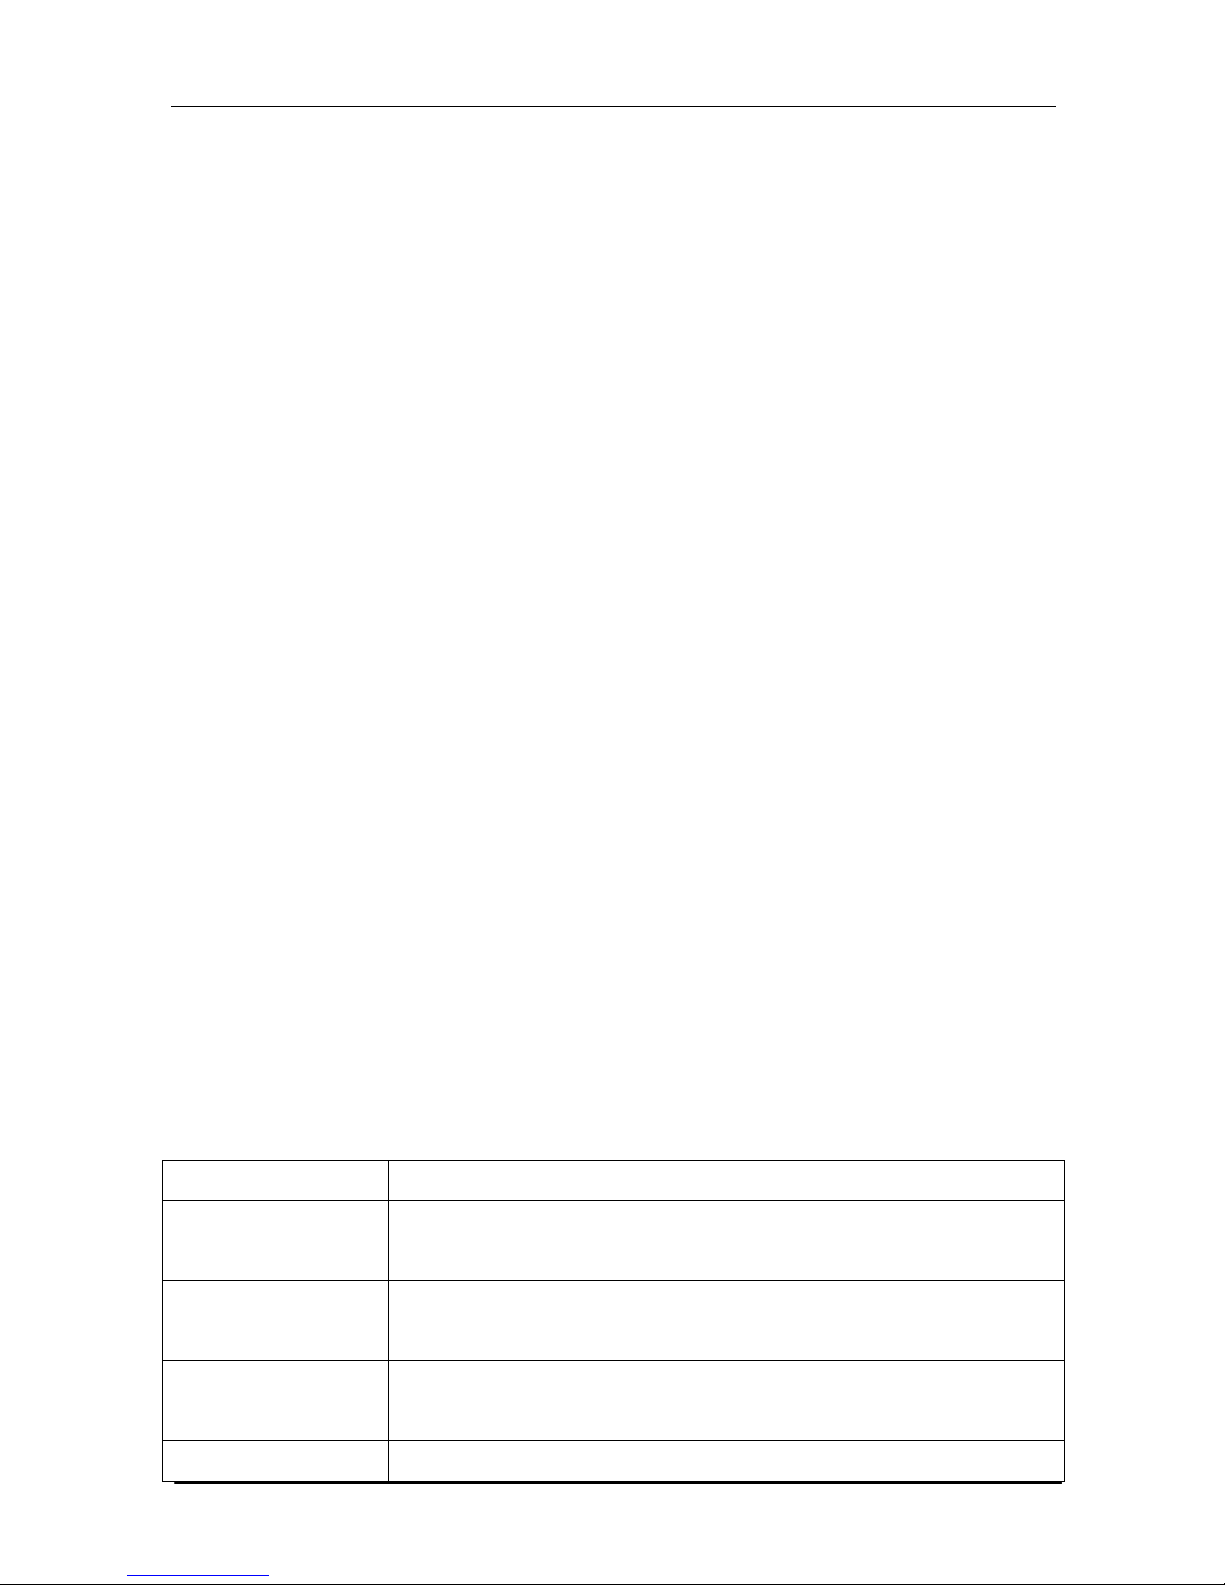
survey of monitor limits adjustments:
Limits Adjustments
Voltage 2 probability percentages (100% and adjustable): each with adjustable
upper and lower limits.
Harmonics For 2-25 harmonics and THD 2 probability percentages (100% and
adjustable): each with adjustable upper limit.
Flicker (*) Weighing curve (lamp type). 2 probability percentages (100% and
adjustable): adjustable percentage with adjustable upper limit.
Dips (*) Threshold, hysteresis, allowed number of week.
This manual suits for next models
1
Table of contents
Other Suin Measuring Instrument manuals

Popular Measuring Instrument manuals by other brands

SevenStar
SevenStar D08-8C instruction manual

Circutor
Circutor CEM-C12 instruction manual

PCB Piezotronics
PCB Piezotronics IMI SENSORS TO604B91 Installation and operating manual

HAZ-DUST
HAZ-DUST HD-1100 instructions

Rigol
Rigol RSA5000 Series Performance Verification Guide

Endress+Hauser
Endress+Hauser QG2000 Technical information and operating instructions


