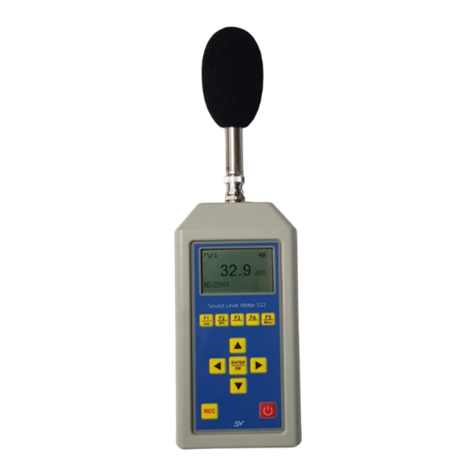
SV SLA-PA201 User manual

Smart Sound/Vibration Analyzer
(Real-Time Based Measurement System)
Manual
First Edition(Ver. 1.7)
SV Corp.

2
This document is on revising. We will upload the revised document to FTP Server(Refer next page)
at every revising. Of course, you can download a upgraded program(Smart Sound/Vibration
Analyzer.)
Copyright © by SV Corporation.
http://www.svdigital.com, http://www.svemall.com
ftp://realwave:[email protected]
RM302, SangShin BD, 719-1, Yi-Dong, SangRok-Gu,
AnSan-City, KyongGi-Do, 426-857
South Korea
Tel. +82-31-501-4030
Fax. +82-31-501-4032

3
Contents
I. Composition of Smart Sound/VibrationAnalyzer...............................................................................5
II. Installation & Operation Procedure ...................................................................................................6
1. S/W Installation............................................................................................................................6
2. H/W Installation....................................................오류! 책갈피가 정의되어 있지 않습니다.
3. Run and Registration....................................................................................................................7
4. Firmware Upgrade .......................................................................................................................8
III. Basic Functions of Program ...........................................................................................................10
1. Icons...........................................................................................................................................10
2. Control of Wave File..................................................................................................................12
3. Open & save configuration. .......................................................................................................14
4. Data Export................................................................................................................................14
5. Transducer type and Calibration ................................................................................................16
6. Recording Options .....................................................................................................................18
7. Recording Information...............................................................................................................19
IV. Real Time Measurement in Vibration Level Meter/Sound Level Meter.........................................21
1. Basic Theory of Vibration Level Meter / Sound Level Meter....................................................21
2. Setting of measuring option.......................................................................................................26
3. Display Option...........................................................................................................................32
4. Measurement and Storage..........................................................................................................33
5. Playback and Analysis ...............................................................................................................34
6. Input of Measurement Information............................................................................................35
7. Octave Analysis in Vibration Level Meter.................................................................................35
8. Setting options for Human Vibration Measurement ..................................................................36
V. Real Time FFT SpectrumxSpectrogram and Octave Analysis..........................................................39
1. Understanding of Frequency Analysis .......................................................................................39
2. Fast Fourier Transform...............................................................................................................39
3. FFT Based OctaveAnalysis.......................................................................................................45
4. Weighting...................................................................................................................................46
5. Integration in Frequency Domain ..............................................................................................48
6. Setting the Options of Measurement..........................................................................................49
7. Setting the option of display ......................................................................................................50
8. Record and Playback..................................................................................................................51
9. Mode Conversion of FFTAnalysis, Spectrogram and Octave Analysis....................................51
VI. FFT Based RPM Meter ..................................................................................................................52
1. Understanding about the RPM Measurement............................................................................52
2. Frequency Analysis....................................................................................................................52

4
3. Measuring with RPM Meter ......................................................................................................53
VII. The way to use RealWave Desk for PC ........................................................................................55
1. Create a Project / Open ..................................................................................................55
2. Adding a file / Delete.............................................................................................................56
3. Control of Graph........................................................................................................................57
4. The Control of Property list .......................................................................................................57
5. Control of Sound........................................................................................................................58
6. List of Result Report ............................................................................................................58
VIII. Installation of ActiveSync and Communication with PDA.........................................................60
1. What is MicrosoftActiveSync? .................................................................................................60
2. Installation of ActiveSync..........................................................................................................60
IX. The Usage of PDA.....................................................오류! 책갈피가 정의되어 있지 않습니다.
1. Start and End of the System..................................오류! 책갈피가 정의되어 있지 않습니다.
2. Start and End of Program......................................오류! 책갈피가 정의되어 있지 않습니다.
3. Conversion of Application Program......................오류! 책갈피가 정의되어 있지 않습니다.
4. Power Setting of PDA...........................................오류! 책갈피가 정의되어 있지 않습니다.
5. memory .................................................................오류! 책갈피가 정의되어 있지 않습니다.
6. Backlight...............................................................오류! 책갈피가 정의되어 있지 않습니다.
7. Deleting Programs.................................................오류! 책갈피가 정의되어 있지 않습니다.
[Appendix 1].........................................................................................................................................64
The Theory for calculating RMS by ISO2631 and ISO8041 ...............................................................64
[Appendix 2].........................................................................................................................................67
Frequency Response of Filter in the Vibration Level Meter.................................................................67
1. 1Hz Highpass Filter ...................................................................................................................68
2. 5Hz Highpass Filter ...................................................................................................................69
3. 10Hz Highpass Filter .................................................................................................................70
4. 2Hz~300Hz Bandpass Filter......................................................................................................71
5. 2Hz~1kHz Bandpass Filter........................................................................................................72
6. 10Hz~500Hz Bandpass Filter ....................................................................................................73
7. 10Hz~1kHz Bandpass Filter......................................................................................................74
[Appendix 3].........................................................................................................................................75
Theory of WBCombined Filter and Frequency Response....................................................................75
1. Theory........................................................................................................................................76
2. Frequency Response and weight factor of Weighting Filter as acceleration input ....................83
3. Frequency Response and weight factor of Weighting Filter as velocity input...........................86

5
I. Composition of Smart Sound/Vibration Analyzer
- AC Adapter: 1set
- USB Interface Cable: 1 ea
- Smart Sound/Vibration Analyzer: 1 ea
- S/W CD(RealWave S/W, Firmware Update S/W, RealWave Desk S/W) : 1ea
- Manual: 1 ea
- Portable Aluminum Hardcase : 1 ea
[Fig. I-1] System Diagram

6
II. Installation & Operation Procedure
1. S/W Installation
Before installing of the RealWave program on PDA, you must install ActiveSync on your PC.
Please refer to the chapter VIII to install ActiveSync. After installation of ActiveSync, connect PC
with PDA via USB cable and Insert the CD. Run the RealWave.exe file from the RealWave folder of
the CD-Rom drive. When the window appears like [Fig. II-1-1] and click ‘Next’, it can be proceed to
[Fig. II-1-2] and [Fig. II-1-3]. And then click ‘OK’to finish installation [Fig. II-1-3].
Realwave.ARM.CAB files use when installing a program from PDA directly.
[Fig. II-1-1] Installation window 1
[Fig. II-1-2] Installation window 2
[Fig. II-1-3] Installation window 3
[Fig. II-1-4] Run of RealWave program 1
[Fig. II-1-5] Execute RealWave program 2

7
To run Launch RealWave program, click the tap [Start >> Programs], and then click ‘RealWave”
icon on the window of [Fig. II-1-5].
2. Run and Registration
2. 1 Unregistered PDA
If running RealWave program at unregistered PDA, please enter given license number on the
register window when appears a window like [Fig. II-2-1,2]. The license number is limited at only
one PDA. Once registered, RealWave program doesn’t work properly if the license number is
different. Please contact us when you have a problem with the license number.
[Fig. II-2-1] Registration window
[Fig. II-2-2] Entering license number
2. 2 Pre-registered PDA
If you have PDA included package, program will start without register procedure like [Fig. II-2-1].
In case of no H/W or failure to recognize, icons in the red box are not activated like [Fig. II-2-3]. But
in case of the opposite, icons are activated and ready to measure like [Fig. II-2-4].
[Fig. II-2-3] Failure to recognize H/W
[Fig. II-2-4] Properly recognized H/W

8
3. Firmware Upgrade
3. 1 Check firmware version
If you select [About RealWave] menu in [File], dialog window appears in [Fig. II-3-2]. You can
check the information of hardware including firmware version.
[Fig. II-3-1] Select [About RealWave…]
menu
[Fig. II-3-2] Check firmware version
3. 2 Firmware Upgrade
Smart Sound/Vibration Analyzer H/W has firmware inside, so the firmware has to be upgraded
when the new version is released. First, ‘FirmUp1.0_ENG.exe’ file in the RealWave software CD has
to be copied at a proper folder in PDA. Here is the way to copy it:
1) Copy the ‘FirmUp1.0_ENG.exe’ in the RealWave software CD.
2) Connect PDA with PC using a USB cable.
3) After ActiveSync connected, double click the ‘Mobile Devices’folder on the windows explorer.
Several folder in PDA will be found.
4) Paste ‘FirmUp1.0_ENG.exe’ to the proper PDA folder.
[Fig. II-3-3] ~[Fig. II-3-4] shows a copy of ‘FirmUp1.0_ENG.exe’ file.
[Fig. II-3-3] Copy and Paste in the Window Explore
[Fig. II-3-4] Run ‘FirmUp.exe’
file on PDA

9
When running ‘FirmUp1.0_ENG.exe’ file on PDA, the program runs like [Fig. II-3-5]. Press
[Open] button on the window of [Fig. II-3-6]. Select folder and file (*.bin) to update and press [Open]
button on the window of [Fig. II-3-7].
[Fig. II-3-5] FirmUp window
[Fig. II-3-6] Open a file to update
[Fig. II-3-7] Completion to open a file to update
At [Fig. II-3-7], press [Start] button to start update. You must insert front-end H/W before update. It
is highly recommended to use AC adaptor or USB cable, but not to use PDA while updating. It is very
harmful that H/W is removed from CF card slot or shut down compulsorily while updating. If it
causes, you can’t to update it and the hardware has to be repaired.
You must turn off PDA after finishing upgrade(Or remove hardware from PDA and then insert
hardware again).
Attention before updating firmware!
1. Use of AC adaptor or USB cable is highly recommended.
It is very harmful to use PDA while updating.
If the firmware upgrade is failed, the hardware can’t be used anymore and must
be repaired.
Attention after updating firmware!
1. Turn off the power of PDA, and then Turn on.

10
III. Basic Functions of Program
1. Icons
1. 1 Vibration Level Meter
Icon for vibration level meter mode [Fig. III-1-1]. and icons are activated.
Icon to set measurement option of vibration level meter mode[Fig. III-1-2]
Icon to control the result display[Fig. III-1-3]
Icon to hear sounds in real-time
Icon to display data only (without saving) in real-time and be called ‘ARM button’
Icon to measure and record wave file in real-time.
To accomplish sound hearing function, press and icons so that you can hear sounds in real-
time
[Fig. III-1-1]
Vibration Level Meter
[Fig. III-1-2]
Vibration Options
[Fig. III-1-3]
Display Options
1. 2 Sound Level Meter
Upon clicking [File>> Transducer Calibration…] tap, [Fig. III-1-4] will appear, and if you choose
Microphone in Type option then you can use sound level meter.
Function of buttens are similar to Vibration Level Meter, icon will appears measurement option
of sound level meter ([Fig. III-1-6]).

11
[Fig. III-1-4] Setting the Sound
Level Meter Mode
[Fig. III-1-5] Sound Level
Meter
[Fig. III-1-6] Sound Options
1. 3 FFTAnalyzer
Icon for FFT Analyzer. If pressing the icon, graph control icon , option setting icon and
sound hearing mode icon are activated. Likewise, you can also hear the sounds of accelerometer
and microphone with and icons.
[Fig. III-1-7] FFTAnalyzer
[Fig. III-1-8]Spectrogram
[Fig. III-1-9] Octave Analyzer
1. 4 Spectrogram
Icon for spectrogram. The activated icons are identical with FFT Analyzer.
1. 5 Octave Analyzer
Icon for FFT Based Octave Analysis. The activated icons are identical with FFTAnalyzer.
1. 6 FFT Based RPM Meter
Icon to measure RPM. Graph control icon and measurement option control icon are
activated only. And Arm button is only activated because it doesn’t support data store function.

12
[Fig. III-1-10] RPM Meter
1. 7 Entering record information
Icon to enter record information. Record information window appears like [Fig. III-1-13].
[Fig. III-1-11] Record information window
1. 8 Measurement and Playback
: ARM mode – Icon to display data only in real-time without data store.
: Record mode – Icon to store wave file and data in real-time.
: Stop mode– Icon to stop arm, record and playback.
: Playback mode – Icon to analyze data playing wave file. The measured data with this function
is the same as the one of record mode.
2. Control of Wave File
2. 1 Open a file
When clicking [File] menu on lower left side of the screen, wave file can be controlled with [Open],
[Save As…] and [Delete] tap at [Fig. III-2-1]. To open file, click [Open] tap and choose a folder and a
file on the window as you wish at [Fig. III-2-2].
click

13
[Fig. III-2-1] Open a wave file
[Fig. III-2-2] Opening window of wave file
2. 2 Save As…
After opening a file, file name can be checked by clicking icon to convert window like [Fig.
III-2-3]. Upon clicking [File>>Save As…] tap, one of the window from[Fig. III-2-4] to [Fig. III-2-6]
will appear, so you can define a folder and file name at the window. [Fig. III-2-7] shows how to enter
a file name.
[Fig. III-2-3] Confirmation of a file name
[Fig. III-2-4] Selection of a folder to save as
another name
[Fig. III-2-5] Selection of a
folder and file to save as
another name
[Fig. III-2-6] Selection of a file
to save as another name
[Fig. III-2-7] Entering a file
name

14
2. 3 Deleting currently opened file
[File>>Delete] is showed [Fig. III-2-8] and you can erase .wav file which are selected currently or
erase all files which include export files. It will not be activated if there’s no opened file. (When
selecting [File>>Delete] tap, currently opened files are deleted.)
[Fig. III-2-8] Deleting currently opened file
3. Open & save configuration.
[File>>Configuration Save As…] is to save all of currently configured options (measurement and
graphic display option) of the program. [File>>Configuration Open…] is to open and change to the
saved configuration. Extension of the saved file is *.CFG.
The functions of ‘Open’and ‘Save As…’ is similar to that of chapter 2 “Control of Wave File”.
[Fig. III-3-1] Entering a configuration file name.
4. Data Export
4. 1 Vibration Level Meter Mode
Each different data is exported according to the display option. When displaying only vibration
value like [Fig. III-4-1], it doesn’t support to export data. On the other hand, when displaying
vibration value and trace like [Fig. III-4-2], it supports to save the changed values and export as an
image file.
Entering file name

15
[Fig. III-4-1] Vibration value display
[Fig. III-4-2] Vibration value and Trace display
To export data, click [File>>Export] tap, and then the window [Fig. III-4-3] is opened. Check the
data or image file which wants to export, select file type and click ‘Export’ button. At last, just close
window by clicking [Ok] button.
The supported data file type : Text, Excel, MATLAB
The supported image file type : BMP, JPEG
[Fig. III-4-4] shows exported file and filename is similar to wave file’s name. For example,
exported octave image file is named as [wave file name_OCT.bmp].
If you should select [Automatic Export], dialog box shown in [Fig. III-4-6] would appear after every
measurement. Pressing [Export] button have data be exported automatically as option.
[Fig. III-4-3] Export window [Fig. III-4-4] Exported octave image file

16
[Fig. III-4-5] Exported octave data file (TEXT)
[Fig. III-4-6] Automatic Export After
measurement
4. 2 Sound Level Meter, FFT, Spectrogram, Octave Mode
Sound Level Meter, FFT and Octave analysis mode support both data and graph image export. But
spectrogram mode supports graph image export only. In the exported data, the frequency and
corresponding values are arranged vertically.
5. Transducer type and Calibration
5. 1 Selection of transducer type and entering sensitivity
By clicking [File>>Transducer Calibration…] tap, [Fig. III-5-1] window is opened.
[Fig. III-5-1] Selecting
transducer
[Fig. III-5-2] Entering
sensitivity
[Fig. III-5-3] Gain adjustment
ICP(IEPE) type microphone and accelerometer is supported and input sensitivity data as shown on
[Fig. III-5-2].
5. 2 AutoRange and Gain adjustment
This system supports digital gain adjustment by 1, 2, 4, 8, 16, 32 and 64 times. It is preferable to

17
adjust gain if the signal is low. To use AutoRange function is more desirable than hand-operated
adjustment.
[AutoRange] calculates input signal and automatically adjusts gain. So it would be better to
accomplish AutoRange before calibration. [Fig. III-5-3] shows AutoRange process.
HighTech
1
RealWave H/W has an analog gain with 10 times, but digital gain is used at gain
adjustment. Analog amplifier accomplishes the role of Pre-Amplifier. Work of the
analog amplifier depends on the cable connected to the sensor.
Digital gain usually uses the method that multiplies an original signal by any gain,
but it also amplifies noise with signal. So this system doesn’t use the method.
This system uses the 24bits for ADC(Analog to Digital Convert) and 16bits data
is extracted from 24bits data. Therefore, the Digital Gain means to extract data
shifting bit position as figure below when extracting 16bits data from 24bits data.
Unlike conventional method using fixed magnification, It is very effective to
amplify signal without the amplification of noise.
5. 3 Calibration
After selecting type of transducer and entering sensitivity and adjust gain, click [Calibrate] button.
A graph window will appear like [Fig. III-5-5]. It is only the status to display data in real-time without
measurement. By clicking [Start] button, it is calibrated during 10 seconds. After calibration, [Fig. III-
5-6] will appear and the result is calculated by compensated gain.
Generally, calibrated sensitivity can be calculated as follows:
Compensated Sensitivity = Compensated Gain ×Inputted Sensitivity <Eq. III-5-1>
If it is calibrated inadequately, you can return to the pre-calibrate status by clicking [1.0] button. In
case calibrated gain value is smaller than 0.5 or exceeds 1.5, an alarm message will be pop up and the
transducer cable or the power of calibrator need to be checked.

18
[Fig. III-5-4] AutoRange
[Fig. III-5-5] Calibration
window
[Fig. III-5-6] Completion of
calibration
6. Recording Options
When selecting [File>>Recording Options…] tap, a recording option window will appear like [Fig.
III-6-1]. [Save Wave File In VLM / SLM] option is for if saving wave file in vibration level meter /
sound level meter mode or not. By checking the option, vibration values / sound values and wave
files are stored simultaneously. If it is not checked, actual wave data will not exist although file name
will remain.
[Fig. III-6-1] Recording options window
[Fig. III-6-2] Memory information window
[Fig. III-6-3] shows the difference between checking [Save Wave File In VLM] option and no
checking the option on the vibration level meter mode. The size of ‘SV001.wav’ is only 44Bytes at
[Fig. III-6-3]. It means there’s no actual recorded data. On the contrary, ‘SV002.wav’ has 640kBytes.
It means that there’s actual data.

19
[Fig. III-6-3] Saving wave file on vibration level meter mode
- [Use Timer] option is to define time duration. Measurement is accomplished during the defined
duration and stop automatically. For example, if the timer is set 10 sec., it will measure only for 10
seconds.
- [File Name] option is to define file name. Once measurement is accomplished, each recording
session automatically generates numeric name after the given file name. For example, let us consider
a series of measurements with the name “SV”, numeric name automatically generated as
“SV001.wav”, “SV002.wav”, etc.
- [Select Folder] option is to select folder to save files.
- [Memory Info…] button shows memory information like [Fig. III-6-2].
To prevent losing data in case of battery discharge, it is recommended to set
saving folder to the ‘SD Card’.
7. Recording Information
Recording Information window is for entering the recording information (Name, object or axis of
measurement etc.).
- [Name] : Operator
- [Object] : Object of measurement
- [Location] : Location of measurement
- [Direction] : Measurement directions of accelerometer as x, y, z-axis.
In [Location] option, you should enter the location information where measurement is
accomplished in advance, and then choose pre-defined location by clicking icon. To add new
location information, it is easily added by clicking [add] button after entering new location
information. To delete it, select a list and click [Del] button. Do not use special character \ / : * ? “ < >
for [Location], after the measuring it will use for folder name in desk program,
No real data but only wave file name
exists.
This wave file has the actual data.

20
[Fig. III-7-1] Recording Info.
[Fig. III-7-2] Completion to
enter Rec. Info.
[Fig. III-7-3] Example of pre-
defined location
Do not use special character \ / : * ? “ < > for [Location]
Table of contents
Other SV Measuring Instrument manuals