flowscreen
Operating Instructions
Copyright © Version 1.0 5 / 24
1.1 Function description
The flowscreen analysis system is designed and produced for the monitoring of dosing
processes. Up to two pressure sensors can be attached. The pressure values determined
from the measurement signals are shown on a graphic display.
The start of a measurement can be set either at pressure build-up or after creating a start
signal. The raw data from the attached sensors are defined using the calibration function.
The display can be adapted for the current application in the view for the axes of pressure
and time.
A fault message is indicated via a LED if the determined limits for pressure increase,
pressure gradient during dosing and pressure reduction are exceeded. An error tolerance
number can be set for each attached sensor.
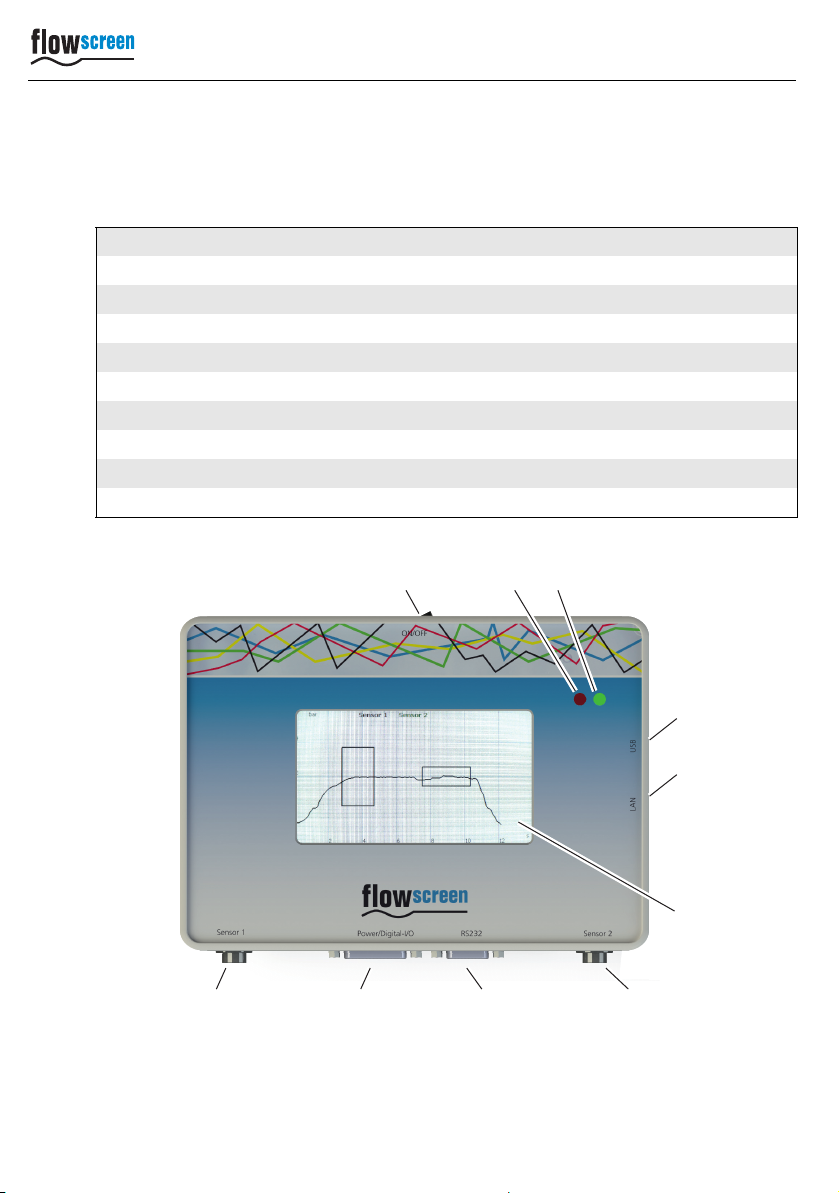
1.2 General information on the menu guide / operation
The flowscreen analysis system is operated via a touch screen using the stylus provided.
The operating menu is largely self-explanatory. System states are depicted via symbols
and plain text.
1.3 Description of software operation
In order to ease legibility, details on using the software interface that are considered too
basic are not described.
If for example, a certain button must be pressed, the generally understandable
information is not mentioned, with the necessary action and logical result described in
brief.
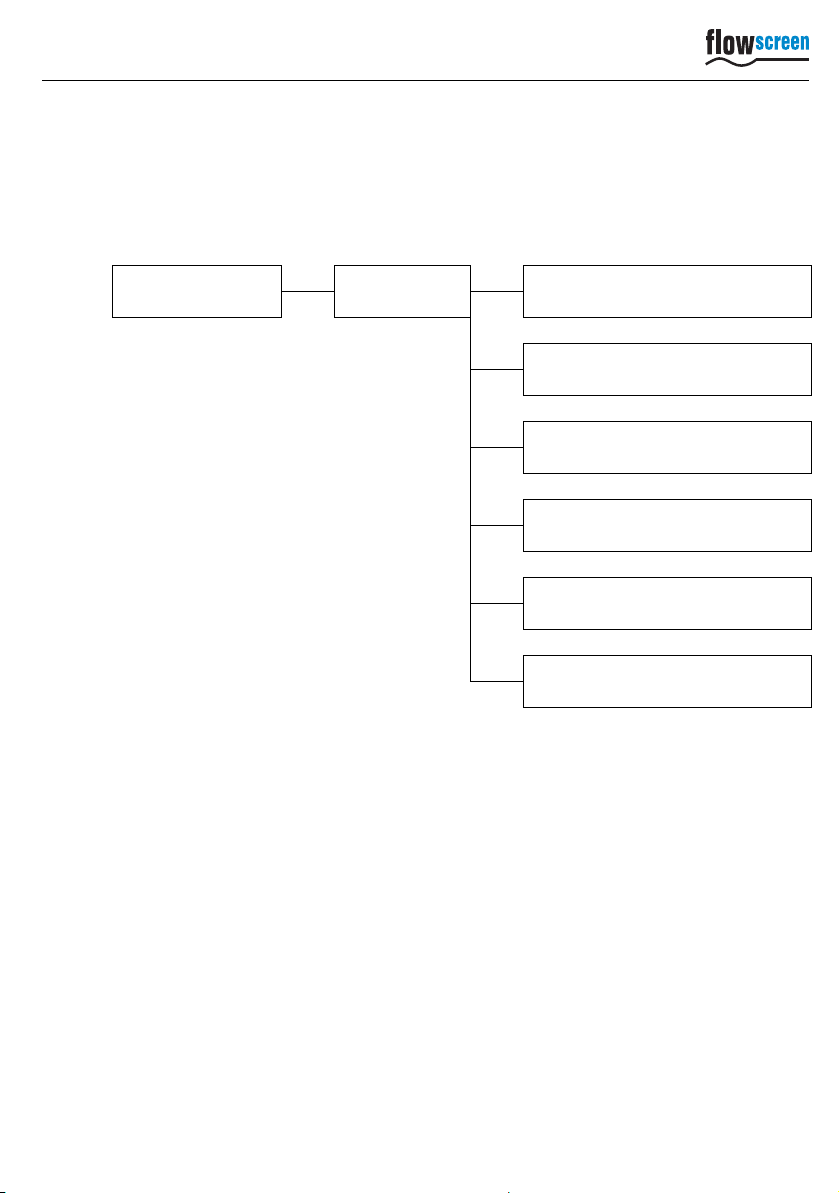
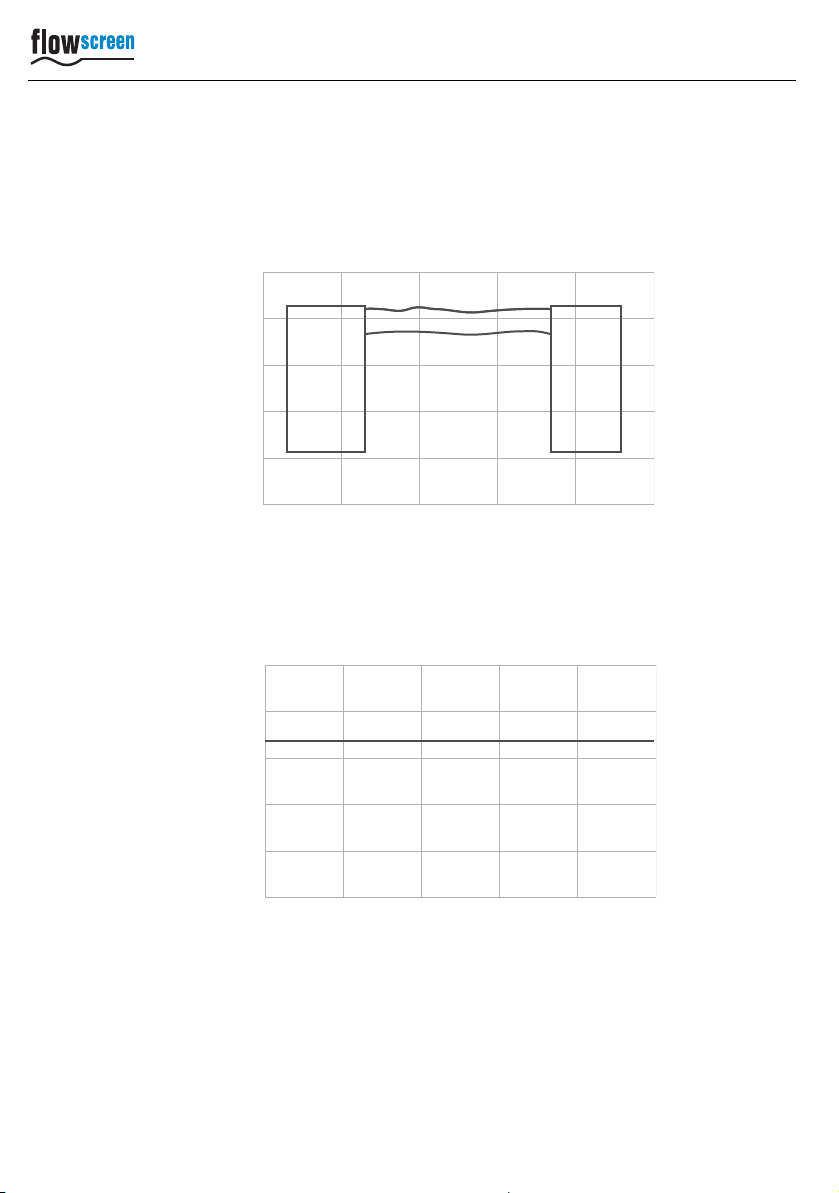
Example
Long form Short form
Click the "Save" button, the XY window is opened. <Save> ►XY opens