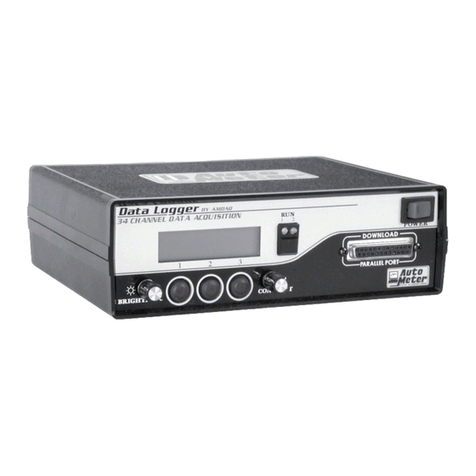
AutoMeter 9305 User manual

Data Logger
Auto Meter Products, Inc.
413 West Elm Street
Sycamore, IL 60178 (815) 895-8141
email: [email protected]
Data Logger
Operating Instructions #2650-796C
®
Model: 9305
CONTENTS
1. INTRODUCTION ....................................................... OP 2
2. DISPLAYING SENSOR DATA - “Disp” . . . . . . . . . . . . . . . . . . . . . . . . . . . . . . . . . . . . . . OP 3
3. REMOTE START SWITCH OPERATION . . . . . . . . . . . . . . . . . . . . . . . . . . . . . . . . . . . . OP 4
4. RECORDINGRUNDATA-“Rec#” ......................................... OP 4
5. COMPUTERDOWNLOAD................................................ OP 4
6. GRAPH PRINT OUT - “GRAPH PLAYBACK” . . . . . . . . . . . . . . . . . . . . . . . . . . . . . . . . . OP 7
7. TEXT PRINT OUT - “TEXT PLAYBACK” - 17 CHANNEL ONLY . . . . . . . . . . . . . . . . . . OP 9
8. CONFIGURINGTHEDATALOGGER....................................... OP12
8A.SYSTEMCONFIGURATION......................................... OP13
8B. MEMORY CONFIGURATION - “MEMORY SETUP” 17 CHANNEL ONLY. . . . . . OP 23
8C. PRINTER CONFIGURATION - “PRINTER TYPE” . . . . . . . . . . . . . . . . . . . . . . . . OP 26
9. CALIBRATINGTHEDATALOGGER ....................................... OP28
9A.PRESSURECALIBRATIONS ........................................ OP28
9B. AUXILIARY CHANNEL CALIBRATIONS. . . . . . . . . . . . . . . . . . . . . . . . . . . . . . . . OP 30
9C. ACCELEROMETER CALIBRATIONS . . . . . . . . . . . . . . . . . . . . . . . . . . . . . . . . . . OP 31
9D. MPH CALCULATIONS - 17 CHANNEL PRINT TO PAPER ONLY. . . . . . . . . . . . OP 32
9E. POSITIONING SENSORS (SHOCK TRAVEL) . . . . . . . . . . . . . . . . . . . . . . . . . . . OP 32
SERIES
17 Channel Operating Instructions

OP 2
1. INTRODUCTION
This manual explains how to operate the Data Logger. We have made the Data Logger as easy to use as possible.
The LCD display on the front of the Data Logger guides you through the functions. It identifies the function on the top line, and
up to three choices on the bottom line. A function/option can be selected by pressing the button directly below the name.
To operate the system, select a function by pressing one of the three buttons, and following the menus to the task of your
choice.
The following pages have diagrams and details to get you started. Don’t worry about accidentally pressing the wrong button
and loosing data or your calibrations. Any configuration or calibration can easily be re-entered, and data has to be manually
removed. If you find yourself lost in an operation, just turn the unit OFF and ON to reset to the main menu (“CHOOSE MODE”).
When an option is explained in this manual, you will only be told to press the buttons relating to the option. If other options are
available on the same screen, they will not be explained. For more details on those options, see the related section.
We hope you enjoy your Data Logger and hope it proves to be an asset to your racing program.
CHOOSE MODE
Disp Rec# Play
1 2 3
Function
Choices Buttons
Display Brief

OP 3
2. DISPLAYING SENSOR DATA - “Disp”
Display (“Disp”) mode is selected from the “CHOOSE MODE” screen and allows you to display active sensor data. Use the three
buttons below the screen to select the data to be viewed. Display enables view of Engine and Driveshaft RPM, Accelerometer,
Pressure, EGT and Aux 1-4 only.
ER XXXX DR XXXX
XX.XXG XX.XXPSI
CHOOSE MODE
Disp Rec# Play
Press the “Disp” button to enter the “Disp” mode and display
sensor data.
Press “Disp”
Button 2
Display Aux. Channels
Button 3
Display EGT’s
The first screen in the “Disp” mode shows Engine RPM, Drive
shaft RPM, Acceleration and Fuel pressure.
• Pressing button 2 will display the Auxiliary channels
information.
• Pressing button 3 will display the EGT’s.
C1 X.XXX 2 X.XXX
3 X.XXX 4 X.XXX
Button 1
Return to prev. screen
Button 3
Display EGT’s
The Auxiliary channels are displayed as shown.
• Press button 1 to return to previous screen.
• Press button 3 to display the EGT’s.
TC5 XXXX 6 XXXX
7 XXXX 8 XXXX
Button 1
Return to first “Disp” screen
Button 2
Return to Auxiliary
channel display
Button 3
Alternate between Aux.
Channels 1-4 and 5-8
The EGT’s are displayed as shown.
• Press button 1 to return to the first screen in the “Disp” mode
with RPM’s, Acceleration and Fuel pressure.
• Press button 2 to return to the Auxiliary channels display.
• Press button 3 to alternate the display between EGT channels
1-4 and 5-8.
NOTE:
To exit the “Disp” mode and return to the “CHOOSE MODE”, press and hold buttons 1 and 2 until the unit resets itself.
Display Brief Details
1 2 3
1 2 3
1 2 3
1 2 3

3. REMOTE START SWITCH OPERATION
The remote switch supplied with the Data Logger is a single throw, momentary switch. Pressing the switch is the same as pressing
the “Rec#” button in the “CHOOSE MODE”. The unit will continue recording until the memory for the run is full or the “STOP” button
is pressed.
4. RECORDING RUN DATA - “Rec#”
The Record (“Rec#”) mode, selected from the “CHOOSE MODE”, allows you to begin recording run data.
CHOOSE MODE
Disp Rec# Play
There are three options to start recording data:
•Press “Rec#”, in the “CHOOSE MODE”.
• Activate the remote start switch
(works like pressing the “Rec#” button).
•Exceeding the configurable preset start engine or drive shaft
RPM value by pressing the “Rec#” button or activate the
remote start switch. If the system is configured for multiple
runs, the number of runs remaining will appear next to Rec.
Pressing and holding the “Rec#” button displays the preset
start engine or drive shaft RPM.
3 options to start recording.
• Press “Rec#” button
• Remote start switch
• Exceeding preset RPM
“EXIT”
Exit to “CHOOSE MODE”
Display Brief Details
1 2 3
ERPM Start XXXX
EXIT
1 2 3
* Optional screen *
This screen will be displayed only if an engine RPM (“START
RPM”) has been configured as the trigger. Data recording will
not begin until the configured RPM value has been exceeded.
Engine RPM will be displayed in place of “XXXX”.
• Press the “EXIT” button to return the “CHOOSE MODE”.
“STOP”
Stops recording
RECORDING DATA
XXX STOP
1 2 3
This screen is displayed during recording. The computer will
continue receiving and recording data until the “STOP” button is
pressed or the allocated memory for that run is full.
“END”
Return to the
“CHOOSE MODE”
Memory used XXXK
END
1 2 3
Once the “Rec#” mode has been stopped, the unit will display
the total amount of memory used.
•Press the “END” button to return to the “CHOOSE MODE”.
OP 4OP 4

The stop point of the print out is selected from this screen.
•The “Up” button increases the stop time.
•The “Down” button decreases the stop time.
•After reaching the correct stop time, press the “ENTER” button to
make your selection.
Windows on Data Facts Software Brief Details
FILE
DOWNLOAD FILE NAME
Select Download Data File
A) Select File Name
B) Select OK
This is an icon that turns into a window when selected.
Enter the name of the file.
The computer is now waiting for information to be sent
from the Data Logger.
1.
2.
Downloading a Run from the Data Logger to the Computer
Start with Data Facts Pro open and running on your computer.
A. Begin File Download at the Computer
See Data Facts Pro Software Instruction Section for further information on starting download.
5. COMPUTER DOWNLOAD
OP5
B. Send File from Data Logger
CHOOSE MODE
Disp Rec# Play
Press the “Play” button to access all download functions.
Press “Play”
Display Brief Details
1 2 3
Choose Function
Setup Cal Play
Press “Play”
1 2 3
This screen selects the start point for the print out. If no run is
recorded the Data Logger returns to the “CHOOSE MODE”.
•Selecting “Yes “ allows the Data Logger to find the point of launch.
Approximately 1 second is subtracted from this point. This enables
1-2 seconds of data to be printed prior to the launch point. While the
unit is calculating the exact launch point “Searching XXX” will be
displayed with an “ABORT” option. “ABORT” will return you to the
main menu.
•Selecting “No” advances to the next screen to allow you to enter the
starting point manually.
Find Launch ?
Yes No
“Yes”
Data Logger finds
point of launch
“No”
Advance to the next screen
and enter selection
1 2 3
Start at Sec. X
Up Down ENTER
The start point of the print out is selected from this screen. If you
chose “YES” on the previous screen, the calculated start point will be
displayed in place of the “X”.
•The “Up” button increases the start time.
•The “Down” button decreases the start time.
•After reaching the correct starting time, press the “ENTER” button
to make your selection. If no time is chosen, data will begin with
0 seconds.
“Up”
Increase time
“Down”
Decrease time
“ENTER”
Make selection
1 2 3
Stop at Sec. X
Up Down ENTER
“Up”
Increase time
“Down”
Decrease time
“ENTER”
Make selection
1 2 3
Press the “Play” button to enter the Play function.Press the “Play” button to enter the Play function.
If the data logger found the launch, add 3-4 seconds to your ET for the
appropriate stop time.
Start at 12.0 seconds
9.0 seconds (ET)
+4.0 seconds (cushion at beginning and end of run)
Stop at 25.0 seconds
To download the entire run enter Stop at NONE.

Windows on Data Facts Software Brief Details
MAIN MENU
FILE
Select File
A) Select Open Data
File 1
B) Select run
C) Select OK
This is an icon that turns into a window when selected.
Find the name of the file you just downloaded.
The Reading Data Records window will appear as the data
from that run is loaded into the software.
The run is now ready to graph.
1.
2.
After the Data Logger is finished sending the data to the computer, Data
Facts Pro will finish the download and return to the main window.
See Data Facts Pro Software Instruction Booklet to graph any or all of the channels from this
To graph the run you just downloaded you will need to open
the file in Data Facts Pro.
Update Auto DL ?
Yes No
Next time a file is downloaded, if the PC is ready to receive the file
and the Download cable is connected to the Data Logger,
pressing Play in the main screen will Download data using the
settings you just entered.
Select “Yes”
Playback type ?
DNLD GRAPH TEXT Press the “DNLD” button to Download the data to the PC.
Press “DNLD”
1 2 31 2 3
1 2 3
Display Brief Details
OP 6OP 6
If there is any break in the path from computer to Data Logger,
the following message will appear: Printer not RDY? OK
Display on Data Logger Brief Details
One Button Download
CHOOSE MODE
Disp Rec# Play
Press the “Play” button to access all download functions.
Press “Play”
1 2 3
Once the Auto Download has been setup by performing a download and saving the settings,
you can quickly download any run using those same settings by following these steps:
1. Make sure Data Logger and PC are connected.
2. Click DOWNLOAD DATA FILE on PC.
3. Enter a file name and click OK.
4. PC is ready to receive data file.
5. If you are using the remote download box, it must be turned on, connected to the data logger,
and switch set in the RECEIVE position.
C. Finish Download to Computer - V1.14 OnlyC. Finish Download to Computer - V1.14 Only

This screen selects the start point for the print out. If no run is
recorded the Data Logger returns to the “CHOOSE MODE”.
•Selecting “Yes “ allows the Data Logger to find the point of launch.
Approximately 1 second is subtracted from this point. This enables
1-2 seconds of data to be printed prior to the launch point. While the
unit is calculating the exact launch point “Searching XXX” will be
displayed with an “ABORT” option. “ABORT” will return you to the
main menu.
•Selecting “No” advances to the next screen to allow you to enter the
starting point manually.
CHOOSE MODE
Disp Rec# Play
Press the “Play” button to access all playback functions.
Press “Play”
Display Brief Details
1 2 3
Choose Function
Setup Cal Play
Press the “Play” button to enter the Play function.
Press “Play”
1 2 3
RUN NUMBER X
Change ENTER
This screen appears only if the unit is configured for multiple runs.
•Press “Change” to scroll through the recorded runs.
•Press “ENTER” to select the run.
If no runs are stored, “No Runs Stored” will be displayed.
“Change”
Scroll through recorded
runs
“ENTER”
Enters your selection
1 2 3
Find Launch ?
Yes No
“Yes”
Data Logger finds
point of launch
“No”
Advance to the next screen
and enter selection
1 2 3
Start at Sec. X
Up Down ENTER
The start point of the print out is selected from this screen. If you
chose “YES” on the previous screen, the calculated start point will be
displayed in place of the “X”.
•The “Up” button increases the start time.
•The “Down” button decreases the start time.
•After reaching the correct starting time, press the “ENTER” button
to make your selection. If no time is chosen, data will print from 0
seconds.
“Up”
Increase time
“Down”
Decrease time
“ENTER”
Make selection
1 2 3
Stop at Sec. X
Up Down ENTER
The stop point of the print out is selected from this screen.
•The “Up” button increases the stop time.
•The “Down” button decreases the stop time.
•After reaching the correct stop time, press the “ENTER” button to
make your selection.
“Up”
Increase time
“Down”
Decrease time
“ENTER”
Make selection
1 2 3
* Optional *
Update Auto DL ?
Yes No
Next time a file is downloaded, if the PC is ready to receive the file
and the Download cable is connected to the Data Logger,
pressing Play in the main screen will Download data using the
settings you just entered.
Select “Yes”
1 2 3
Playback type ?
DNLD GRAPH TEXT Press the “DNLD” button to Download the data to the PC.
Press “DNLD”
1 2 3
OP 7
D. Send file from Data Logger when configured for multiple Runs

This screen selects the start point for the print out. If no run is
recorded the Data Logger returns to the “CHOOSE MODE”.
•Selecting “Yes “ allows the Data Logger to find the point of
launch. Approximately 1 second is subtracted from this point.
This enables 1-2 seconds of data to be printed prior to the
launch point. While the unit is calculating the exact launch
point “Searching XXX” will be displayed with an “ABORT”
option. “ABORT” will return you to the main menu.
•Selecting “No” advances to the next screen to allow you to
enter the starting point manually.
6. GRAPH PRINT OUT - “GRAPH PLAYBACK” - 17 CHANNEL
ONLY
CHOOSE MODE
Disp Rec# Play
Press the “Play” button to access all playback functions.
Press “Play”
Display Brief Details
1 2 3
Choose Function
Setup Cal Play
Press the “Play” button to enter the Play function.
Press “Play”
1 2 3
RUN NUMBER X
Change ENTER
This screen appears only if the unit is configured for multiple
runs.
•Press “Change” to scroll through the recorded runs.
•Press “ENTER” to select the run.
If no runs are stored, “No Runs Stored” will be displayed.
“Change”
Scroll through recorded
runs
“ENTER”
Enters your selection
1 2 3
Find Launch ?
Yes No
“Yes”
Data Logger finds
point of launch
“No”
Advance to the next screen
and enter selection
1 2 3
Start at Sec. X
Up Down ENTER
The start point of the print out is selected from this screen. If
you chose “YES” on the previous screen, the calculated start
point will be displayed in place of the “X”.
•The “Up” button increases the start time.
•The “Down” button decreases the start time.
•After reaching the correct starting time, press the “ENTER”
button to make your selection. If no time is chosen, data will
print from 0 seconds.
“Up”
Increase time
“Down”
Decrease time
“ENTER”
Make selection
1 2 3
Stop at Sec. X
Up Down ENTER
The stop point of the print out is selected from this screen.
•The “Up” button increases the stop time.
•The “Down” button decreases the stop time.
•After reaching the correct stop time, press the “ENTER”
button to make your selection.
“Up”
Increase time
“Down”
Decrease time
“ENTER”
Make selection
1 2 3
* Optional *
OP 8

OP 9
Playback type ?
DNLD GRAPH TEXT
Press the “GRAPH” button to print the data as a graph. Make
sure your printer is on-line (see “Printer Configuration”).
Press “GRAPH”
Display Brief Details
1 2 3
Presentation
A B SEL
•Selecting “A” or “B” chooses a pre-selected set of data curves
(see “Configuring the Data Logger”) and advances to the
“Print Header” screen.
•The “SEL” button allows to individually select the curves to be
printed.
“A” & “B”
Pre-selected data curves
“SEL”
Individually select the
curves
1 2 3
Engine RPM
YES DONE NO
Engine RPM is the first of fourteen data curve print options (The
fourteen options consist of Engine RPM, Shaft RPM, E/S RPM
Ratio, Drive RPM, S/D RPM Ratio, E/D RPM Ratio, Pressure,
Accelerometer, EGT’s, MPH and Channels 1-4).
•Pressing “YES” prints the selected data curve.
•Pressing “DONE” enters the selected data curves and
advances to the “Print Header” screen.
•Pressing “NO” prevents the data curve from being printed.
“YES”
Print data curve
“DONE”
Enter curves and advance
to Print header
“NO”
Cancel data curve print
1 2 3
Print Header ?
YES NO
This option adds time slip information (example: date, time, ET,
60 ft and MPH).
•Pressing the “YES” button will momentarily display “Sending
Header” and advance to the next screen.
•Pressing the “NO” button will cancel the header print.
“YES”
Prints header information
“NO”
Cancel header
1 2 3
Searching Data
EXIT
This screen is displayed while the unit searches the data for the
starting point (selected in the “Start at sec” screen).
•Pressing the “EXIT” button will return you to the
“CHOOSE MODE”.
“EXIT”
Return to the
“CHOOSE MODE”
1 2 3
Sending Scales This screen is displayed while the computer is sending the
graph to the printer.
1 2 3
PRINTING!
XXX STOP XXX
This screen is displayed during printing of the graph.
•Press the “STOP” button to stop sending data to the printer.
The printer will continue to print until the buffer is emptied.
After the unit is done printing, due to “STOP” button or letting
the data run out, it will return to the “CHOOSE MODE”.
“STOP”
Cancel print
1 2 3

OP 10
7. TEXT PRINT OUT - “TEXT PLAYBACK”- 17 CHANNEL ONLY
The Text print out (“TEXT PLAYBACK” mode), prints the data collected during the run as text only.
CHOOSE MODE
Disp Rec# Play
Press the “Play” button to access all playback functions.
Press “Play”
Display Brief Details
1 2 3
Choose Function
Setup Cal Play
Press the “Play” button to enter the Play function.
Press “Play”
1 2 3
RUN NUMBER X
Change ENTER
This screen appears only if the unit is configured for multiple
runs.
•Press the “Change” button to scroll through the recorded runs.
•Press the “ENTER” button when the correct run number
appears to make your selection.
If no runs are stored, “No Runs Stored” will be displayed.
“Change”
Scroll through recorded
runs
“ENTER”
Enters your selection
1 2 3
* Optional *
This screen selects the start point for the download.
•Selecting “YES” allows the Data Logger to find the point of
launch. Approximately 1 second is then subtracted from this
point. This enables 1-2 seconds of data to be downloaded
prior to the launch point. While the unit is calculating the
exact launch point “Searching XXX” will be displayed
with an “ABORT” option. “ABORT” will return you to the
“CHOOSE MODE.”
•Selecting “NO” advances to the next screen to allow you to
enter the starting point manually.
Find Launch ?
Yes No
“YES”
Data Logger finds
the start point
“NO”
Advances to the
next screen
1 2 3

OP 11
Display Brief Details
Start at Sec. X
Up Down ENTER
The start point of the printout is selected from this screen. If
you chose “YES” on the previous screen, the calculated start
point will be displayed in place of the “X”.
•The “Up” button increases the start time.
•The “Down” button decreases the start time.
•After reaching the correct starting time, press the “ENTER”
button to make your selection. If no time is selected, data will
download from 0 seconds.
“Up”
Increase time
“Down”
Decrease time
“ENTER”
Enter your selection
1 2 3
Stop at Sec. X
Up Down ENTER
The stop point of the printout is selected from this screen.
•The “Up” button increases the stop time.
•The “Down” button decreases the stop time.
•After reaching the correct stop time, press the “ENTER”
button to make your selection.
“Up”
Increase time
“Down”
Decrease time
“ENTER”
Enter your selection
1 2 3
Playback type ?
DNLD GRAPH TEXT
Press the “TEXT” button to select the Text mode. Make sure
your printer is on-line.
Press “TEXT”
1 2 3
TEXT TYPE ?
DATA ANALYS
The type of data to be printed is selected from this screen.
• Selecting “DATA” will print the data readings exactly as they
were recorded.
• Selecting “ANALYS” will print a Time vs. Distance curve. You
can adjust the calculated 60, 330, 660, and 1320 foot times
to match the real time data from the time slip. The unit will
automatically adjust the graph for real time data.
“DATA”
Print exactally as recorded
“ANALYS”
Print a
Time vs. Distance curve
1 2 3
TIME INTERVAL ?
.01 (SEC) .1
This screen allows you to print the data in either “.01” or “.1”
second intervals.
• Press the “.01” button to print in .01 second intervals
• Press the “.1” button to print in .1 second intervals
“.01”
Print in .01 sec. intervals
“.1”
Print in .1 sec. intervals
1 2 3
Analyze to:
330 660 1320
If “ANALYS” was selected from the “TEXT TYPE ?”, this screen
will be displayed after the “Time Interval ?” screen. Pressing
button 330, 660 or 1320 tells the unit how far down the track to
print the Time vs. Distance plot.
• Pressing the “330” button prints data up to 330’.
• Pressing the “660” button prints data up to 660’.
• Pressing the “1320” button prints data up to 1320’.
“330”
Print up to 330’
“660”
Print up to 660’
“1320”
Print up to 1320’
1 2 3
Auto Correct ?
YES NO
This screen appears after choosing any of the three
“Analyze to:” options.
• Pressing “NO” uses the preset MPH correction factor (see the
“System Configuration”) to calculate the Time vs. Distance
curve. After the unit calculates the data, the text will print and
the “Printing!” screen will be displayed.
• Pressing “YES” adjusts the 60, 660 and 1320 foot times
(depending on the previously chosen graph length) to match
the real time data from the time slip.
“NO”
Preset MPH correction
“YES”
Match real time
1 2 3
* Optional *

OP 12
Display Brief Details
60ft->_X.XXX
UP <--- Enter
The real time (from time slip) for the 60 foot marker is entered
from this screen. The following three screens (if applicable)
enter the real time for the 330, 660 and 1320 foot markers.
• Pressing the “UP” button increases the underlined digit by
one.
• Pressing the “<---” button moves to the left one digit to
change the digit if an error was made.
• Pressing “ENTER” stores the number and advances to the
next digit. Pressing “ENTER” for the last digit advances the
screen to the next foot marker to be corrected. This process
will continue for all foot markers (60, 330, 660, and 1320), up
to the preselected foot marker from the “ANALYS” mode.
“Up”
Increase underlined digit
“<---”
Move left one digit
“ENTER”
Store digit
1 2 3
THINKING
STOP
This screen will be displayed while the unit is performing the
automatic adjustment to the recorded data. Press “STOP” to
exit to the “CHOOSE MODE”.
“STOP”
Exit to “CHOOSE MODE”
1 2 3
330ft->_X.XXX
UP <--- Enter
660ft->_X.XXX
UP <--- Enter
1320ft->_X.XXX
UP <--- Enter
Print Header ?
YES NO
If “DATA” was selected from the “TEXT TYPE ?” screen, this
will be the next screen displayed after “Time Interval ?”. This
option provides an area for time slip information (example:
date, time, ET, 60 ft and MPH)
• Pressing “YES” will momentarily display “Sending Header”
and advance to the next screen.
• Pressing “NO” will not print a header.
“YES”
Prints header information
“NO”
Cancel header
1 2 3
PRINTING!
XXX STOP XXX
This screen is displayed while printing the text.
•Press the “STOP” button to stop sending data to the printer.
The printer will continue to print until the buffer is emptied.
After the unit is done printing, due to “STOP” button or letting
the data run out, it will return to the “CHOOSE MODE”.
“STOP”
Cancel print
1 2 3

OP 13
8. CONFIGURING THE DATA LOGGER
The Data Logger software has several customizable options. These options allow you to tailor the system operation and
playback functions to your individual needs. The entire configuration process can be performed with menu selections on
the LCD screen.
If you print a pass and are not happy with the preset configuration, you can change the configuration. The configuration
can be changed as often as necessary and will not alter the recorded data in memory. Once the configuration has been
changed, the run can be reprinted with the new settings.
This is a list of options provided by the configuration software. They are explained in more detail in the following
sections.
SYSTEM CONFIGURATION OPTIONS:
1. Data Recording
A) Manual start data recording
B) Delayed start data recording (activated by a selectable engine or drive shaft RPM)
2. Selectable graph scales
A) Pressure
B) Accelerometer
C) Auxiliary channels
D) Calculated ratio plots
3. Noise filter for EGT’s
4. Graph presentation formats
A) Presentation A
B) Presentation B
5. Units for auxiliary channels
A) Auxiliary channel 1
B) Auxiliary channel 2
C) Auxiliary channel 3
D) Auxiliary channel 4

* Optional *
OP 14
8A. SYSTEM CONFIGURATION
The following steps lead you through the System Configuration process.
CHOOSE MODE
Disp Rec# Play
Press the “Play” button. The configuration functions are
accessed through the Play mode.
Press “Play”
Display Brief Details
1 2 3
Choose Function
Setup Cal Play
Press the “Setup” button to enter the Calibration mode.
Press “Setup”
1 2 3
Print SETUP ?
Yes No
The current configuration can be printed from this screen before
any changes are made. This is always a good idea. It gives
you a copy of your current configuration to return to incase an
error is occurs.
• Connect your printer and select “Yes” to print the file
•
Select “No” to go directly to the “CHOOSE FOR SETUP” screen.
“Yes”
Print current setup
“NO”
Do not print current setup
1 2 3
After the printout of the configuration file is complete, you will
be asked if you want to change the setup.
• Pressing “Yes” will initiate the Configure mode allowing you to
change the setup.
• Pressing “No” will return you to the “CHOOSE MODE”.
Change “SETUP” ?
YES NO
“Yes”
Enter Configure mode
“NO”
Return to the
“CHOOSE MODE”
1 2 3
The component that needs to be re-setup is selected from this
screen.
• Press the “SYS” button to re-setup the system. “SYS” allows
you to select the start mode, graph scales, filtering, graph
formats and units for auxiliary channels.
• “MEM” & “PRNT” will be covered in following sections of the
manual.
CHOOSE FOR SETUP
SYS MEM PRNT
Press the “SYS” button
1 2 3
This option allows you to choose if the Data Logger is recording
from in a “CAR” or on a “DYNO”.
• Press the “CAR” button if recording in a car.
• Press the “DYNO” button if recording dyno functons, such as
LOAD cells on the water brake. Not commonly used.
* 17 Channel feature only
System Function
CAR DYNO
“CAR”
Data Logger is in a car
“DYNO”
Data Logger is on a dyno*
1 2 3
The starting device for recording is selected on this screen.
• Pressing the “MAN” button selects a manual start. Both the
“Rec#” button and the remote switch will start recording.
• Pressing the “DRPM” button selects drive shaft RPM as the
starting device. Recording will start when the drive shaft
exceeds 300 RPM. To ensure one second of data is saved
before launch, a second block of data will stored.
• Pressing the “ERPM” button selects engine RPM as the
starting device. Recording will start after a preset engine
RPM has been reached.
RECORD MODE
MAN DRPM ERPM
“MAN”
“Rec#” button or remote
start switch
“DRPM”
Driveshaft RPM
“ERPM”
Engine RPM
1 2 3
ER Pls/Rev 4
UP DOWN ENTER
1 2 3
This option allows you to change the number of pulses per
revolution for the Engine RPM channel. Use the up arrow to
change the number then press enter.

OP 15
START RPM XXXX
Change ENTER
This screen will appear if you selected “ERPM” from the
“RECORD MODE” screen. Here you must specify the engine
RPM that activates the record mode. Your selection can range
from 1000 to 7000 RPM.
• Pressing the “Change” button will increment the RPM by
1000.
• Pressing the “ENTER” button stores your selection.
“Change”
Increment by 1000 RPM
“ENTER”
Store your selection
Display Brief Details
1 2 3
ENABLE RESTART ?
YES EXIT NO
The “ENABLE RESTART ?” screen allows you to instantly
restart a recording. This is used when the Data Logger is set
in manual start mode and a recording is started accidentally
or to early. If this option is OFF and a recording needs to
be restarted, it takes several steps to cancel and restart the
recording. With this option ON, it only takes the press of a
button. This is a big time saver when sitting on the starting line.
• Pressing the “YES” button turns “ENABLE RESTART ?” ON.
• Pressing the “EXIT” button exits to the “CHOOSE MODE”.
• Pressing the “NO” button turns “ENABLE RESTART ?” OFF.
“YES”
Use “ENABLE RESTART”
“EXIT”
Exit to “CHOOSE MODE”
“NO”
Do not use
“ENABLE RESTART”
1 2 3
ACC Scale X.XG
Up EXIT ENTER
From this screen you select the graph scale for the
accelerometer printout. There are three options: 1, 2.5 or 5 G.
• Pressing the “UP” button scrolls through the options.
• Pressing “EXIT” returns to the “CHOOSE MODE”.
• Pressing the “Enter” button stores the selection and advances
to the next screen.
“UP”
Scroll through options
“EXIT”
Return to the
“CHOOSE MODE”
“ENTER”
Store selection and
advance to next screen
1 2 3
MPH Corr.# XXX
UP DOWN ENTER
The system calculates MPH from the Accelerometer data. This
screen allows you to enter a correction factor for slight zero
position misalignments and changes in altitude during the run.
A correction factor of 511 represents no correction applied.
Raising this number will reduce the calculated MPH. Lowering
this number will increase the calculated MPH. The amount of
correction applied is approximately 1% per 50 counts entered in
the correction factor. This number can be set from 0 to 1023.
• Pressing the “UP” button increases the correction factor.
• Pressing the “DOWN” button decreases the correction factor.
• Pressing the “ENTER” button stores the value and advances
to the next screen.
Pressing and holding the “UP” or “DOWN” button will cause the
number to change faster. (Available only when a “RUN” is sent
directly to the printer. 17 Channel only.)
“UP”
Increases count
“DOWN”
Decreases count
“ENTER”
Stores selection
1 2 3
* Optional *
Note: Use enable restart only in manual start mode. It is rarely if ever needed in drive shaft or
engine RPM start mode.

OP 16
EGT Noise Filter
IN EXIT OUT
In some installations it is not possible to completely isolate the
EGT cables from other signal cables. When this happens, you
may get occasional noise fluctuations in the printout. The “EGT
Noise Filter” software is very effective in reducing the effects of
cable noise. If the noise component is more than 20% of the
signal, this filter will not help. The only remedy for this problem
is to provide better separation between the EGT cables and
other signal cables and ignition sources.
• Pressing the “IN” button turns the EGT filter ON and
advances to the next screen.
• Pressing the “EXIT” button returns to the “CHOOSE MODE”.
• Pressing the “OUT” button turns the EGT filter OFF.
“IN”
Turn EGT filter ON
“EXIT”
Return to
“CHOOSE MODE”
“OUT”
Turn EGT filter OFF
Display Brief Details
1 2 3
EGT Graph Scale
1500 BACK 2000
This screen allows the you to choose the scale for the EGT
graph. Depending on your maximum temperature, you can
choose either 1500 or 2000 degrees Fahrenheit.
• Pressing the “1500” button selects a scale with a maximum
temperature of 1500°F.
• Pressing the “BACK” button goes back to the previous screen.
• Pressing the “2000” button selects a scale with a maximum
temperature of 2000°F.
“1500”
1500°F max. temperature
“BACK”
Go back to previous screen
“2000”
2000°F max. temperature
1 2 3
PRES SCALE 50
UP EXIT ENTER
When printing the pressure scale graph you have several
options for maximum PSI (10, 20, 50, 100, 200, 500, 1000 and
2000 PSI).
• Press the “UP” button to increment through the options.
• Press the “EXIT” button to return to the “CHOOSE MODE”.
• Press the “ENTER” button to store your selection.
“UP”
Increment through options
“EXIT”
Return to
“CHOOSE MODE”
“ENTER”
Store your selection
1 2 3
Setup CHNL X ?
YES EXIT NO
Auxiliary channels can be configured from this screen
• Pressing the “YES” button from this screen will allow you to
configure the auxiliary channel(s). The following screens
will allow you to choose the units and graph scale for the
displayed auxiliary channel. You will have the opportunity to
change each of the four auxiliary channels.
• Press the “EXIT” button to return to the “CHOOSE MODE”.
• Pressing the “NO” button increments up through the 4
channels.
“YES”
Configure auxiliary
channel selected
“EXIT”
Return to
“CHOOSE MODE”
“NO”
Increment through auxiliary
channels 1-4
1 2 3
CHX Units=(unit)
Change BAK ENTER
This screen will appear if “YES” is selected from any of the
four “Setup CHNL X ?” screens. Here you can select the
measurement units to be used for the selected channel.
• Pressing the “Change” button advances through the unit
choices (VDC, %, U, PSI, DEGF, and INCH).
• Pressing the “BAK” button will go back to the previous screen.
• Press the “ENTER” button to select the displayed unit.
“Change”
Advance unit choice
“BAK”
Go back to previous screen
“ENTER”
Store your selection
1 2 3
* Optional *

OP 17
CHX L Scl = XXXX
Change BAK ENTER
The high and low end of the graphs scale can be selected for the
auxiliary channels. This makes the resolution and curve position
flexible. The only requirement for the scale is that the left end of
the scale must be a lower value than the right end of the scale.
This screen sets the scale for the left end of the graph.
• Pressing the “Change” button advances through the scale
choices (0, 5, 10, 20, 50, 100, 200, 500, 1000, and 2000).
• Pressing the “BAK” button goes back to the previous screen.
• Pressing the “ENTER” button selects the displayed choice..
“Change”
Advance scale
“BAK”
Go back to previous screen
“ENTER”
Store your selection
Display Brief Details
1 2 3
CHX R Scl = XXXX
Change BAK ENTER
This screen sets the scale for the right end of the graph.
• Pressing the “Change” button advances through the scale
choices (0, 5, 10, 20, 50, 100, 200, 500, 1000, and 2000).
• Pressing the “BAK” button goes back to the previous screen.
• Pressing the “ENTER” button selects the displayed choice.
“Change”
Advance scale
“BAK”
Go back to previous screen
“ENTER”
Store your selection
1 2 3
Setup Ratios ?
Yes EXIT NO
After all “Setup CHNL X ?” have been configured or skipped,
the “Setup Ratios ?” screen will appear.
• Press the “Yes” button to change the graph scales for the
ratio curves.
• Press the “Exit” button to return to the the “CHOOSE MODE”.
• Pressing the “No” button advances you to the
“Setup Graph A ?” screen.
“Yes”
Change graph scales
“Exit”
Return to the
“CHOOSE MODE”
“NO”
Go to “Setup Graph A ?”
1 2 3
ER/DR 0 to XXX
Change BAK Enter
If “Yes” is selected from the “Setup Ratios ?” screen the Engine
RPM to Drive RPM ratio (ratio 3) is the first of the three ratios
that can be changed.
• Press the “Change” button to advance through the scale
values (1, 2, 5, 10, 20, 50, and 100).
• Press the “BAK” button to go back to the previous screen.
• Press the “Enter” button to select the scale.
“Change”
Advance through scales
“BAK”
Return to “Setup Ratios ?”
“Enter”
Make selection and
advance to next screen
1 2 3
SR/DR 0 to XXX
Change BAK Enter
The second ratio is the Shaft RPM to Drive RPM (ratio 2).
• Press the “Change” button to advance through the scale
values (1, 2, 5, 10, 20, 50, and 100).
• Press the “BAK” button to go back to the previous screen.
• Press the “Enter” button to select the scale.
“Change”
Advance through scales
“BAK”
Return to “Setup Ratios ?”
“Enter”
Make selection and
advance to next screen
1 2 3
* Optional *

OP 18
Graph A allows you to select several curves to print as a set.
The curves in Graph A can be printed by selecting “A” from the
“Presentation” screen. Select several related curves to allow
you to quickly and easily print them. If they are not selected
as a set they must be individually selected each time they are
printed.
• Pressing the “Yes” button will allow you to select the curves
for “Graph A”. Any combination of curves can be selected.
The following screens offer all possible data curves for
selection.
• Pressing the “No” button from this screen will automatically
advance to the “Setup Graph B ?” screen (What if you make
no changes).
The same data curve selection screens will appear for
“Setup Graph B”.
ER/SR 0 to XXX
Change BAK Enter
The third ratio is the Engine RPM to Shaft RPM (ratio 1).
• Press the “Change” button to advance through the scale
values (1, 2, 5, 10, 20, 50, and 100).
• Press the “BAK” button to go back to the previous screen.
• Press the “Enter” button to select the scale.
“Change”
Advance scale
“BAK”
Return to “Setup Ratios ?”
“ENTER”
Store your selection
Display Brief Details
1 2 3
Setup Graph A ?
Yes No
“Yes”
Make changes to Graph A
“No”
Make no changes to
“Setup Graph A ?” and go
to “Setup Graph B ?”
1 2 3
Plot in A ? MPH
Yes Done No
• Press the “Yes” button to select this curve.
• Press the “DONE” button to enter the already selected data
curves and advance to plot “B”.
• Press the “No” button to not select this curve and advance to
the next screen.
“Yes”
Select this curve
“Done”
Store selection and go to
“Setup Graph B ?”
“No”
Do not select this curve
1 2 3
Plot in A ? ER
Yes Done No
• Press the “Yes” button to select this curve.
• Press the “DONE” button to enter the already selected data
curves and advance to plot “B”.
• Press the “No” button to not select this curve and advance to
the next screen.
“Yes”
Select this curve
“Done”
Store selection and go to
“Setup Graph B ?”
“No”
Do not select this curve
1 2 3
Plot in A ? DR
Yes Done No
• Press the “Yes” button to select this curve.
• Press the “DONE” button to enter the already selected data
curves and advance to plot “B”.
• Press the “No” button to not select this curve and advance to
the next screen.
“Yes”
Select this curve
“Done”
Store selection and go to
“Setup Graph B ?”
“No”
Do not select this curve
1 2 3
17 Channel print to paper * Option *

OP 19
Display Brief Details
Plot in A ? R3
Yes Done No
• Press the “Yes” button to select this curve.
• Press the “DONE” button to enter the already selected data
curves and advance to plot “B”.
• Press the “No” button to not select this curve and advance to
the next screen.
“Yes”
Select this curve
“Done”
Store selection and go to
“Setup Graph B ?”
“No”
Do not select this curve
1 2 3
Plot in A ? PRS
Yes Done No
• Press the “Yes” button to select this curve.
• Press the “DONE” button to enter the already selected data
curves and advance to plot “B”.
• Press the “No” button to not select this curve and advance to
the next screen.
“Yes”
Select this curve
“Done”
Store selection and go to
“Setup Graph B ?”
“No”
Do not select this curve
1 2 3
Plot in A ? ACC
Yes Done No
• Press the “Yes” button to select this curve.
• Press the “DONE” button to enter the already selected data
curves and advance to plot “B”.
• Press the “No” button to not select this curve and advance to
the next screen.
“Yes”
Select this curve
“Done”
Store selection and go to
“Setup Graph B ?”
“No”
Do not select this curve
1 2 3
Plot in A ? EGT
Yes Done No
• Press the “Yes” button to select this curve.
• Press the “DONE” button to enter the already selected data
curves and advance to plot “B”.
• Press the “No” button to not select this curve and advance to
the next screen.
“Yes”
Select this curve
“Done”
Store selection and go to
“Setup Graph B ?”
“No”
Do not select this curve
1 2 3
Plot in A ? R1
Yes Done No
• Press the “Yes” button to select this curve.
• Press the “DONE” button to enter the already selected data
curves and advance to plot “B”.
• Press the “No” button to not select this curve and advance to
the next screen.
“Yes”
Select this curve
“Done”
Store selection and go to
“Setup Graph B ?”
“No”
Do not select this curve
1 2 3
Plot in A ? R2
Yes Done No
• Press the “Yes” button to select this curve.
• Press the “DONE” button to enter the already selected data
curves and advance to plot “B”.
• Press the “No” button to not select this curve and advance to
the next screen.
“Yes”
Select this curve
“Done”
Store selection and go to
“Setup Graph B ?”
“No”
Do not select this curve
1 2 3

OP 20
Display Brief Details
Plot in A ? SR
Yes Done No
• Press the “Yes” button to select this curve.
• Press the “DONE” button to enter the already selected data
curves and advance to plot “B”.
• Press the “No” button to not select this curve and advance to
the next screen.
“Yes”
Select this curve
“Done”
Store selection and go to
“Setup Graph B ?”
“No”
Do not select this curve
1 2 3
Plot in A ? CH4
Yes Done No
• Press the “Yes” button to select this curve.
• Press the “DONE” button to enter the already selected data
curves and advance to plot “B”.
• Press the “No” button to not select this curve and advance to
the next screen.
“Yes”
Select this curve
“Done”
Store selection and go to
“Setup Graph B ?”
“No”
Do not select this curve
1 2 3
Plot in A ? CH3
Yes Done No
• Press the “Yes” button to select this curve.
• Press the “DONE” button to enter the already selected data
curves and advance to plot “B”.
• Press the “No” button to not select this curve and advance to
the next screen.
“Yes”
Select this curve
“Done”
Store selection and go to
“Setup Graph B ?”
“No”
Do not select this curve
1 2 3
Plot in A ? CH2
Yes Done No
• Press the “Yes” button to select this curve.
• Press the “DONE” button to enter the already selected data
curves and advance to plot “B”.
• Press the “No” button to not select this curve and advance to
the next screen.
“Yes”
Select this curve
“Done”
Store selection and go to
“Setup Graph B ?”
“No”
Do not select this curve
1 2 3
Plot in A ? CH1
Yes Done No
• Press the “Yes” button to select this curve.
• Press the “DONE” button to enter the already selected data
curves and advance to plot “B”.
• Press the “No” button to not select this curve and advance to
the next screen.
“Yes”
Select this curve
“Done”
Store selection and go to
“Setup Graph B ?”
“No”
Do not select this curve
1 2 3
Table of contents
Other AutoMeter Data Logger manuals
