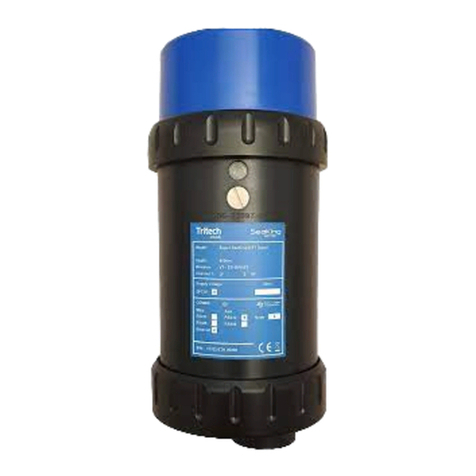
Blueprint Subsea Oculus M Series User manual

Oculus M-Series Sonar
User Manual


Oculus M-Series Sonar
User Manual
3
Contents
1. Introduction ..............................................................................................................................................................5
2. ViewPoint Software...................................................................................................................................................6
2.1. Viewing Sonar Data ...........................................................................................................................................6
2.1.1. Sonar Display....................................................................................................................................................................................... 6
2.1.2. Sonar Information ............................................................................................................................................................................... 7
2.1.3. Frequency Mode Control ..................................................................................................................................................................... 7
2.1.4. Range Control...................................................................................................................................................................................... 7
2.1.5. Gain Control......................................................................................................................................................................................... 7
2.2. Display Tools......................................................................................................................................................8
2.2.1. Measurement Mode............................................................................................................................................................................. 8
2.2.2. Snapshot Display................................................................................................................................................................................. 8
2.2.3. Sonar Palette ....................................................................................................................................................................................... 8
2.2.4. Horizontal Display Flip......................................................................................................................................................................... 8
2.2.5. Vertical Display Flip ............................................................................................................................................................................. 8
2.3. Recording Sonar Data........................................................................................................................................8
2.4. Replaying Sonar Data ........................................................................................................................................9
2.4.1. Playback Display.................................................................................................................................................................................. 9
2.4.2. Play / Pause Control ............................................................................................................................................................................ 9
2.4.3. Playback Speed ................................................................................................................................................................................... 9
2.4.4. Repeat Control..................................................................................................................................................................................... 9
2.5. Application Settings ........................................................................................................................................10
2.5.1. Log File Storage Location.................................................................................................................................................................. 10
2.5.2. Maximum Log File Size ...................................................................................................................................................................... 10
2.5.3. Speed (Velocity) Of Sound................................................................................................................................................................. 10
2.5.4. Colour Theme .................................................................................................................................................................................... 11
2.6. Sonar Configuration ........................................................................................................................................11
2.6.1. DHCP Client........................................................................................................................................................................................ 11
2.6.2. IP Address & Subnet Mask ................................................................................................................................................................. 12
2.6.3. Network Speed Limit......................................................................................................................................................................... 12
2.6.4. Gain Assist.......................................................................................................................................................................................... 12
2.6.5. Gamma Control ................................................................................................................................................................................. 12
2.6.6. Firmware Update............................................................................................................................................................................... 12
3. Using the Sonar.......................................................................................................................................................13
3.1. Operating Principles........................................................................................................................................13
3.2. Acoustic Beam Patterns ..................................................................................................................................15
3.3. Target Visibility ................................................................................................................................................16
3.4. Viewing the Seabed .........................................................................................................................................17
3.5. Acoustic Shadows............................................................................................................................................18
3.6. Understanding Echoes ....................................................................................................................................20
3.7. Range vs Frequency and Image Quality..........................................................................................................21
3.8. Summary of Sonar Operation .........................................................................................................................22
4. Technical Reference................................................................................................................................................23
4.1. Specifications ..................................................................................................................................................23
4.2. Mechanical Dimensions...................................................................................................................................24
4.3. Sonar Connector Pinout..................................................................................................................................25
4.4. Ethernet Sonar Whip Wiring............................................................................................................................25
4.5. Ethernet Deck Lead Wiring ..............................................................................................................................26
5. Product Support .....................................................................................................................................................27
5.1. Website ............................................................................................................................................................27
5.2. Technical Support ...........................................................................................................................................27

Oculus M-Series Sonar
User Manual
4
6. Limited Warranty Policy .........................................................................................................................................28
7. Notices.....................................................................................................................................................................29

Oculus M-Series Sonar
User Manual
5
1. Introduction
Traditionally, sonars were mechanical devices that operated by rotating their transducers (transmitters and
receivers) to scan the sector in front of or around them. At each transducer position, a sound pulse would be
transmitted into the water, and the echoes collected by the receiver before being plotted onto the display.
Depending on the required resolution an image could tens of seconds to update, and any movement of the sonar
during this period could smear and distort the imagery.
Unlike mechanical sonars, Oculus is a multi-beam sonar that has no moving parts, and an array of receivers that
collect echoes from a single transmission pulse and mathematically combine the data into an image using a
process known as “beam-forming”. This allows images to be produced many times per second and viewed in real-
time like the output from a video camera.
Some Oculus sonars (with a ‘d’ suffix at the end of their name) are dual-frequency, having Low-Frequency and
High-Frequency operating modes that allow the operator to choose between longer acoustic ranges or high-
resolution imagery respectively.
Sonar imagery can take some training and practice to interpret as the display appears to the operator as a top-
down view covering the area in-front of them, acoustically illuminating a sector up to 130° horizontally and 20°
vertically depending on the selected frequency mode. The brightness of targets and textures on the display
represents how much sound has been reflected from them (with gaseous or dense materials reflecting more than
mud, sand and silt), while acoustic shadows can be cast based on the geometry of objects or the seabed.
In the following sections, this manual aims to explain the basics for the correct configuration and operation of the
Sonar, and how to start interpreting the images it produces.
Symbols
Throughout this document the following symbols are used to indicate special precautions or procedures you
should note…
WARNING!
This symbol indicates a warning you should follow to avoid bodily injury or damage to your equipment.
CAUTION
This symbol denotes precautions and procedures you should follow to avoid damage to your equipment.
NOTE
This symbol denotes special instructions or tips that should help you get the best performance from your
equipment.

Oculus M-Series Sonar
User Manual
6
2. ViewPoint Software
ViewPoint is a software application that is used to view, record and playback imagery from the Oculus sonar, in
addition to providing tools that help configure environmental and network settings.
2.1. Viewing Sonar Data
When ViewPoint starts, the Home screen is shown, but no imagery is available until the application is connected
to sonar hardware.
To start viewing sonar imagery, click the “Connect” button at the
top left of the display –this will attempt to find and connect to any
Oculus sonar that is on the same network (and subnet) as the
computer running the ViewPoint software.
If several Oculus sonars are connected, the user will be prompted
to choose the specific one they wish to connect to.
If an Oculus is configured to connect to a different subnet from that of the computer running viewpoint (i.e. the
sonars IP address is 192.168.48.45, while the computers is 192.168.0.100), then Viewpoint will be able to show the
presence and network details of the Oculus, but the operating system network settings will prevent a connection
from being made.
In this case, the user will need to adjust the network settings of either the sonar or computer as discussed in the
previous “Network Setup” section of this manual, or contact their Network Administrator for further assistance.
To disconnect from a sonar, click the highlighted “Connect” button, network traffic will stop and the sonar
hardware will enter a low power state.
2.1.1. Sonar Display
When a connection is made to the Oculus, ViewPoint will show the live sonar image in the centre of the display
with controls and status information arranged at the corners of the window:

Oculus M-Series Sonar
User Manual
7
2.1.2. Sonar Information
Sonar hardware information is shown at the top left of the display below the ‘Connection’ button – this includes
the serial number of the connected sonar, network addresses and firmware version in use.
Sonar device settings can be adjusted by clicking the ‘Configure Sonar’ button – this is discussed in further detail
in a subsequent section of the manual.
2.1.3. Frequency Mode Control
Some Oculus sonars (with a ‘d’ name suffix) support dual frequency operation, where the current mode can be
chosen to be:
Low Frequency mode has a 130° horizontal field-of-view and
allows the sonar to see targets up to it maximum range, but the
definition of targets is lower than the High Frequency mode –this
is commonly used for searching activities.
High Frequency mode (where supported) has a reduced 80°
horizontal field-of-view and reduced maximum range compared
to Low Frequency mode. High Frequency mode provides high-
definition images of close-up targets and is commonly used for
inspection activities.
2.1.4. Range Control
Use this slider to select the range the sonar image will represent on the display. As the range is increased, the
time required for the sound to reach the furthest targets and return will also increase so the image update rate
with slow down. Power consumption of the sonar will also increase at higher ranges as the receiver circuitry will
be active for longer periods of time while data is collected.
2.1.5. Gain Control
Use this slider to control the gain of the sonar receivers –this can be thought of like a “volume” control that can
be turned up to “hear” quieter target echoes or turned down if echoes are too loud and drowning out the quieter
ones.
As the display shows intensity of received echoes as colour brightness, the gain control has the effect of
brightening or darkening the display:
If the display is too dark and fine details cannot
be seen, then increase the gain.
Similarly, if the display is too bright (saturated),
then smaller targets and details may be lost so
reduce the gain.

Oculus M-Series Sonar
User Manual
8
2.2. Display Tools
For both the Live Data and Playback displays, a selection of tools are available at the bottom right-hand side:
2.2.1. Measurement Mode
Toggles Measurement mode, where the user can use the left mouse button to drag a line between two points
and range and bearing information will be shown in the cursor information area at the top right hand side of the
display.
2.2.2. Snapshot Display
Saves a copy of the current sonar display into a PNG image files located in the selected Log File directory. Files
are given an automatically generated name containing the date and time the snapshot was taken.
For further details on selecting or changing the Log File directory, see the “Application Settings” section below
in this manual.
2.2.3. Sonar Palette
Displays a pop-up menu that allows the user to select a colour scheme for the sonar image from a selection of
different predefined palettes.
2.2.4. Horizontal Display Flip
Toggles weather the sonar image has been flipped horizontally –this is useful to help align the sonar image with
the mounting orientation of the hardware.
2.2.5. Vertical Display Flip
Toggles weather the sonar image has been flipped vertically –this is useful to help align the sonar image with
the mounting orientation of the hardware.
2.3. Recording Sonar Data
Once ViewPoint has been connected to an Oculus sonar (as described in the previous section) and live data is
being displayed, a Log File can be created that records this data and allows subsequent playback, review and
export of imagery.
To start recording a Log File, click the “Record” button in the bottom left corner of the display – it will be
highlighted while recording is in progress. To stop recording, click the button again
Log Files are given an automatically generated name containing the date and time recording was started, and are
saved into the selected Log File directory with a “.oculus” file extension.
For further details on selecting or changing the Log File directory, see the “Application Settings” section below in
this manual.

Oculus M-Series Sonar
User Manual
9
2.4. Replaying Sonar Data
ViewPoint can be used to review sonar imagery from a previously recorded Log File.
To choose a Log File to play back, click the “Open” button from the
top-left of the display:
An “Open File” requester will be displayed, allowing the user to
select the Log File (with “.oculus” file extension) that they wish
to work with.
Depending on the size of the chosen Log File, it may take several
seconds after the “Open” button is clicked for the file to be
analysed before the Playback display is shown.
2.4.1. Playback Display
Once a Log File has been opened, the following Playback display will be shown (in the example below the Log File
recorded High-Frequency sonar data, so the image is only 80° wide rather than 130°):
2.4.2. Play / Pause Control
The slider control represents the duration of the recorded Log File. Drag the slider to the desired playback
position, then click the Play button to toggle the update of the sonar imagery. The timestamp of the currently
displayed data is shown to the right of the position slider.
2.4.3. Playback Speed
Use this slider to control the rate as which data is replayed on the display, as a multiple of the rate at which it
was recorded (i.e. x1 is real-time replay).
2.4.4. Repeat Control
Use this control to toggle is the Log File should automatically restart playback from the beginning of the file when
the end is reached.

Oculus M-Series Sonar
User Manual
10
2.5. Application Settings
Settings that control the general behaviour of ViewPoint can be
adjusted from the “Settings” window that is accessed by clicking the
icon at the right-hand side of the programs title bar:
When the Settings window is shown, clicking one of the ‘tab’ heading across the top of the window will change its
contents.
Click “OK” to accept any changes made and close the window, or “Cancel” to close without applying the changes.
The following sections discuss the options available:
2.5.1. Log File Storage Location
When the Record or Snapshot buttons are clicked either a Log File or PNG image file is created in the selected Log
File directory. The location of this directory can be chosen from the Settings window, under the ‘General’ tab
heading.
Enter the path where Log Files should be recorded to into the text box, or click the ‘Browse’ button on the right.
2.5.2. Maximum Log File Size
Oculus sonars can produce a lot of data quickly and recorded Log Files can grow quite large quickly. To make Log
Files more manageable, the maximum size of the file can be specified on the ‘General’ tab of the Settings Window.
When a Log File is being recorded and its size exceeds this value, the file is closed and recording continues in a
subsequent automatically named Log File.
2.5.3. Speed (Velocity) Of Sound
For the correct and accurate ranges to targets, and to ensure that the sonar image is sharply focused, it is
important that the speed of sound in water is correctly specified. For example, if Oculus is being used to measure
the range to a target 10m away with a 1% error in the speed of sound then this will result in a 10cm error in the
range measurement.

Oculus M-Series Sonar
User Manual
11
From the “Environment” tab, select one of the following options to specify how the velocity-of-sound (VOS) is
calcualted:
Fresh Water –salinity is specified as 0 ppt (parts per thousand), and VOS is continuously calcualted
from pressure and water temperature sensor readings.
Salt Water - salinity is specified as 35 ppt, and VOS is continuously calcualted from pressure and water
temperature sensor readings.
Use Velocity - the manually specified VOS value is used.
2.5.4. Colour Theme
The colour scheme of ViewPoint can be adjusted depending on the type of environment it is being used in:
From the “Application” tab, select one of the following:
Dark Grey –Standard colour scheme used for tablets and hand-held devices outdoors.
Navy Blue –Often used in control rooms and low-light situations to reduce glare.
2.6. Sonar Configuration
When ViewPoint is connected to an Oculus sonar (and the display
is showing live data from it), the hardware configuration can be
adjusted by clicking the “Configure” button at the top-left of the
display:
These options are used to control how the sonar hardware is
configured (not the ViewPoint software application).
When the Configuration window is shown, clicking one of the ‘tab’ heading across the top of the window will
change its contents.
Click “OK” to accept any changes made and close the window, or “Cancel” to close without applying the changes.
The following sections discuss the options available:
2.6.1. DHCP Client
When “DHCP Enable” is active, the Oculus sonar will attempt to obtain its network IP address and subnet mask
from an external DHCP server connected to the network.

Oculus M-Series Sonar
User Manual
12
If no DHCP server is found then Oculus will use a default address starting with 169.254.x.x, where the last two
number groups (‘x.x’) are the hardware serial number of the Oculus interpreted as two 8-bit numbers (rather than
a larger 16-bit number).
Changing this function may require the Oculus hardware to be restarted and ViewPoint reconnected to the sonar.
2.6.2. IP Address & Subnet Mask
When “DHCP Enable” is turned off, the IP address and subnet mask for the sonar can be manually specified
through these two text boxes –otherwise they are disabled, and display the current DHCP assigned values.
Changing these values may require the Oculus hardware to be restarted and ViewPoint reconnected to the sonar.
2.6.3. Network Speed Limit
If Oculus data is being sent over a bandwidth-limited network connection with other sensor/camera data (such
as a DSL extender, of WiFi) connectivity issues or dropped data packets may be observed.
In such cases, the network bandwidth available to Oculus can be decreased using the “Speed Limit” control, and
the sonar update rate will be reduced until the data output falls below the specified value.
2.6.4. Gain Assist
To simplify its operation for the user and produce optimal imagery across a wide variety of environments, Oculus
contains an automatic-gain control algorithm.
When “Gain Assist” is active, Oculus will manage the sonar gain to ensure that the sonar image uses the full spread
of the selected palette helping fine textures and details to be visible - the ViewPoint gain control will act more like
a ‘brightness’ control on the display in this mode.
Like a photographer wanting manual exposure control of their photographs, experienced users or those with
scientific applications may wish to disable Gain Assist, and manage the acoustic gain manually using this control.
2.6.5. Gamma Control
The Gamma control allows the user to adjust the Gamma correction applied to the sonar imagery, which
represents the non-linear dark-to-light mapping of acoustic echo intensities to the sonar palette.
Under normal circumstances the user should not have to adjust the Gamma control, but experienced users may
wish to optimise the sonar imagery under certain circumstances by adjusting the Gamma value from its default
value of about 0.6.
2.6.6. Firmware Update
The firmware running on in the Oculus sonar can be upgraded while in the field so that new features can be added
or bugs fixed without the unit being returned to the factory.
The current version of the firmware is displayed in the Sonar Information area of the display when a network
connection is made.
ViewPoint can be used to program new firmware into the sonar by choosing the “Update” button and specifying
the new firmware file when prompted. A progress bar display the state of the firmware update.

Oculus M-Series Sonar
User Manual
13
3. Using the Sonar
The following sections aim to explain the basics for operation of the Oculus Sonar and how to start interpreting
the images it produces.
3.1. Operating Principles
Oculus is an active SONAR (SOund Navigation And Ranging), and operates by transmitting pulses of sound into
the water and at the same time starting its receivers recording the echoes that are returned as each sound
pulse is reflected off objects in front of it .

Oculus M-Series Sonar
User Manual
14
By combining the known Velocity-Of-Sound (VOS –‘c’) in water with the time the echoes were received (‘t’), the
sonar can calculate the distance the sound has travelled (‘d’).
As sound must travel from the Sonar to the target object and then back again, the range (‘r’) between the Sonar
and target is half of the total distance travelled.
𝑑 = 𝑐 × 𝑡
𝑟 = 𝑑
2
𝑟 = 1
2 × 𝑐 × 𝑡
Typically, the VOS is about 1500ms-1, but this can vary depending on the water temperature, water salinity and
sonar operating depth. To calculate this, Oculus contains a sensor that continuously measures the operating
depth and water temperature, and combines this with an appropriate Salinity value for the body of water that it
is operating in, entered by the user in the control software.
In the real-world, the Sonar will see more than one target in front of it. The transmitted pulse of sound will reflect
off each target at a different time, but the receiver will be recording all the echoes over a period equivalent to
twice the maximum operating range (for sound travelling to and from the target).
The received echoes are combined into a single received signal where their position in time directly relates to their
range, while the strength of each echo depends on how reflective the target is.
Targets with densities very different from water (such as gas/air or rock/concrete) will be very reflective and have
strong echoes, while echoes from materials like mud, silt, sand and plants will have weaker echoes.
The strength of the echo is
displayed on the divers display as
the brightness of a colour palette.
Typically, darker colours in the
sonar palette are used for weak
echoes, while bright-white
colours are used for strong
echoes.
The sonar image opposite shows
how a mid-water steel cable
appears brighter than the muddy
seabed behind it.

Oculus M-Series Sonar
User Manual
15
3.2. Acoustic Beam Patterns
When considering how sonars operate, it may help to think of the sonar like a torch being used in a darkened
room. Only the parts of the room illuminated by the torch can be seen by the user, and if the torch has a narrow
beam then their field of vision is reduced.
Similarly, the sonar has a fixed width and height to the area it ‘illuminates’ with sound, and these are called the
Horizontal and Vertical Beam Patterns.
Oculus sonars with a ‘d’ name suffix (such as the M750d and M1200d) are dual-frequency devices that support two
operating modes - Low Frequency and High Frequency.
Single frequency Oculus sonars (with a ‘s’ name suffix such as the M370s) only support the Low Frequency
operating mode. E
ach mode has its own beam pattern illustrated in the figures below:
Horizontal
Width
Vertical
Width
Maximum Range (approximately up to)
M370s
M750d
M1200s
Low Frequency
130°
20°
200m
120m
40m
High Frequency
80°
12°
N/A
40m
10m

Oculus M-Series Sonar
User Manual
16
3.3. Target Visibility
Objects (or targets) that lie within the sonar’s beam will be acoustically “illuminated” and can have their echoes
received (target ), while objects that lie outside this (targets and ) may not appear on the sonar display:
It should be noted that although the above diagrams show a boundary to the sonar beam, but this actually
represents the ‘half-power’ level of the sound waves. Vertical targets outside this area may still be visible on the
display, but their echo level will decrease quickly as they get further away from the beam pattern.
Horizontally, images outside the beam pattern are not shown because of the fixed width nature of the ‘top-down’
display.
The sonar cannot determine the echoes incoming vertical arrival angle, so if two targets are in front of the sonar
at the same range vertically above each other the sonar will show both these as a single result made up from a
combination of their echoes.

Oculus M-Series Sonar
User Manual
17
3.4. Viewing the Seabed
As discussed in previous sections, the sonar can be thought of like a hand-held torch with an illuminating beam
that is wide horizontally and narrow vertically –continuing this analogy, the sonar images shown on the operators
display can then be thought of as a “top-down” view of the area being illuminated.
For users wishing to perform search-and-location activities or seabed surveys, Oculus can be mounted such that
different amounts of the seabed can be illuminated and visible on the display:
If the sonar is close to the seabed and angled downwards then only a small strip in front of it will be shown. By
gaining altitude from the seabed the operator can illuminate a wider swathe that will make better use of the
display .
For situations requiring the sonar to be searching the seabed in front of it, the best use of the display comes from
balancing the altitude above the seabed with the sonar down angle such that the largest amount of the seabed is
illuminated .
As a very general rule, the sonar can achieve an optimum 70% seabed coverage on the display if has a 15°
down angle and an altitude of above 10% of the operating range –i.e. for a 20m range, the sonar should be
mounted approximately 2m above the seabed, while at an 80m range the altitude should be increased to
about 8m.

Oculus M-Series Sonar
User Manual
18
3.5. Acoustic Shadows
The similarities between a sonar and torch continue as the ‘illumination’ from the sonar can be used to generate
acoustic shadows, and these can be of great assistance to the operator in determining the height, shape and
orientation of targets in front of the sonar.
As previously mentioned, the display can be thought of as a top-down (or satellite) view of what lies in front of the
Oculus:
If the sonar is close to the seabed and at a shallow
angle, the acoustic shadows cast by targets will be
long (similar to an aerial photograph taken in the
evening when the sun is low in the sky).
Using the “10% rule” discussed on the previous page
will allow the sonar to produce good shadows behind
possible targets, and with some practice the operator
can start to make estimates of their height and
orientation, or the terrain in front of them.
However, if the sonar is high above the seabed and
point steeply downwards then acoustic shadows will
be short (like an aerial photograph then at midday
when the sun is high in the sky).
In this case targets are generally harder to see, and
make estimates of their height and geometry.

Oculus M-Series Sonar
User Manual
19
Depending on how close the sonar is to a target can also make a significant difference to the image.
Due to the way sounds waves spread out from the transmitter, shadows cast by targets that are far away will be
narrow behind them , but the shadow width will increase as the sonar is moved closer to them. In these
situations, the operator should be aware that these shadows may then hide other targets as there is no sound
present to illuminate them .
Where the operator’s visibility is becoming restricted due to shadowing from close-by targets, they should aim to
increase the sonar altitude above the seabed (and the targets causing the shadows) and is possible angle the
sonar downwards to compensate.
The image opposite shows an example of shadows
from 3 targets being cast.
The sonar is positioned at the left of the image, and
because the targets are raised above the seabed, their
bright echoes are seen first and shadows are cast
away from the it.
The length of the shadow gives an indication of height
of the car tyre, while the metal plate is probably
angled upwards as the shadow size increases along its
edge.
The 1m cube target also has a rope attached to its top
surface and mesh sides, as these can be seen by the
‘ragged’ shadow and line that rises away from it.

Oculus M-Series Sonar
User Manual
20
3.6. Understanding Echoes
Although it has been mentioned that the sonar display can be thought of as a top-down image of the area in front
of them, there are some limitations to this analogy.
As the image is illuminated from the side by the sonar, only the edges or faces of targets closest to the sonar will
be illuminated.
If a target face is at an angle, then some of the incoming sound waves will be reflected towards the sonar while
others will be scattered away in different directions and the overall brightness of the target will be reduced.
The figure below illustrates this, highlighting in red the areas on three simple targets that will appear brightest on
the display, and how these appear from real-world targets:
Car Tyre
1m Hollow Cube
These same principles also apply to larger
environments. The figure opposite shows how some
of the features found in docks or harbours may
appear.
Depending on the orientation of the sonar, corrugated
pilings will have small areas of shadow, and bright
returns from the edges facing the diver.
Concrete walls and quays will also produce bright
returns from flat surfaces, but can also have large
areas of shadow behind parts of the structure.
This manual suits for next models
3
Table of contents
Other Blueprint Subsea Sonar manuals


