Cleverscope CS328A User manual
MANUAL
MANUALMANUAL
MANUAL
Oscilloscope
OscilloscopeOscilloscope
Oscilloscope
Model CS328A
Model CS328AModel CS328A
Model CS328A
Application CS300 Features
Application CS300 FeaturesApplication CS300 Features
Application CS300 Features
•Separate, freely movable and
resizable windows to display the
signal, a zoomed signal view, and
the frequency spectrum of the
signal, and control panel
•The zoomed signal view optionally
tracks the signal view cursor.
•Spectrum Analysis with a variety of
conditioning windows and display in
log or linear format.
•Each signal window includes a
time/amplitude tracer, and two
markers for comparison purposes.
Colours are user definable.
•Signal averaging (exponential, block
and peak hold) and low pass filtering.
•Signal measurement, including Peak t0
Peak, RMS, DC, pulse width, period and
frequency.
•Copy and Paste graphic or data to other
applications.
•Save and Open from disk.
•User defined units, signal names and
scaling (offset and gain).
•Text annotation of each graph.
•Web server for remote viewing of LAN
connected unit.
www.cleverscope.com
www.cleverscope.comwww.cleverscope.com
www.cleverscope.com

2 Cleverscope CS328A User Manual

Cleverscope CS328A User Manual 3
Table of Contents
Table of ContentsTable of Contents
Table of Contents
Document Control ........................................................................................................................................................................... 6
1OVERVIEW ............................................................................................................................... 7
2QUICK GETTING STARTED GUIDE........................................................................................ 9
2.1 Cleverscope Basics and Probe Compensation .................................................................................................................. 9
2.2 How to use the Signal Generator ..................................................................................................................................... 12
2.3 Keyboard Shortcuts .......................................................................................................................................................... 13
3CLEVERSCOPE NAVIGATION AND CONTROL................................................................... 14
3.1 Keyboard Shortcuts .......................................................................................................................................................... 17
4CLEVERSCOPE CONTROL PANEL...................................................................................... 18
4.1 Signal Acquiring................................................................................................................................................................ 18
4.1.1 Autoset ........................................................................................................................................................................ 18
4.1.2 Channel Enabling ........................................................................................................................................................ 18
4.1.3 AC/DC Coupling......................................................................................................................................................... 18
4.1.4 Anti-aliasing Filter Bandwidth.................................................................................................................................... 18
4.1.5 Probe Attenuation........................................................................................................................................................ 18
4.1.6 Duration, Resolution, N Display and F Sample .......................................................................................................... 19
4.1.7 Averaging.................................................................................................................................................................... 19
4.1.8 Lock Result ................................................................................................................................................................. 20
4.1.9 Get Frame Buffer ........................................................................................................................................................ 20
4.2 Display Controls................................................................................................................................................................ 20
4.2.1 Method for Displaying Signals ................................................................................................................................... 21
4.3 Triggering .......................................................................................................................................................................... 22
4.3.1 Digital Triggering........................................................................................................................................................ 23
4.4 Cursors............................................................................................................................................................................... 24
4.5 Cleverscope Menus ........................................................................................................................................................... 24
4.5.1 File Menu .................................................................................................................................................................... 24
4.5.2 Edit Menu.................................................................................................................................................................... 26
4.5.3 Settings Menu ............................................................................................................................................................. 26
4.5.4 View Menu.................................................................................................................................................................. 34
4.5.5 Window Menu............................................................................................................................................................. 34
4.5.6 Help Menu................................................................................................................................................................... 34
5SCOPE GRAPH ...................................................................................................................... 35
5.1 Vertical Axis ...................................................................................................................................................................... 35
5.2 Horizontal Axis.................................................................................................................................................................. 36
5.3 Tracers and Markers ........................................................................................................................................................ 36
5.3.1 The Tracer ................................................................................................................................................................... 36
5.3.2 Placing Markers .......................................................................................................................................................... 36
5.3.3 Measuring Differences and Frequency........................................................................................................................ 36
5.3.4 Digital Tracers and Markers........................................................................................................................................ 36

4 Cleverscope CS328A User Manual
5.4 Frame and Trigger Time Stamp ...................................................................................................................................... 37
5.5 Graph Settings................................................................................................................................................................... 37
5.6 Zooming the Graph........................................................................................................................................................... 37
5.6.1 How Zooming Works.................................................................................................................................................. 37
6TRACKING GRAPH................................................................................................................ 38
7SPECTRUM GRAPH .............................................................................................................. 39
8SIGNAL INFORMATION......................................................................................................... 40
8.1 DDE Links ......................................................................................................................................................................... 40
8.2 Logging............................................................................................................................................................................... 41
8.3 Signal Information Descriptions ...................................................................................................................................... 41
8.4 Spectrum Information Descriptions ................................................................................................................................ 42
9XY GRAPH.............................................................................................................................. 42
10 PROTOCOL DECODER AND SETUP.................................................................................... 43
10.1 I2C protocol........................................................................................................................................................................ 45
10.2 UART protocol .................................................................................................................................................................. 46
10.3 SPI Protocol....................................................................................................................................................................... 47
11 MATHS.................................................................................................................................... 48
11.1 Maths Graph ..................................................................................................................................................................... 48
11.2 Maths Equation Builder ................................................................................................................................................... 48
11.2.1 Maths Equations Operators and Functions................................................................................................................. 50
11.2.2 Maths Equations Processes ........................................................................................................................................ 51
11.3 Maths Equation Builder Walkthrough ........................................................................................................................... 52
11.3.1 The Example .............................................................................................................................................................. 52
11.3.2 Deriving Differential Voltage .................................................................................................................................... 53
11.3.3 Deriving Current ........................................................................................................................................................ 53
11.3.4 Deriving Power .......................................................................................................................................................... 54
11.3.5 Deriving Energy......................................................................................................................................................... 55
12 NOTES .................................................................................................................................... 56
13 SIGNAL GENERATOR CONTROL ........................................................................................ 57
13.1 Signal Generator Simulator ............................................................................................................................................. 58
14 USING THE ETHERNET CLEVERSCOPE............................................................................. 59
14.1 Using Cleverscope on a DHCP network.......................................................................................................................... 59
14.1.1 Other DHCP connection options................................................................................................................................ 60

Cleverscope CS328A User Manual 5
14.2 Using Cleverscope on a Fixed IP network....................................................................................................................... 62
14.2.1 Local Fixed IP network.............................................................................................................................................. 62
14.2.2 Remote Fixed IP network .......................................................................................................................................... 67
15 CLEVERSCOPE SUPPORT ................................................................................................... 68
15.1 Minimum PC Requirements ............................................................................................................................................ 68
15.2 Download and installation of software ............................................................................................................................ 68
16 SPECIFICATION..................................................................................................................... 71
16.1.1 Acquisition................................................................................................................................................................. 71
16.1.2 Analog Inputs............................................................................................................................................................. 71
16.1.3 Vertical....................................................................................................................................................................... 71
16.1.4 Horizontal .................................................................................................................................................................. 71
16.1.5 Trigger ....................................................................................................................................................................... 72
16.1.6 Digital Inputs ............................................................................................................................................................. 72
16.1.7 Calibration ................................................................................................................................................................. 72
16.1.8 Measurements ............................................................................................................................................................ 72
16.1.9 Displays ..................................................................................................................................................................... 73
16.1.10 Mathematical Functions........................................................................................................................................... 73
16.1.11 Spectrum Analysis ................................................................................................................................................... 73
16.1.12 Windows facilities ................................................................................................................................................... 74
16.1.13 Probe Compensator Output...................................................................................................................................... 74
16.1.14 Power Source ........................................................................................................................................................... 74
16.1.15 Environmental.......................................................................................................................................................... 74
16.1.16 Mechanical............................................................................................................................................................... 74
16.1.17 Expansion Capability ............................................................................................................................................... 74

6 Cleverscope CS328A User Manual
Document Control
Document
DocumentDocument
Document
Version
VersionVersion
Version
Date
DateDate
Date
Cleverscope
CleverscopeCleverscope
Cleverscope
Version
VersionVersion
Version
Description of Changes
Description of ChangesDescription of Changes
Description of Changes
Author
AuthorAuthor
Author
1.0 27/8/04 V 2.2 First Draft ATG
1.1 7 /9/04 V3.1 Small additions BES
1.2 11/3/05 V3.2 Removed registration description BES
2.1 12/08/05
V3.418 Basic reformat
Add Sig Gen & Digital Inputs
Add Maths Equation Builder
Update all pictures
IJH
2.2 3/02/06 V3.509 Add Period Trigger
Add Waveform Averaging
IJH
2.3 17/02/06
V3.510 Various minor corrections IJH
2.4 11/12/06
V3.524 Update Signal Information
Update Sig Gen Controls
Remove Walkthrough
Add Quick Getting Started
Update screenshots
Add File Logging
Add XY Graph
Add Maths Graph
IJH
2.5 30/07/07
V4.615 Update screenshots
Add Graph knob palette
Add Graph fine pan
Add Autoset
Updated Quick Getting Started Guide to include Autoset
IJH
2.6 25/02/09
V4.635 Change format from 2-up to 1-up per A4 & front cover to editable
Update Choose Acquirer and set connection, Sig Gen wave types, Maths
processes, screenshots
Add info & graph sources, Protocol Decoder and Setup, Trigger Time,
Info logging & DDE
Add Using the Ethernet Cleverscope section
Re-organised sections
Add Heading numbering & pictures to protocol section. Small edits.
IJH
BES

Cleverscope CS328A User Manual 7
1 Overview
The Cleverscope CS328
Cleverscope CS328Cleverscope CS328
Cleverscope CS328A
AA
A is a USB connected PC based mixed signal oscilloscope, spectrum analyser, and signal generator
which brings benefits to the user that are unavailable from traditional stand-alone oscilloscopes. This innovative approach
delivers an unbeatable combination of affordability, ease of use and documentation of test results with the simple “Copy”
and “Paste” facility. Graphs and data can be copied and pasted to other applications, saved or loaded from disk, and printed.
Cleverscope hardware resources include:
•Two 10 bit, 12bit, or 14 bit analog channels sampling simultaneously at 100 MSa/s. AC or DC coupled. The bit
resolution is field upgradeable by changing the sampler circuit board.
•Scaling and offsetting to view 50mV full scale offset to any value between –8 and +8 V.
oGain automatically set from 20mV full scale to 800V full scale by choosing graph view and probe switch setting.
oOffset automatically set from 0 to ±4 or 40V in 10/100 mV increments by choosing graph view. As an example
20 mV signals may be viewed superimposed on a 3V DC level.
•Analog triggering of the waveform in view with a resolution of 1% of the display height. The analog trigger may
optionally be conditioned with a low pass, high pass or noise filter.
•One external trigger, threshold adjustable from 0 to ±20V in 40 mV increments.
•Eight digital inputs sampling at 100 MSa/s, threshold adjustable from 0 to 8 V in 10 mV increments.
•A hardware trigger system based on a rising or falling edge on any input signal, optionally qualified by a user
determined digital input combination and a minimum or maximum trigger duration.
•A rear panel I/O connector with a 100 Mbit/s bi-directional LVDS/RS422 link, and three RS422 outputs defaulting
to sampling started, trigger received and sampling stopped.
•Each channel (two analog, trigger and 8 digital) includes 4M samples of storage, providing up to 40 ms of
simultaneous storage for all channels, with 10 ns resolution.
oThe sample storage may be allocated as between 2 to 1000 frames varying in size from 2M to 4000 samples.
These may be used as a history store for reviewing previously captured signals, or to capture up to 1000 trigger
events with a minimal 2 µs inter-frame delay, while maintaining time relative to the first trigger for all succeeding
frames.
•25 MHz 5th order Anti-alias filter for improved Spectrum Analysis performance.
•Triggered LED and Power LED on the front panel.
•Input power range from 6 ~ 12V, 5W provided by a universal mains adaptor.
•Low jitter (1 ps rms) sampling clock for 70 dB spurious free dynamic range.
•Self calibration to ensure DC performance specifications is met.
•An optional plug-in signal generator, 0-10MHz, sine, square or triangle.
•Enclosure size: 153 x 195 x 35 mm.
Cleverscope software resources include:
•Separate, freely moveable and resizable windows to display the signal, a zoomed signal view, and the frequency
spectrum of the signal, and control panel.
oThe zoomed signal view optionally tracks the signal view cursor.
•Spectrum analysis with a variety of conditioning windows and display in log or linear format.
•Each signal window includes a time/amplitude tracer, and two markers for comparison purposes. Colours are user
definable.
•Signal averaging (exponential, block and peak hold) and low pass filtering.
•Full mathematical functions including + - / * sqrt integral differential and filtering.
•Signal measurement, including Peak to Peak, RMS, DC, pulse width, period and frequency.
•Copy and Paste graphic or data to other applications.
•Save and Open from disk.
•User defined units, signal names and scaling (offset and gain).
•Text annotation of each graph.
•Web server for remote viewing of LAN connected unit.
8 Cleverscope CS328A User Manual
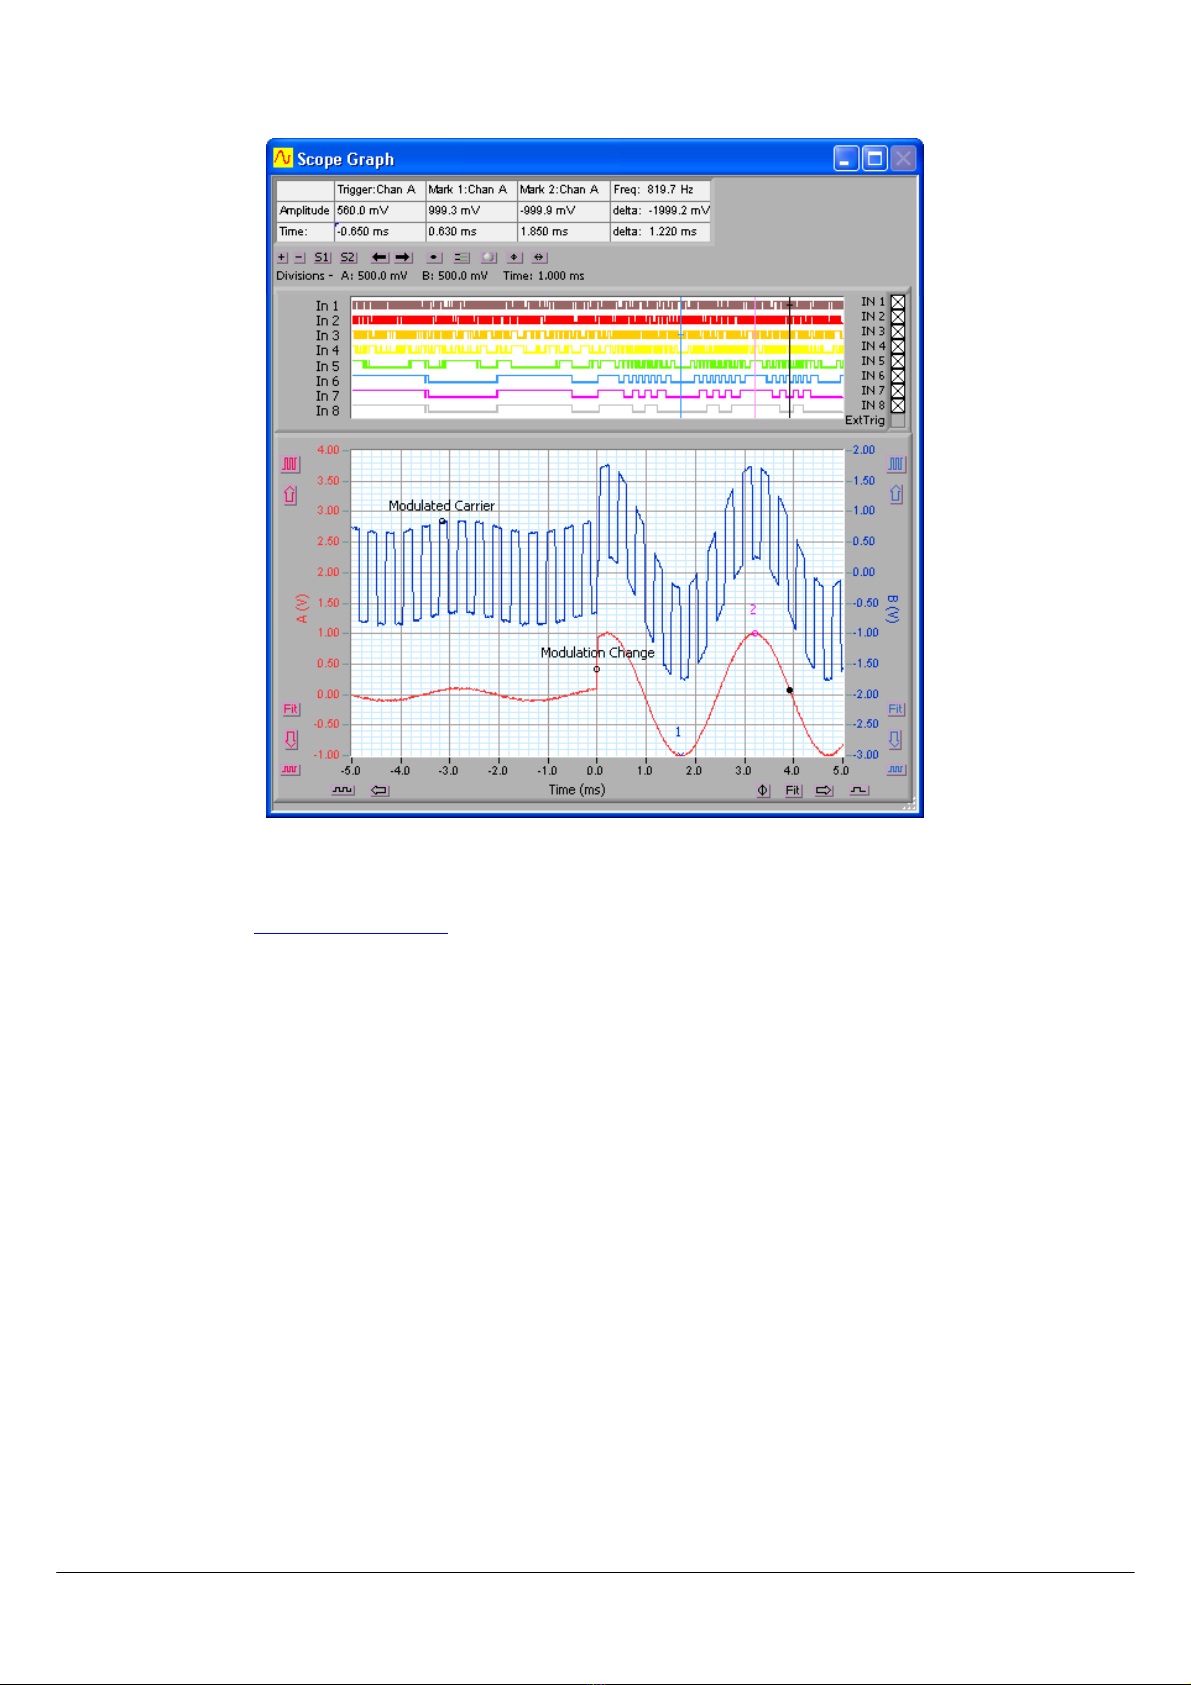
An example of a typical mixed signal window is shown below:
The Cleverscope application is designed to allow the capture, display, storage and analysis of signals on a Windows
compatible PC. The CS300 Cleverscope application is shipped on a CD with every unit and may also be obtained over the
internet by visiting the www.cleverscope.com website.
Minimum requirements are a Pentium PC with at least 256 MB of memory running Windows Vista, Windows XP or
Windows 2000.
Cleverscope CS328A User Manual 9
2 Quick Getting Started Guide
This guide will get you up and running quickly. There are three parts:
•Showing some basics of
basics ofbasics of
basics of using Cleverscope
using Cleverscopeusing Cleverscope
using Cleverscope by compensating the new probes.
•A quick look at how to use the Signal Generator
Signal GeneratorSignal Generator
Signal Generator.
•The keyboard shortcuts
keyboard shortcutskeyboard shortcuts
keyboard shortcuts.
Note
NoteNote
Note If you have not installed the Cleverscope
CleverscopeCleverscope
Cleverscope application software, do this now following the instructions that came with
it.
2.1 Cleverscope Basics and Probe Compensation
2.1.1.1 Connect the Cleverscope Acquisition Unit
On the Cleverscope Acquisition Unit
Cleverscope Acquisition UnitCleverscope Acquisition Unit
Cleverscope Acquisition Unit hardware:
1. Connect the DC power cable
DC power cableDC power cable
DC power cable to
POWER IN
, and plug the power adaptor
power adaptorpower adaptor
power adaptor into the mains. Observe the green power
light.
2. Connect the USB
USBUSB
USB cable
cablecable
cable to
USB
and to the PC.
Note
NoteNote
Note If this is the first time, place the CD in the CD drive, and allow windows to find the drivers. This may take
some time. Accept the non-digitally signed driver. When Windows tells you the hardware is installed, you are ready
to proceed.
2.1.1.2 Acquire a Signal for Display
If you have not installed the Cleverscope
CleverscopeCleverscope
Cleverscope application software, do this now following the instructions that came with it.
Start the Cleverscope
CleverscopeCleverscope
Cleverscope application software.
Go to the Cleverscope Control Panel
Cleverscope Control PanelCleverscope Control Panel
Cleverscope Control Panel window.
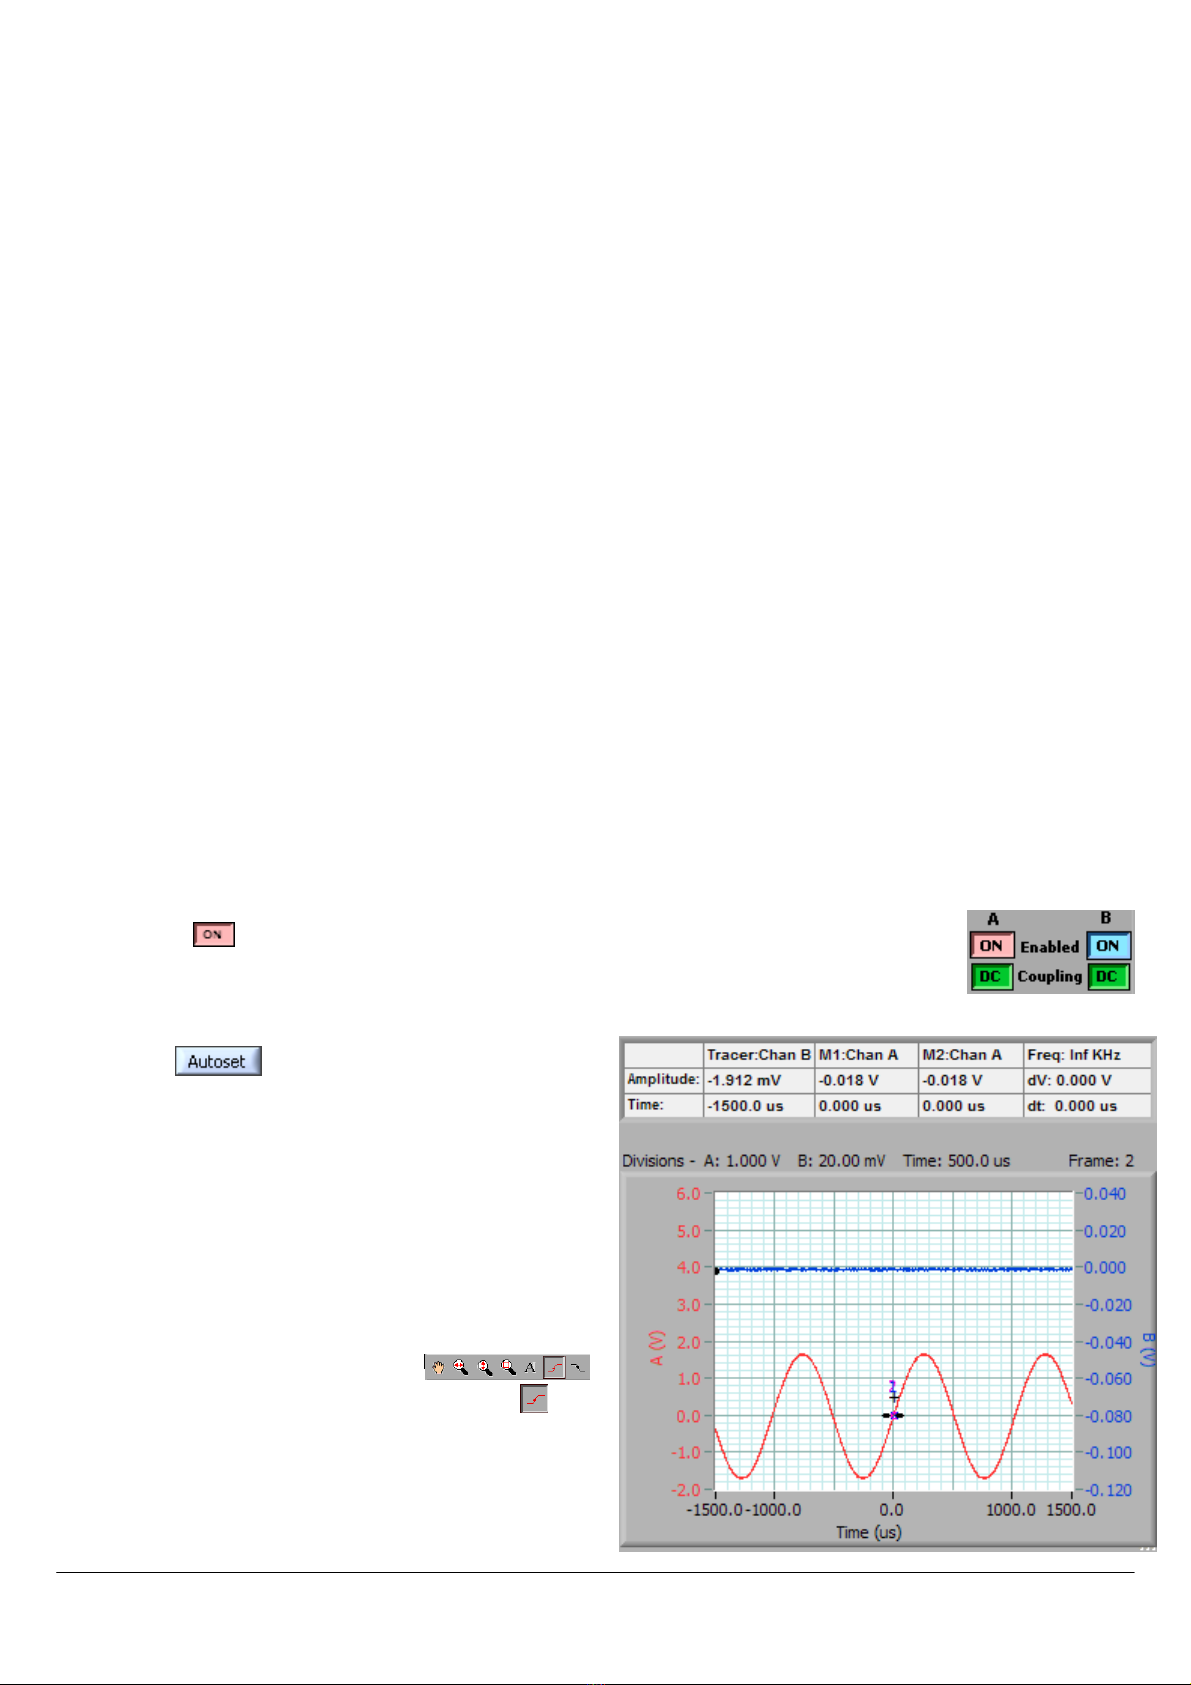
1. Ensure both channel A and B are enabled by clicking on the enable buttons so that they both
display .
2. Connect a signal to Channel A. You could use the Probe Compensation output, or connect the
Signal Generator output from the back of the Cleverscope to Chan A, using the scope probe,
and BNC adaptor (in the little plastic bag), if you have the Signal Generator fitted.
3. Click to automatically scale the Scope Graph
Scope GraphScope Graph
Scope Graph
and set the trigger settings based on the signal you
have connected. You should wind up with something
like this:
The following instructions explain how to set up the
acquisition manually. This helps you fine tune what
Autoset
AutosetAutoset
Autoset has initially selected.
4. In the TRIGGER
TRIGGERTRIGGER
TRIGGER area, use the Source
SourceSource
Source box to select the
trigger source (Chan A
Chan AChan A
Chan A
in this instance).
5. On the special cursor toolbar ( ),
click on the rising edge trigger cursor button ( ).
10 Cleverscope CS328A User Manual
Select the Scope Graph
Scope GraphScope Graph
Scope Graph by either clicking on it or selecting it from the Window
WindowWindow
Window menu.
1. Use the up ( ) and down ( ) vertical display buttons and the vertical expand ( ) and contract
( ) buttons for channel A to size the displayed waveform the way you would like to see it. As
an example you could select 0.50 volts per major horizontal gridline as shown to the right.
2. Position and click the trigger cursor so that trigger amplitude is set to the value you want. You
can also type the trigger value directly into the Level window. Here we have selected 700 mV
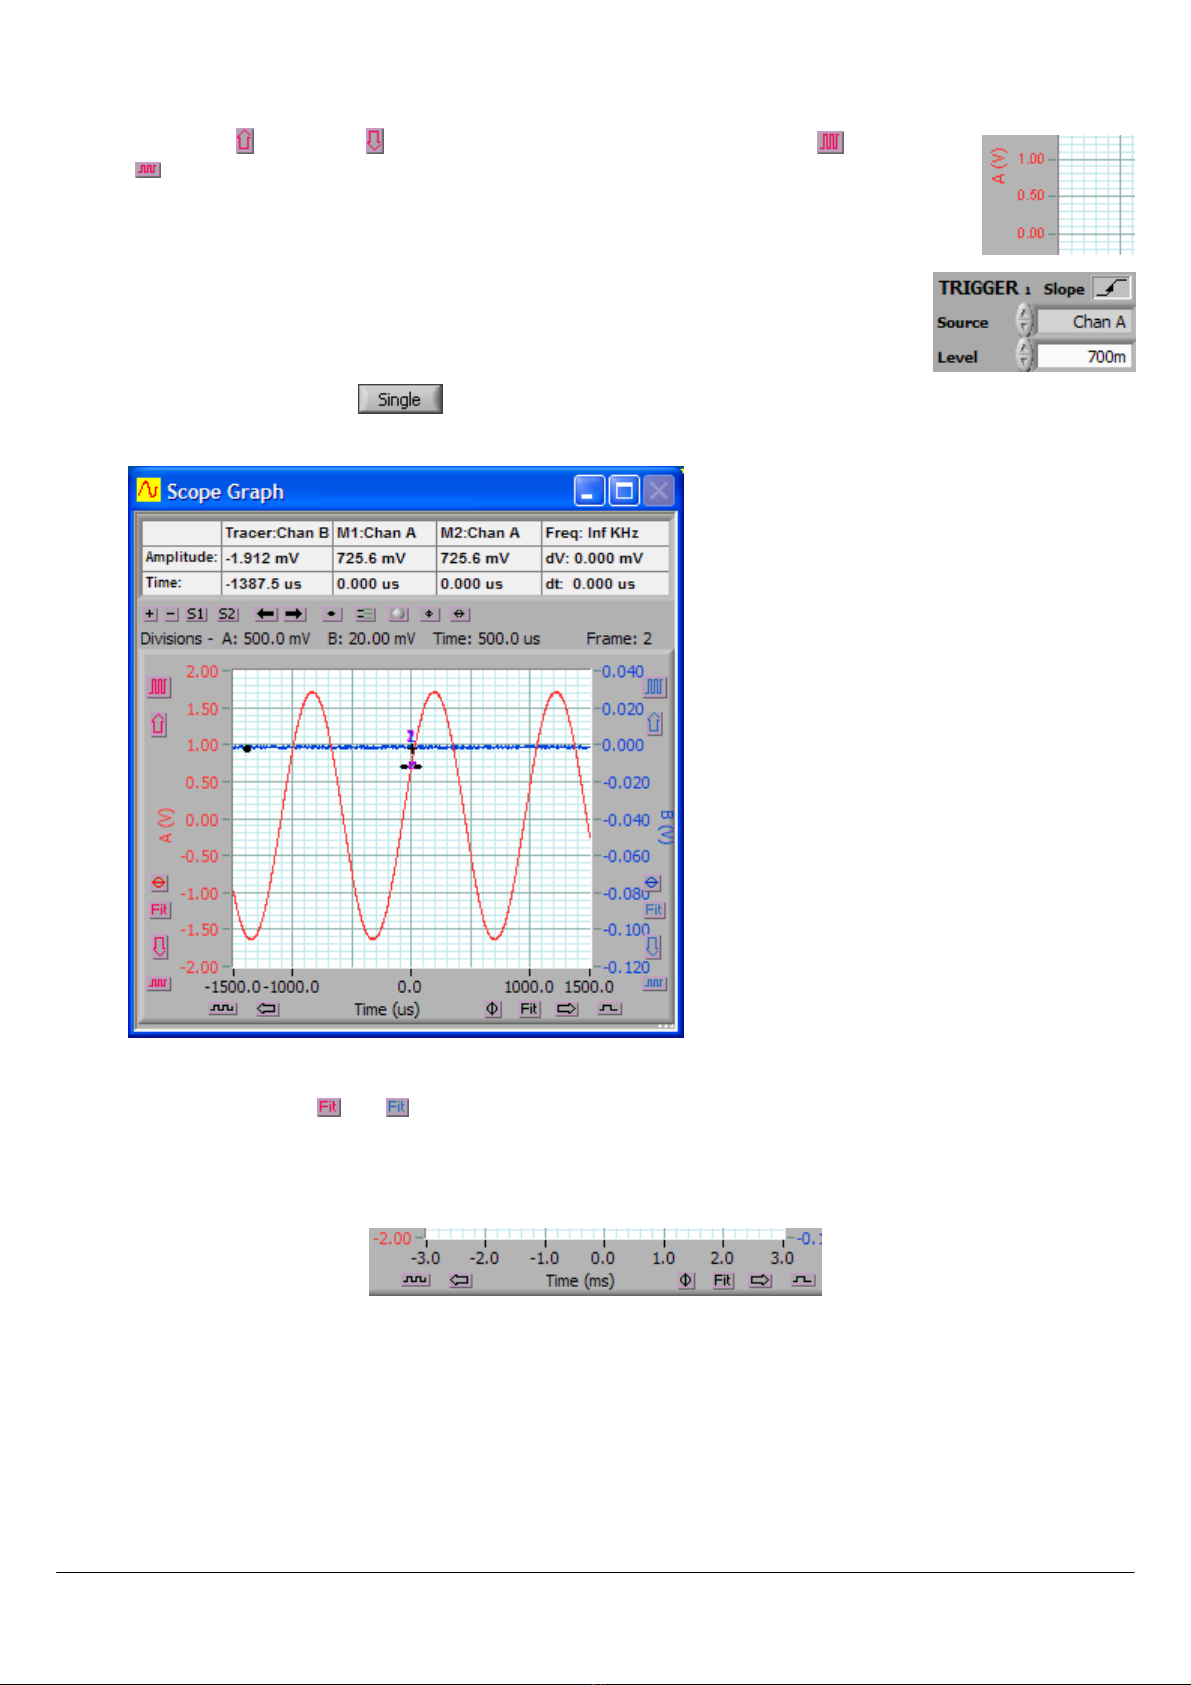
Go to the Cleverscope Control Panel
Cleverscope Control PanelCleverscope Control Panel
Cleverscope Control Panel window.
1. In the AQUIRE
AQUIREAQUIRE
AQUIRE area, click to acquire a single frame of signal data. The Scope Graph
Scope GraphScope Graph
Scope Graph will then display the
acquired signal. Here is the example signal. Note the trigger lines at 700 mV.
2. The auto-fit buttons ( and ) for channel A and B can be used to bring the signal traces into view. Cleverscope
will apply the optimum vertical scaling and positioning for the signal data.
3. For the vertical scale, the positioning and scaling of the signal trace with respect to time can be altered using the
horizontal display buttons.
Note
NoteNote
Note The trigger point is always positioned at time zero on the horizontal axis.

Cleverscope CS328A User Manual 11
2.1.1.3 Acquire the Compensation Signal
Go to the Cleverscope Control Panel
Cleverscope Control PanelCleverscope Control Panel
Cleverscope Control Panel window.
1. In the ACQUIRE
ACQUIREACQUIRE
ACQUIRE area, set the Probe
ProbeProbe
Probe attenuation to
x10
.
2. In the TRIGGER
TRIGGERTRIGGER
TRIGGER area, set the trigger Level
LevelLevel
Level to
1
V.
Select the Scope Graph
Scope GraphScope Graph
Scope Graph window.
1. Set the A channel graph axis to include the voltage range 0 to 4V.
2. Set the time axis to include the range –750 µs to + 750 µs.
3. Plug the scope probe into the A channel, attach the hook probe tip, and ensure the probe switch is set to x10.
Connect the ground crocodile clip to the right hand ground terminal. Connect the probe to the left hand Probe
Comp output terminal.
Go to the Cleverscope Control Panel
Cleverscope Control PanelCleverscope Control Panel
Cleverscope Control Panel window.
1. Click and you should see a graph similar to that shown to the
right.
Note
NoteNote
Note The graph may have either over shoot or slow rise time
.
2. Adjust the small red screw in the body of the
probes BNC connector until the graph is flat. This
compensates the probe capacitance and ensures
flat frequency response.
3. Repeat with the other oscilloscope probe.
Note
NoteNote
Note You may like to do this on B channel, to familiarize yourself with the B channel controls.
12 Cleverscope CS328A User Manual
2.2 How to use the Signal Generator
If you have not already compensated the probes please go to the Cleverscope Basics and
Cleverscope Basics andCleverscope Basics and
Cleverscope Basics and Probe Compensation
Probe CompensationProbe Compensation
Probe Compensation section above
and do this now.
2.2.1.1 Connect the Signal Generator
If the Signal Generator hardware has not been installed in the Cleverscope Acquisition Unit then please install it now
following the instructions that came with it.
On the Cleverscope Acquisition Unit
Cleverscope Acquisition UnitCleverscope Acquisition Unit
Cleverscope Acquisition Unit hardware:
1. Connect one end of a BNC
BNCBNC
BNC-
--
-BNC cable
BNC cableBNC cable
BNC cable to SIG GEN
SIG GENSIG GEN
SIG GEN at the back.
2. Connect the other end of the cable to CHAN A
CHAN ACHAN A
CHAN A at the front. This will allow observation of the signal being generated
on the Scope Graph
Scope GraphScope Graph
Scope Graph.
2.2.1.2 Setup a Signal Generator output
Start the Cleverscope application software.
Go to the Cleverscope Control Panel
Cleverscope Control PanelCleverscope Control Panel
Cleverscope Control Panel window.
1. Click View
ViewView
View and select Display Sig Gen Controls
Display Sig Gen ControlsDisplay Sig Gen Controls
Display Sig Gen Controls.
Go to the S
SS
Signal Generator Control
ignal Generator Controlignal Generator Control
ignal Generator Control window.
1. Set Amplitude
AmplitudeAmplitude
Amplitude to
2
V, set Offset
OffsetOffset
Offset to
0
V, and set Waveform
WaveformWaveform
Waveform t
tt
type
ypeype
ype to s
ine
.
2. Set Sweep Method
Sweep MethodSweep Method
Sweep Method to
Single Freq
.
3. Set Base Frequency
Base FrequencyBase Frequency
Base Frequency to
1k
Hz, set Adjust
AdjustAdjust
Adjust to
0.1
, and set Freq Range
Freq RangeFreq Range
Freq Range to
20k
Hz so
that the Output Frequency
Output FrequencyOutput Frequency
Output Frequency equals
3k
Hz.
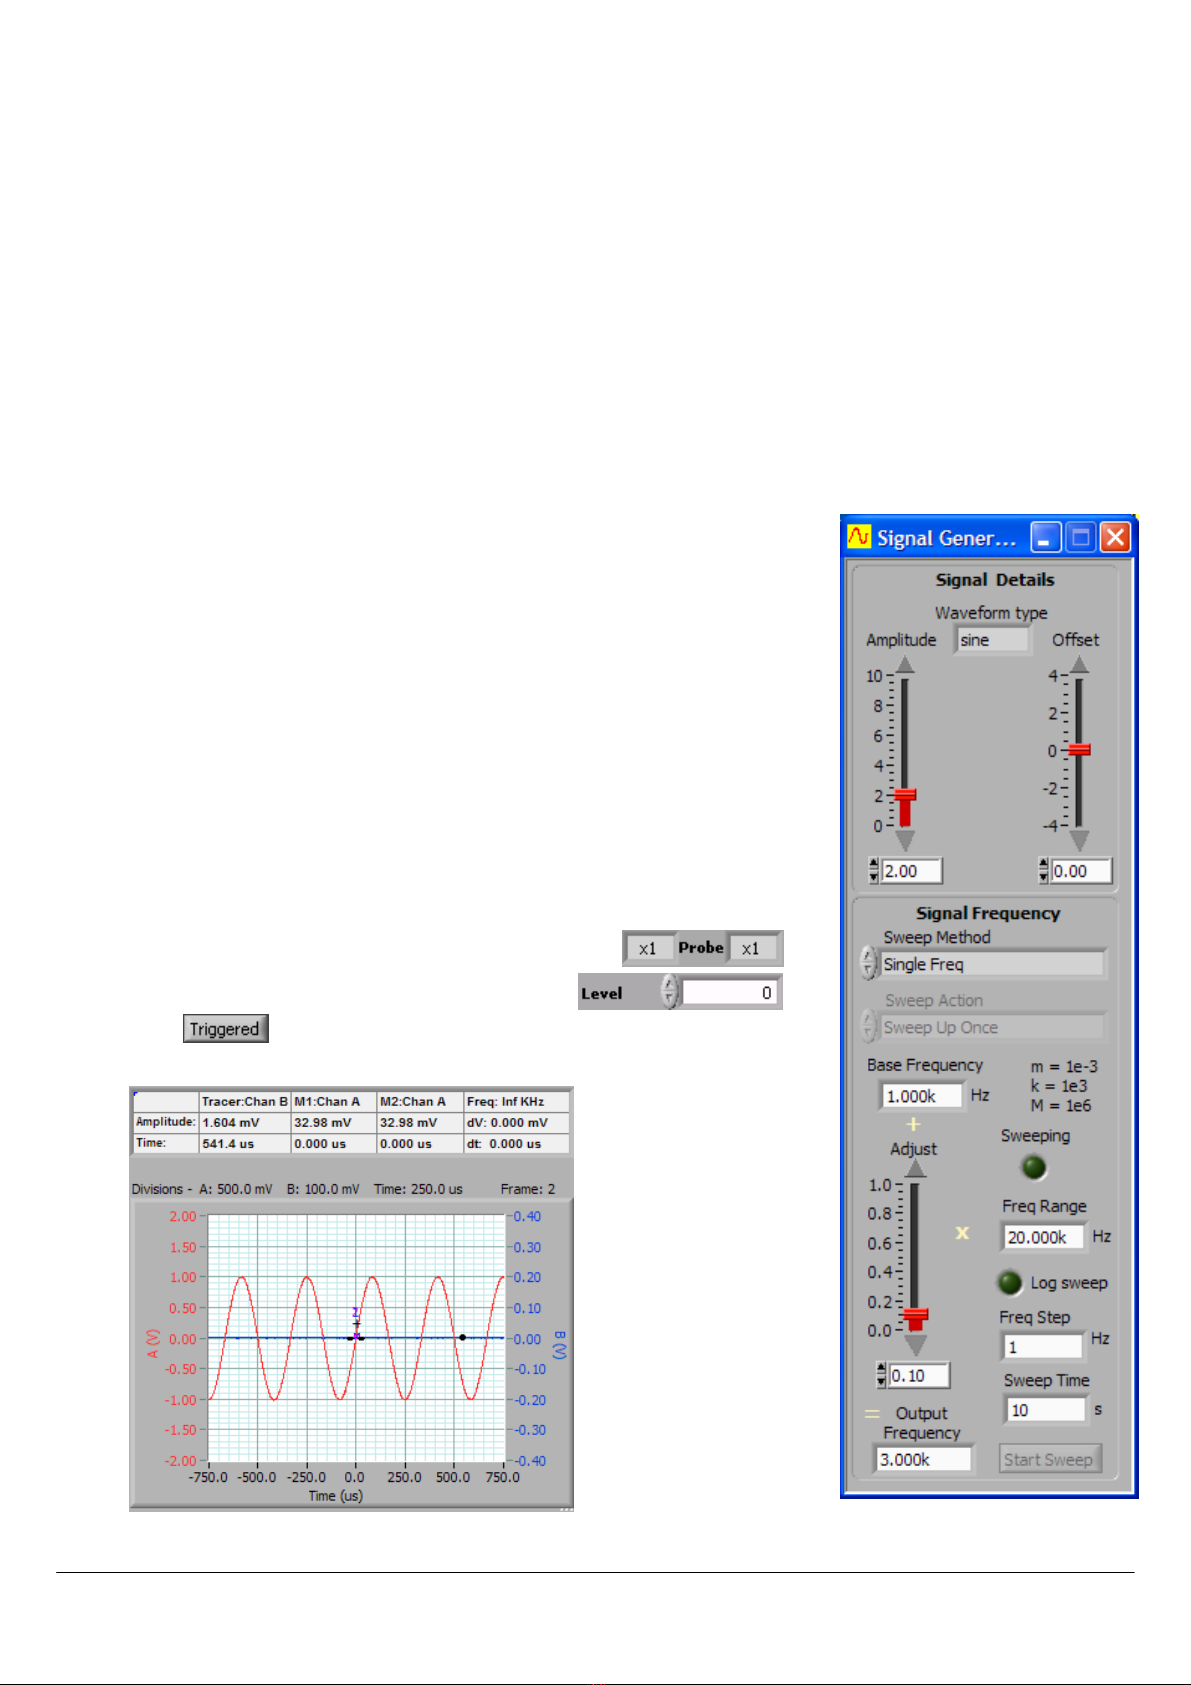
2.2.1.3 Acquire the Signal Generator output
Go to the Cleverscope Control Panel
Cleverscope Control PanelCleverscope Control Panel
Cleverscope Control Panel window.
1. In the ACQUIRE
ACQUIREACQUIRE
ACQUIRE area, set the Probe
ProbeProbe
Probe attenuation to
x1
.
2. In the TRIGGER
TRIGGERTRIGGER
TRIGGER area, set the trigger Level
LevelLevel
Level to
0
V.
3. Click and you should see a graph
similar to that shown to the below.

Cleverscope CS328A User Manual 13
2.3 Keyboard Shortcuts
Movement:
Movement:Movement:
Movement:
and
move the cursor left and right
Shift
ShiftShift
Shift +
and
move the graph left and right
Ctrl
CtrlCtrl
Ctrl +
and
change the x-scale up or down
and
move the selected graph up and down
Shift
ShiftShift
Shift +
and
move the selected graph up and down
Ctrl
CtrlCtrl
Ctrl +
and
change the y-scale up and down
Markers:
Markers:Markers:
Markers:
1
11
1 and 2
22
2 set markers one and two
Spacebar
SpacebarSpacebar
Spacebar sets the next marker
Graph Viewing:
Graph Viewing:Graph Viewing:
Graph Viewing:
Tab
TabTab
Tab swaps channels
A
AA
A autoscales the graphs
PageDown
PageDownPageDown
PageDown zooms in on the tracer
PageUp
PageUpPageUp
PageUp zooms out on the tracer
L
LL
L locks the tracking graph position on the current scope graph tracer position
F10
F10F10
F10 automatically sets the graph scales and trigger settings
Control:
Control:Control:
Control:
C
CC
C or Ctrl
CtrlCtrl
Ctrl + C
CC
C copies the graph to the clipboard
X
XX
X or Ctrl
CtrlCtrl
Ctrl + X
XX
X clears the graph
P
PP
P or Ctrl
CtrlCtrl
Ctrl + P
PP
P prints the graph
F1
F1F1
F1 chooses the Pan/Tracer cursor
F2
F2F2
F2 chooses the Annotation cursor
F3
F3F3
F3 chooses the Rising Trigger cursor
F4
F4F4
F4 chooses the Falling Trigger cursor
Sampling:
Sampling:Sampling:
Sampling:
F7
F7F7
F7 initiates a single acquisition
F8
F8F8
F8 initiates automatic acquisition
F9
F9F9
F9 initiates triggered acquisition
Mouse Wheel:
Mouse Wheel:Mouse Wheel:
Mouse Wheel:
The mouse wheel acts as a virtual knob on whatever control was last selected. So if you select the Chan A Contract
button, and then use the Mouse Wheel, the wheel acts as a virtual knob on the Channel A Volts/div.

14 Cleverscope CS328A User Manual
3 Cleverscope Navigation and Control
The Cleverscope application uses a Control Panel
Control PanelControl Panel
Control Panel to setup and control signal acquisition. It uses display windows to show
alternative but simultaneous views of signal and spectrum data. It also has additional windows that control the way the signal
data is process and displayed as well as control of the optional Signal Generator
Signal GeneratorSignal Generator
Signal Generator.
The windows that can be displayed are:
Cleverscope Control Panel
Cleverscope Control PanelCleverscope Control Panel
Cleverscope Control Panel
controls, cursors, pull-down
menus
Signal Information Window
Signal Information WindowSignal Information Window
Signal Information Window
displays signal statistics
Scope Graph
Scope GraphScope Graph
Scope Graph
main signal display window
Spectrum Graph
Spectrum GraphSpectrum Graph
Spectrum Graph
displays the signal spectrum
Tracking Graph
Tracking GraphTracking Graph
Tracking Graph
used with the Scope Graph for a
close-up view
XY Graph
XY GraphXY Graph
XY Graph
displays an XY plot of Chan A
against Chan B
Note
NoteNote
Note You can individually size and position each window to optimize the ease of use and view-ability of signal and
spectrum data.

Cleverscope CS328A User Manual 15
Maths Graph
Maths GraphMaths Graph
Maths Graph
displays Maths Equation Builder
results
Notes
NotesNotes
Notes
accompanying notes can be added
Maths Equation Builder
Maths Equation BuilderMaths Equation Builder
Maths Equation Builder
builds equations to process signals
Signal Generator Simulator
Signal Generator SimulatorSignal Generator Simulator
Signal Generator Simulator
virtual built-in signal generator controls
Signal Generator Control
Signal Generator ControlSignal Generator Control
Signal Generator Control
signal generator output controls

16 Cleverscope CS328A User Manual
Only the Cleverscope Control Panel
Cleverscope Control PanelCleverscope Control Panel
Cleverscope Control Panel has pull down menus as shown below:
File Menu
File MenuFile Menu
File Menu
open and save signal data, printing
Edit Menu
Edit MenuEdit Menu
Edit Menu
copying and clearing graphs
Settings Menu
Settings MenuSettings Menu
Settings Menu
set-up and options
Window Menu
Window MenuWindow Menu
Window Menu
for selecting the active window
View Menu
View MenuView Menu
View Menu
selects which windows are displayed
Help Menu
Help MenuHelp Menu
Help Menu
keyboard shortcuts, license and version
info

Cleverscope CS328A User Manual 17
3.1 Keyboard Shortcuts
As well as using the mouse to navigate and control Cleverscope there are a number of keyboard shortcuts that can be used
to save time and improve ergonomics. These are described below:
Movement:
Movement:Movement:
Movement:
and
move the cursor left and right
Shift
ShiftShift
Shift +
and
move the graph left and right
Ctrl
CtrlCtrl
Ctrl +
and
change the x-scale up or down
and
move the selected graph up and down
Shift
ShiftShift
Shift +
and
move the selected graph up and down
Ctrl
CtrlCtrl
Ctrl +
and
change the y-scale up and down
Markers:
Markers:Markers:
Markers:
1
11
1 and 2
22
2 set markers one and two
Spacebar
SpacebarSpacebar
Spacebar sets the next marker
Graph Viewing:
Graph Viewing:Graph Viewing:
Graph Viewing:
Tab
TabTab
Tab swaps channels
A
AA
A autoscales the graphs
PageDown
PageDownPageDown
PageDown zooms in on the tracer
PageUp
PageUpPageUp
PageUp zooms out on the tracer
L
LL
L locks the tracking graph position on the current scope graph tracer position
F10
F10F10
F10 automatically sets the graph scales and trigger settings
Control:
Control:Control:
Control:
C
CC
C or Ctrl
CtrlCtrl
Ctrl + C
CC
C copies the graph to the clipboard
X
XX
X or Ctrl
CtrlCtrl
Ctrl + X
XX
X clears the graph
P
PP
P or Ctrl
CtrlCtrl
Ctrl + P
PP
P prints the graph
F1
F1F1
F1 chooses the Pan/Tracer cursor
F2
F2F2
F2 chooses the Annotation cursor
F3
F3F3
F3 chooses the Rising Trigger cursor
F4
F4F4
F4 chooses the Falling Trigger cursor
Sampling:
Sampling:Sampling:
Sampling:
F7
F7F7
F7 initiates a single acquisition
F8
F8F8
F8 initiates automatic acquisition
F9
F9F9
F9 initiates triggered acquisition
Mouse Wheel:
Mouse Wheel:Mouse Wheel:
Mouse Wheel:
The mouse wheel acts as a virtual knob on whatever control was last selected. So if you select the Chan A Contract
button, and then use the Mouse Wheel, the wheel acts as a virtual knob on the Channel A Volts/div.
18 Cleverscope CS328A User Manual
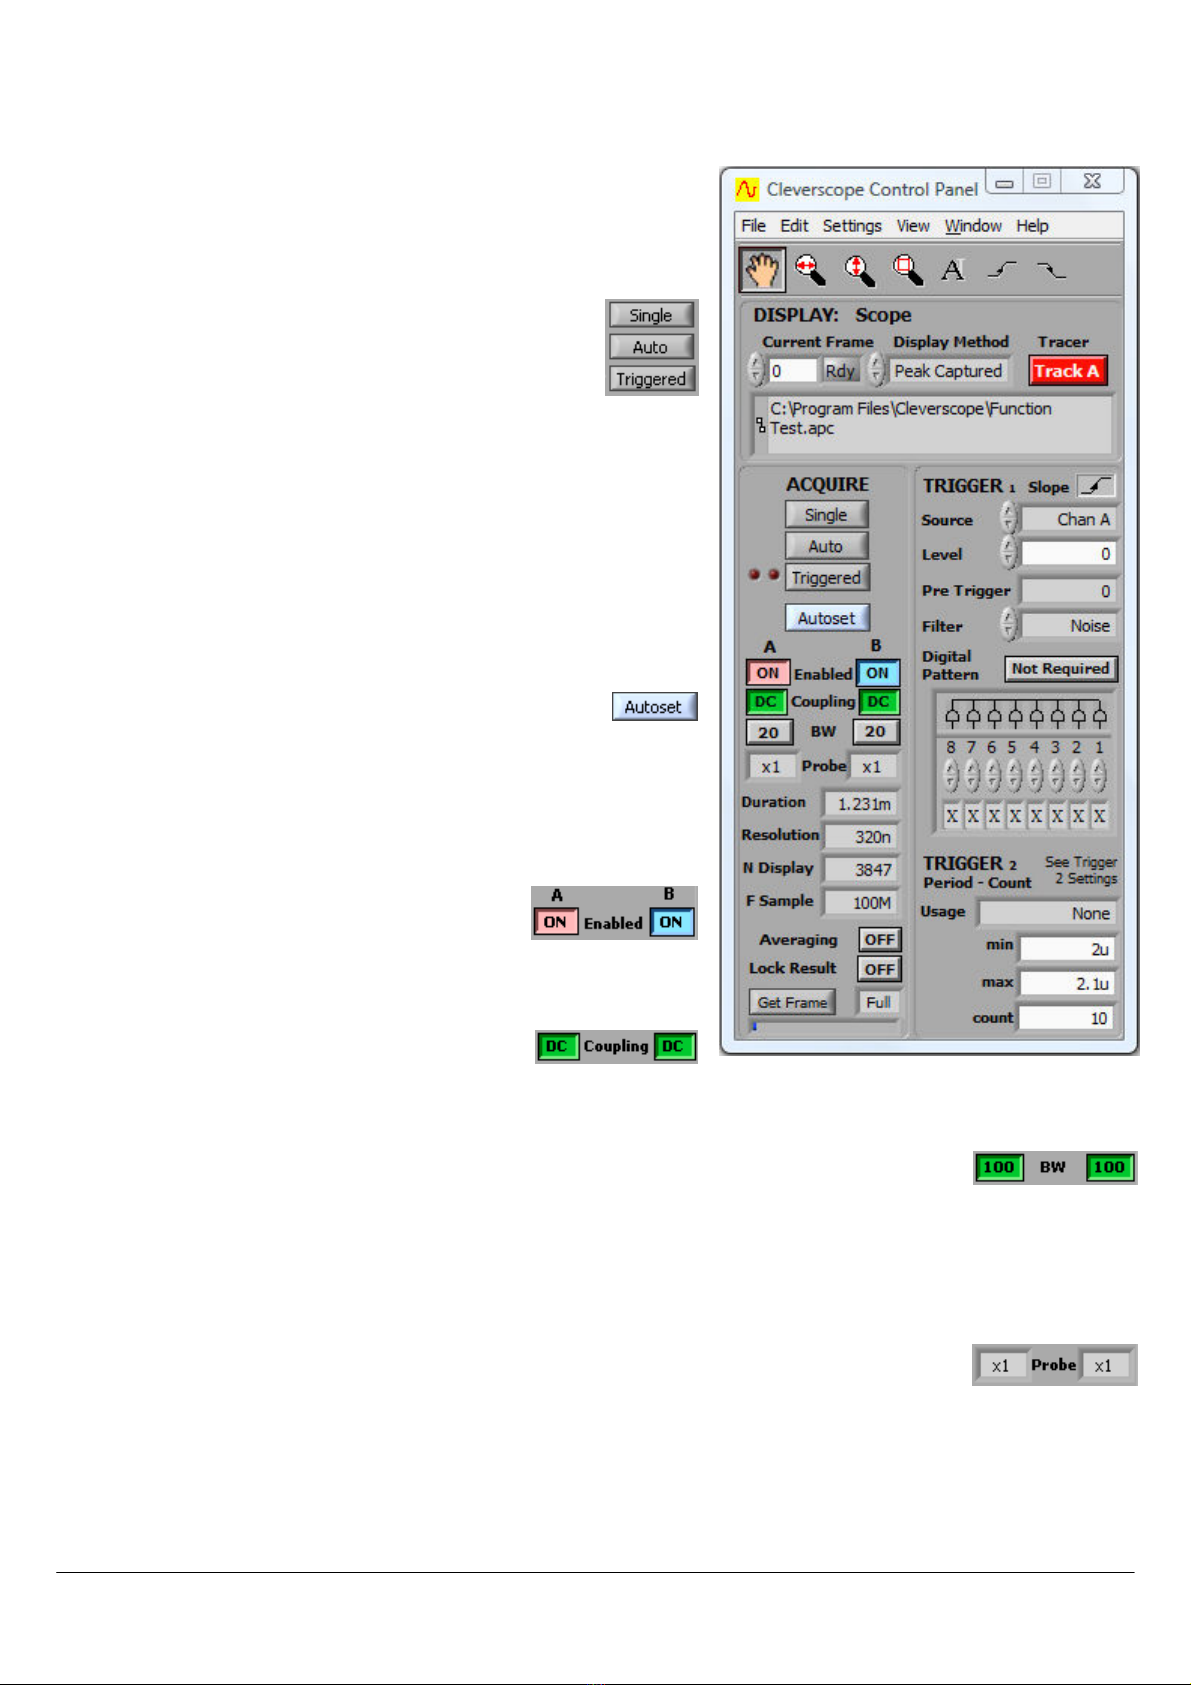
4 Cleverscope Control Panel
The Cleverscope Control Panel
Cleverscope Control PanelCleverscope Control Panel
Cleverscope Control Panel contains all of the controls and menu items
for capturing, and saving signal data.
4.1 Signal Acquiring
Use the AQUIRE
AQUIREAQUIRE
AQUIRE button controls to start and stop signal
capture in the following three different modes:
Single
SingleSingle
Single is a single shot, based on the trigger condition being
met. This is for capturing a single frame positioned around a
trigger point.
A
AA
Auto
utouto
uto free-runs (unless there is a trigger), this is for free running un-
triggered signal capture.
Triggered
TriggeredTriggered
Triggered is just like single, expect that following a trigger and display,
sampling for a trigger is automatically restarted. This is for capturing
repetitive waveforms positioned around a constant trigger point.
4.1.1 Autoset
The Autoset
AutosetAutoset
Autoset button automatically sets the graph scales and
trigger settings. It places Chan A in the bottom half and Chan
B in the top half of the graph and shows 3 cycles of the signal in the
Scope Graph
Scope GraphScope Graph
Scope Graph and 2 cycle in the Tracking Graph
Tracking GraphTracking Graph
Tracking Graph. This is an easy way to
view a new set of signals.
4.1.2 Channel Enabling
The channel Enabled
EnabledEnabled
Enabled buttons turns each channel on
or off.
4.1.3 AC/DC Coupling
The AC/DC Coupling
CouplingCoupling
Coupling buttons set each channels
coupling to either AC or DC coupled.
4.1.4 Anti-aliasing Filter Bandwidth
The BW
BWBW
BW buttons set each channels bandwidth to either 20 MHz or 100 MHz. The Cleverscope
CleverscopeCleverscope
Cleverscope
Acquisition Unit
Acquisition UnitAcquisition Unit
Acquisition Unit employs 5th order low pass anti-aliasing filters on each channel to prevent high
frequency out of band signals from aliasing back into the displayed signal graph. The unit samples simultaneously for both
channels at 100 M samples/s and the corner frequency of the anti-aliasing filters can be selected to be either 20 MHz or 100
MHz.
4.1.5 Probe Attenuation
The Probe
ProbeProbe
Probe attenuation for each channel can be set to x1
x1x1
x1, x10
x10x10
x10, x100
x100x100
x100, x1k
x1kx1k
x1k, x20
x20x20
x20, x50
x50x50
x50 or x200
x200x200
x200 to match the
attenuation switch settings of the connected probe. Click on the x1 text to see the drop down menu.

Cleverscope CS328A User Manual 19
4.1.6 Duration, Resolution, N Display and F Sample
The sampling Duration
DurationDuration
Duration is the length of time for which a continuous sequence of samples is
available for display. The time Resolution
ResolutionResolution
Resolution is the minimum time between samples available for
display.
Duration
DurationDuration
Duration and the Resolution
ResolutionResolution
Resolution are updated after an acquisition has been started using the
Single
SingleSingle
Single, Auto
AutoAuto
Auto or Triggered
TriggeredTriggered
Triggered buttons. The Duration
DurationDuration
Duration is at least equal to the time width of the
Scope Graph
Scope GraphScope Graph
Scope Graph, but may be longer to make best use of the sample buffer. The Resolution
ResolutionResolution
Resolution is set
by the number of samples available in each frame. A total of 4 or 8 million samples divided by
the number of sample frames are available. Reducing the number of sample frames increases
the number of samples available, and so will increase the time resolution. Here the sampling
duration is 8.158 ms, with a time resolution of 10ns per sample.
N Display
N DisplayN Display
N Display shows the number of samples on the display and the number of samples that would
be saved if you did a ‘File/Save As..’.
F Sample
F SampleF Sample
F Sample shows the sample frequency in Hertz. The example shows 100MHz. If you use an
external sample clock this will be different.
4.1.7 Averaging
The Averaging
AveragingAveraging
Averaging button turns averaging on and off. Averaging
AveragingAveraging
Averaging arithmetically averages a
number of signal frames together in the PC to reduce the effect of noise, or to see the long-
term value of a varying signal.
On the Settings
SettingsSettings
Settings menu, clicking Averaging
AveragingAveraging
Averaging allows control of both PC based averaging with
Weighting mode
Weighting modeWeighting mode
Weighting mode and Number of averages
Number of averagesNumber of averages
Number of averages, and acquisition based averaging with Acquisition
AcquisitionAcquisition
Acquisition
averages
averagesaverages
averages. See the Methods for Displaying Signals
Methods for Displaying SignalsMethods for Displaying Signals
Methods for Displaying Signals section below for acquisition averaging
using the Waveform avg
Waveform avgWaveform avg
Waveform avg display method.
Weighting mode
Weighting modeWeighting mode
Weighting mode allows you to select one of three types of averaging: Linear
LinearLinear
Linear, Exponential
ExponentialExponential
Exponential and Peak
PeakPeak
Peak. This is used in
conjunction with Number of averages
Number of averagesNumber of averages
Number of averages as explained below.
Linear
LinearLinear
Linear averaging applies equal weighting over a number of signal frames, processing the number of frames chosen in
Number of averages
Number of averagesNumber of averages
Number of averages before presenting the result.
Exponential
ExponentialExponential
Exponential averaging provides a moving average where a greater weighting is applied to more recently acquired frames
than older frames. The averaged frame is displayed after every acquisition. Each new frame is scaled prior to being added
to the aggregated past signal. The scaling is determined by the Number of averages
Number of averagesNumber of averages
Number of averages. A large number results in a small
proportion of the new signal contributing to the average.
Peak
PeakPeak
Peak averaging is used to accumulate maximum frequency points from the spectra of a number of frames and is therefore
only applied to data displayed in the spectrum graph. It may be used to generate a frequency response graph (Gain/Phase
plot).
Because noise is random, and has an average value of 0, averaging will reduce the effective amplitude of the noise in each
time sample. The amount of reduction is dependant on Number
NumberNumber
Number of averages
of averagesof averages
of averages – making this number larger, will reduce the
noise more, but it will take longer to settle the signal being measured.
On the Settings
SettingsSettings
Settings menu, click Reset Average
Reset AverageReset Average
Reset Average (or Ctrl + R) to reset the average to 0.
20 Cleverscope CS328A User Manual
4.1.8 Lock Result
When Lock Result
Lock ResultLock Result
Lock Result is turned on, it inhibits updates from the sampler. This is especially useful
when using Maths and you want to zoom in on the result on the Tracking Graph
Tracking GraphTracking Graph
Tracking Graph without the
Maths being re-applied.
4.1.9 Get Frame Buffer
Get Frame
Get FrameGet Frame
Get Frame gets the specified size of the frame buffer. The size of the frame buffer can be
Full
,
50%
,
10%
,
5%
,
2%
or
Seq
. Click on the ‘Full’ text to display a drop down menu list.
This can be particularly useful when saving data where you still want to be able to zoom in
and out with full resolution of the signal data.
4.2 Display Controls
Controls related to signal data storage and display are located in the DISPLAY
DISPLAYDISPLAY
DISPLAY area.
The Cleverscope acquisition unit is able to hold a number of sequential frames so that a
history of older frames can be recalled.
Following an acquisition the Current
CurrentCurrent
Current Frame
FrameFrame
Frame number represents the latest frame acquired. To
display an earlier frame, click on the down control, or type a number directly into Current
CurrentCurrent
Current
Frame
FrameFrame
Frame. The graphs will update to display the signal in the frame selected. Current
CurrentCurrent
Current Frame
FrameFrame
Frame ‘1’ is
always the oldest frame, the higher the number, the more recent the frame. The maximum is
set on the Settings
SettingsSettings
Settings menu, clicking Acquisition
AcquisitionAcquisition
Acquisition settings
settingssettings
settings and setting the Number of Frames
Number of FramesNumber of Frames
Number of Frames. The
4 Million samples available in the Cleverscope acquisition unit are divided between the
Number of Frames
Number of FramesNumber of Frames
Number of Frames allocated.
The Tracer
TracerTracer
Tracer buttons lets you select which channel the tracer will apply to. The tracer is a small
black circle that can be moved along the A or B channel signal trace by selecting a display
graph (Scope, Spectrum, Tracking, etc) and simply moving the mouse left or right.
As the tracer is moved along a signal (or spectrum) its position in both amplitude and time (or
frequency) is displayed in the Information
InformationInformation
Information area at the top of the display graph. The tracer
assists the accurate positioning of markers which enable points of interest to be tagged and
calculations on selected segments of signal data to be undertaken. See also the section on
Scope Graph
Scope GraphScope Graph
Scope Graph below for a description on the use of the tracer and markers.
Cleverscope lets you save signal data as either a Cleverscope, text or binary file. On the
File
FileFile
File menu, click either Save As
Save AsSave As
Save As, Save Graph as Text
Save Graph as TextSave Graph as Text
Save Graph as Text, Save Graph as Binary
, Save Graph as Binary, Save Graph as Binary
, Save Graph as Binary or Save
SaveSave
Save to do
this. The file path for the last stored file is displayed in the path display box.
Table of contents
Other Cleverscope Test Equipment manuals


Popular Test Equipment manuals by other brands


Agilent Technologies
Agilent Technologies InfiniiVision 7000B Series datasheet

THERMTRONIX
THERMTRONIX RATS 401 Instructions/service manual

IET Labs
IET Labs 1986 Omnical User and service manual

Chauvin Arnoux
Chauvin Arnoux CA 6161 user manual

Laversab
Laversab ARTS 7000 user manual

Emerson
Emerson Rosemount 5900 Instruction for Installation, Configuration, and Operation