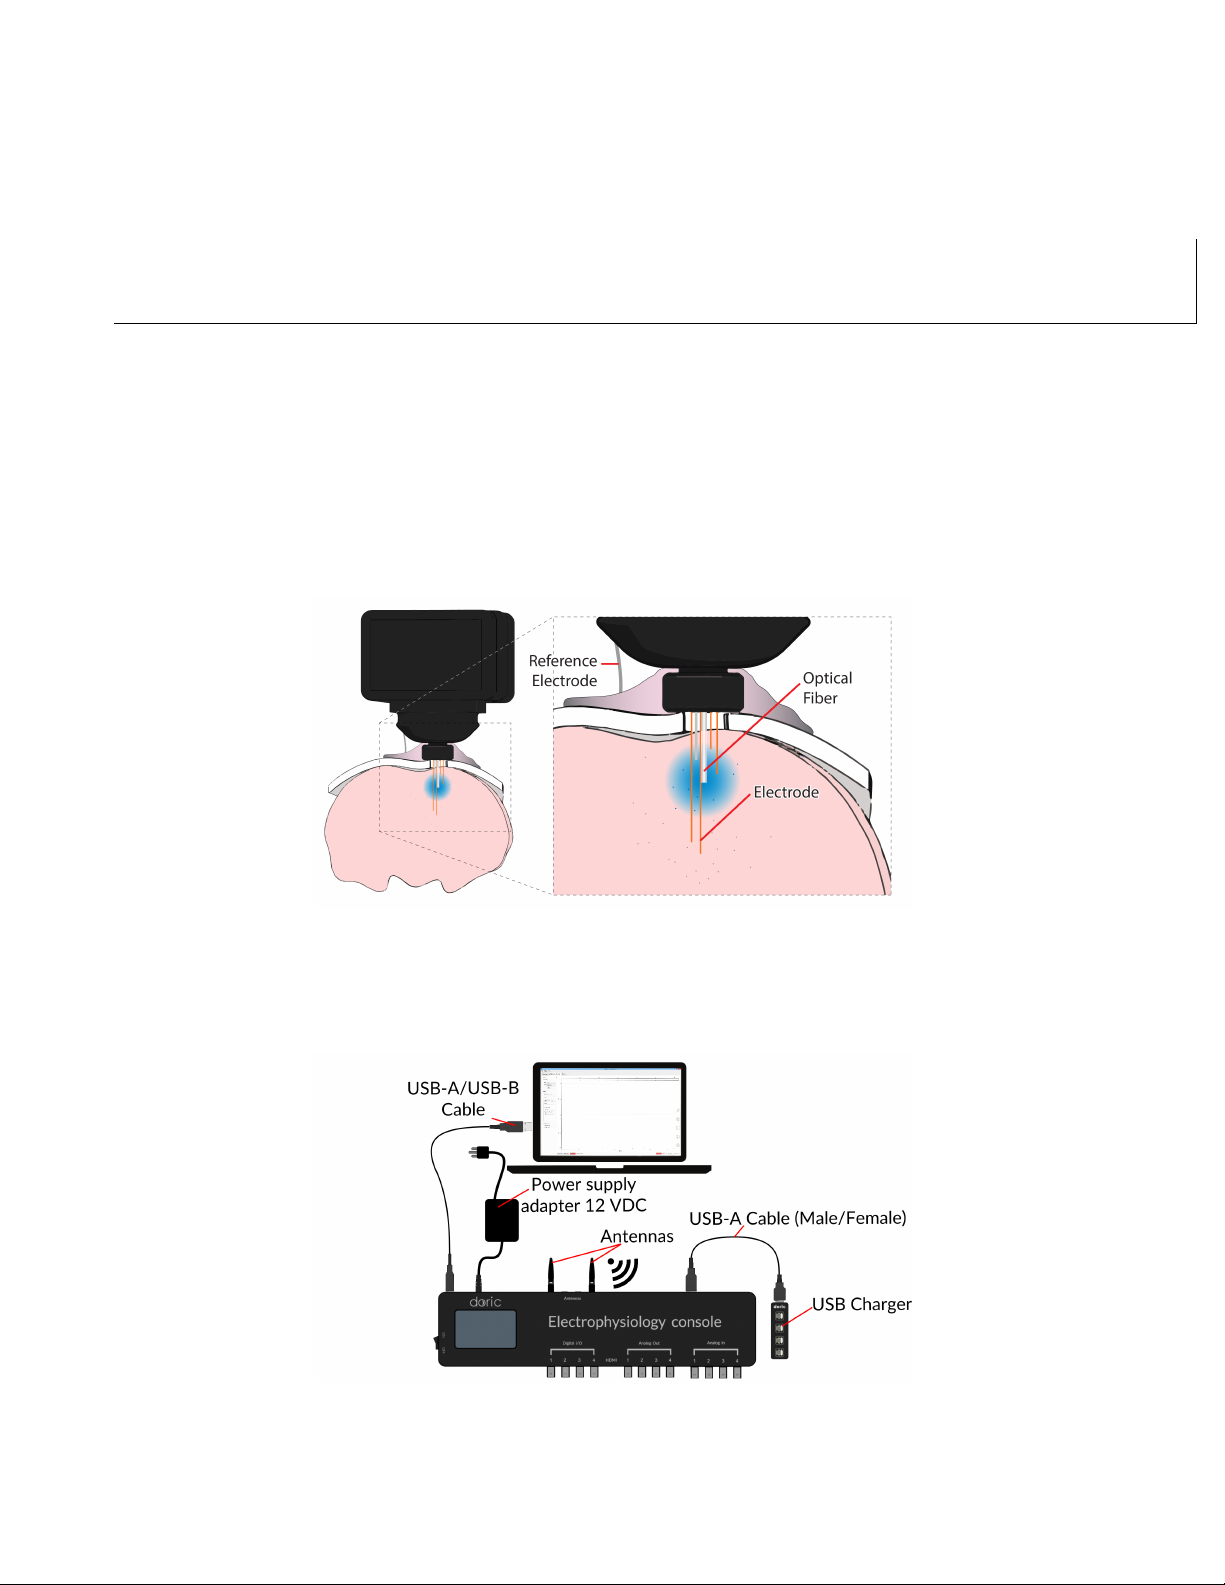
2. Connect the console to the 12 VDC power supply and turn the console ON.THIS MUST BE DONE BEFORE
CONNECTING THE CONSOLE TO THE COMPUTER.
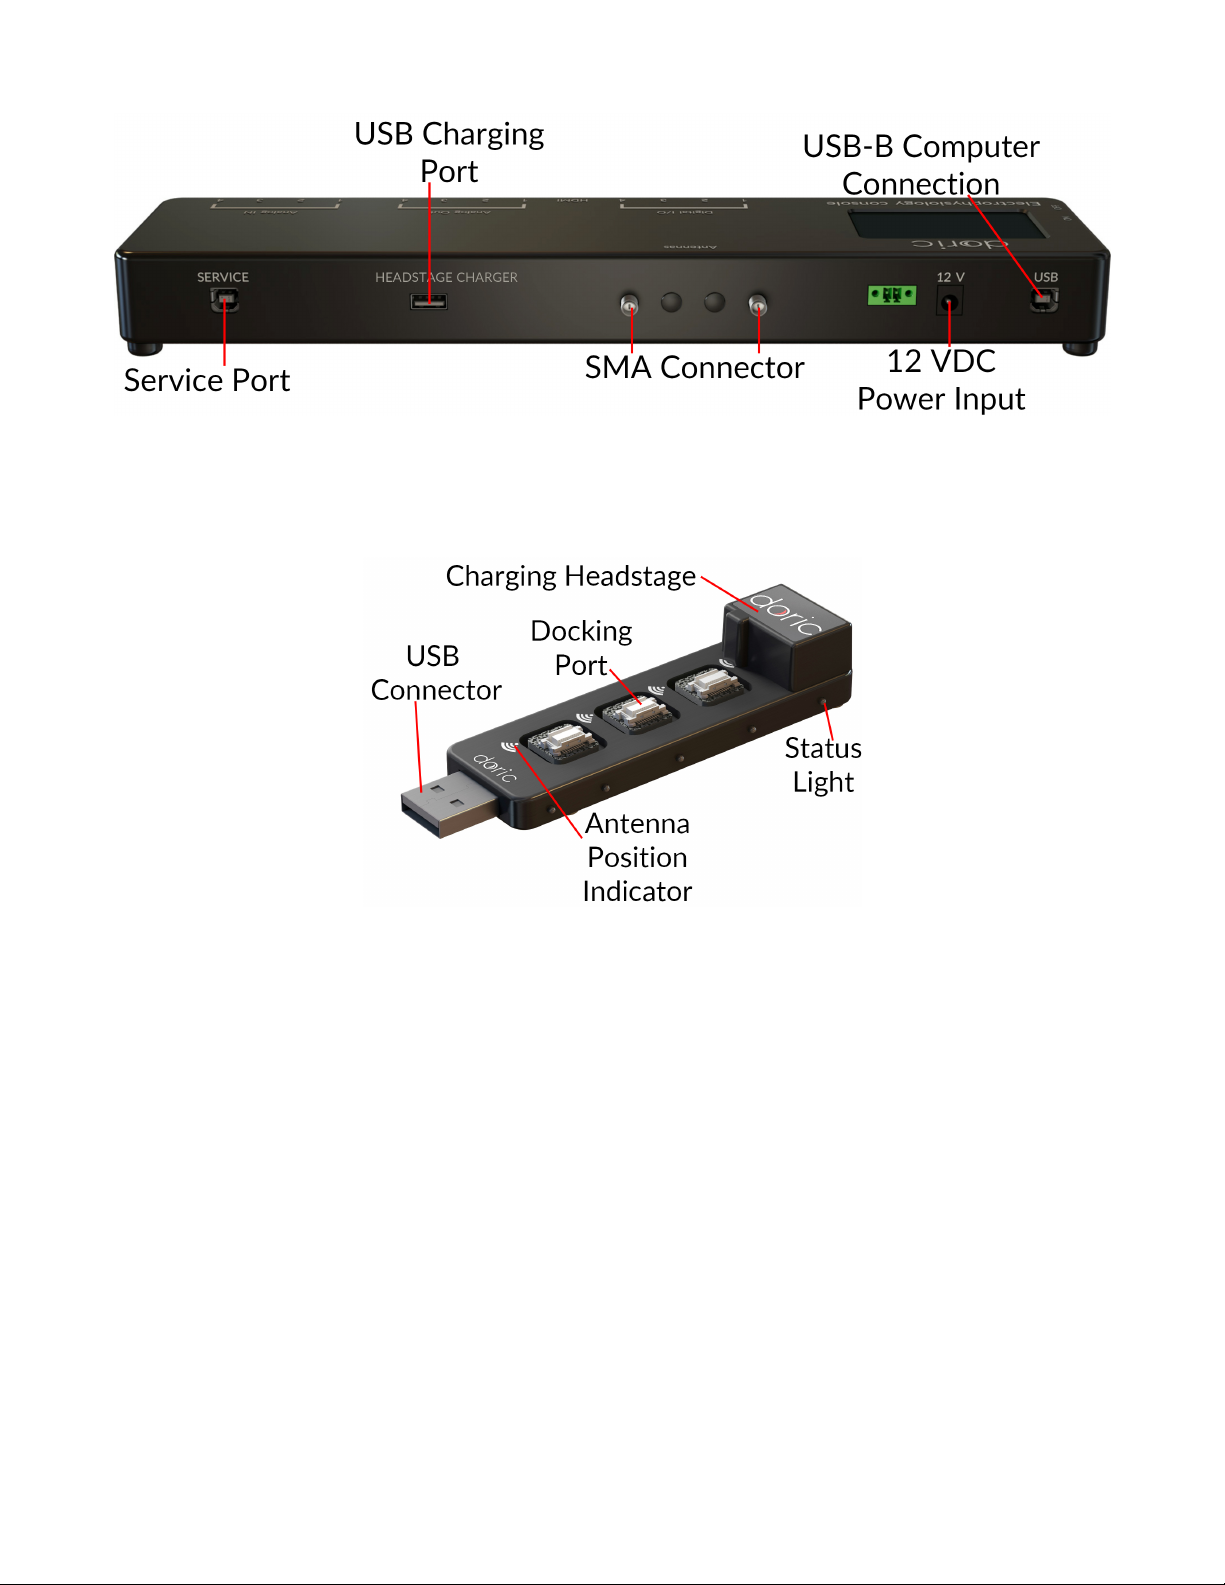
3. Connect the Fi-Wi Headstage Charger to the USB Docking Port using the USB-A (male/female) cable. Install the
headstage(s) onto the charging port.
4. Connect the console to the computer using the USB-A/USB-B Cable.
5. When the console is OFF, disconnect the USB-A/USB-B Cable before turning it back ON. Once the console is ON,
reconnect the cable.
2.1.2 Software setup
The following section details how to set up a measurement sequence using Doric Neuroscience Studio. Further detail for
each software feature is found in section 3.
Figure 2.3: Antenna Channel Configuration
1. With the console properly connected, open the Doric Neuroscience Studio. Once open, the electrophysiology con-
sole tab (Fig. 2.3) will appear. Select the Configuration tab in the Control & Settings box, then select the Add
configuration button to open the Channel configuration window.
2. In the Channel configuration window (Fig. 2.4), there are 2 Antenna channels available. When one is selected,
the channel can be configured.
• The Acquisition settings box (Fig. 2.4a-1) is used to define how electrophysiological data is acquired. This
includes triggering options, as well as frequency filters.
• The LED Options box (Fig. 2.4a-2) is used to define the cannula LED current and the current baseline.
• The Headstage settings box (Fig. 2.4a-3) is used to define the pulse sequence emitted by the cannula LED.
While the standard pulse sequence is square, the Smoothing Edges function can allow specific rise/fall times.
3. Once your channel is configured, it can be controlled using the Acquisition control tab and the tools in the Acqui-
sition view.
• Once the headstage is charged and off the charging station, click the Pair/Unpair button (Fig. 2.4b-1), which
will connect it to the console. Its Unique ID will be indicated right above the button. The wifiChannel is
shown beside the Unpair button; if multiple headstages are in use, each much have a different channel sepa-
rated by at least 10 increments.
• Once the headstage is paired, the LED sequence is triggered by the beginning of an acquisition sequence.
The sequence progression can be seen on the LED Trigger window (Fig. 2.4b-2).
• Once everything is ready, the Live/Record buttons (Fig. 2.4b-3) will start the acquisition sequence.
• With the acquisition sequence started, recorded signal will be shown in the Graphs Box (Fig. 2.4b-4).
Chapter 2. Operations Guide 9