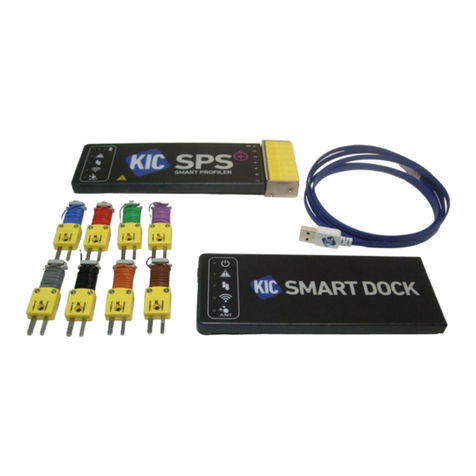
Elcomponents SPC Pulse User manual

SPC Pulse
USER MANUAL
WWW.SPCLOGGERS.COM

CONTENTS PAGE
INTRODUCTION 1
DESCRIPTION 2
THE FRONT PANEL 3
CONNECTING &USING THE SPC PULSE 9
POWERPACKPRO SOFTWARE (V3.0.1 &LATER) 7
PROGRAMMING THE SPC PULSE 8
USING THE GRAPHING PACKAGE 12
APPENDIX 1 26

1
The three channel SPC Pulse is the world's first pulse logger designed specifically for
energy and carbon management. Its unique 'auto-sensing' inputs make for foolproof
hook-up even onto polarised meter outputs, and its dedicated software package
'PowerPackPro' is perfectly tailored for the job. Its connection cables convert easily
to mate with ‘meter specific’sockets, and Elcomponent keep all the commonly
encountered cable types in stock. The unit is small, light and compact, but also tough
enough to withstand years of professional use.
The SPC Pulse is suitable for logging any kind of meter, measuring any utility
(gas/water/electricity etc). However, connecting to meter pulse outputs is not
always straightforward, because many types use an 'electronic' as opposed to
‘electromechanical’output style. The electronic output is usually polarised so the
operator has to ensure the logger is connected the 'right way round' or no pulses will
be detected. This can be difficult to assess with a non-intelligent logger, but with the
SPC Pulse it's easy. The unit automatically detects the meter output polarity and
automatically adjusts its own polarity to suit. Its detection circuits are highly
sensitive so it can be used on all kinds of pulse output even where short duration or
high contact resistance would normally cause problems.
The unit features a rechargeable Li-Ion battery for maximum survey length and
minimum recharge times, whilst remaining light and compact. Surveys of up to six
weeks are no problem with the SPC Pulse. The unit looks the part too… housed in a
weather resistant piano black 'Peli' case it comes in a neat zip-up pouch complete
with a set of high quality connection cables.
INTRODUCTION

2
The SPC Pulse is a 3 channel pulse logger designed for the logging of all types of
pulse output meter, or other pulse generating device. It is compatible with all types
of commonly encountered pulse output styles including volt-free mechanical and
electromechanical contacts, open collector, and most other solid state types.
What’s in the box?
1x Battery charger
1x USB connection cable
1x PowerPackPro PC software on minidisk
3x Pulse connection cables –fork type
1 X Zip Case
NOTE: Alternative connection cables are available from Elcomponent to facilitate
connection to meters with specific output styles & output socket.
The SPC Pulse is fully compatible with the SPC DTM Remote Download Module for
extended surveys. Please visit www.spcloggers.com for further details.
DESCRIPTION

3
On/Off/Detect button:
Pressing the ‘on/off/detect’ button momentarily switches the unit on. This is
confirmed by the top four L.E.Ds flashing twice.
Provided the unit is not logging, pressing the button momentarily a second time
switches the unit off. This is confirmed by the top four L.E.Ds flashing once.
When the unit is logging, pressing the button momentarily toggles the unit in and
out of ‘detect’ mode. Detect mode is indicated by the channel indicators flashing
continuously in sequence.
The Front Panel
On/Off/Detect button
‘Logging’ Indicator
Ch1 Pulse
Ch2 Pulse
Ch3 Pulse
‘Charge’ Indicator
Logging Start/Stop button
USB comms and charger socket

4
NOTE: The unit cannot be turned off if it is logging. Logging must be stopped (see
below) before the unit can be switched off.
Log Button:
Pressing and holding the ‘log’ button starts the logging process. The button must be
held down until the ‘logging’ L.E.D stops flashing, and then released.
Logging mode is confirmed by the ‘logging’ L.E.D flashing every few seconds.
The logging process is terminated by pressing and holding the ‘log’ button until the
‘logging’ L.E.D stops flashing.
Logging indicator:
This L.E.D flashes every few seconds to indicate that logging is in progress.
Channel indicators:
These L.E.Ds flash ‘on’ when a pulse is detected.
Charge indicator:
This L.E.D illuminates when the unit is connected to a power supply and the battery
is charging. It will extinguish when the battery is fully charged or the charger is
disconnected.
USB Socket:
The USB connection provides the charger input and PC interface, using the supplied
cable.
The SPC Pulse has a internal high capacity lithium ion battery which will provide up
to six weeks data logging. Indefinite logging is possible if the unit is connected to the
power supply provided in the kit. If the battery condition is unknown, or charge level
is low, it is recommended that the external power supply is used. To charge the
battery fully prior to using the logger, it should be connected to the power supply
and switched off for a period of 12-24 hours.
The SPC Pulse may be utilised to a standard pulse logger, or, by toggling into ‘detect’
mode, as an intelligent unit.
In standard mode, the logger does not attempt to detect the polarity (if any) of the
pulse output. Volt-free mechanical or electromechanical contacts are not polarised
but electronic outputs usually are. For pulses to be reliably detected on electronic
contacts it is essential that the correct polarity is observed.
CONNECTING AND USING THE SPC PULSE

5
If this is known, the connections may be made using the cables supplied with the
logger in standard mode. A selection of cables is available from Elcomponent to suit
specific meter types, providing the correct connector for the pulse output socket.
These will automatically polarise correctly as they are pre-wired. If the standard fork
type connection cables are used, these should be connected red to + ve and black to
–ve. Once the connections have been made, the SPC Pulse will detect pulses on all
connected channels, and these will be indicated by the relevant L.E.D.
NOTE: The channel L.E.D.s will flash once each time a pulse is detected. The SPC
Pulse detects a ‘rising edge’ only. Shorting the inputs of the logger will
cause the relevant channel L.E.D. to flash once, but not remain on. The
unit cannot be used to indicate the status (high or low) of a pulse contact.
PULSE OUTPUT CONNECTION
If the pulse output polarity is not known, it is recommended that the SPC Pulse is
used in intelligent mode, utilising the ‘detect’ function to establish the connection.
This is achieved as follows:
I. Switch the logger on
II. Press and hold the ‘log’ button until the ‘logging’ L.E.D stops flashing, then
release it
Meter
CH 1
CH2
CH3
+VE
-VE

6
Logging mode is confirmed by the ‘logging’ L.E.D flashing every few
seconds.
III. Connect the desired channels to the pulse outputs to be logged (polarity is
unimportant)
IV. Momentarily press the on/off/detect button to toggle the logger into detect
mode. This is indicated by the channel L.E.Ds flashing continuously in
sequence.
The channel L.E.Ds will continue to flash in sequence until a pulse is detected. When
this happens the L.E.D indication for the channel in question will extinguish, and the
logger will automatically adjust its input to just the polarity of the pulse output.
Once a pulse has been detected and the associated L.E.D extinguished, the channel
L.E.D then behaves in the normal way and flashes when further pulses are detected.
The SPC Pulse may now be left to log unattended.
STARTING A SURVEY
If the SPC Pulse is used in intelligent mode, logging is initiated as part of the
detection process. However if polarity detection is not required, the following
procedure is required to start a survey (commence logging).
Press and hold the ‘log’ button until the ‘logging’ L.E.D stops flashing, then
release it
Logging mode is confirmed by the ‘logging’ L.E.D flashing every few
seconds.
ENDING A SURVEY
A survey may be ended manually by pressing and holding the ‘log’ button until the
‘logging’ L.E.D stops flashing.
Surveys will end automatically if the programmed survey duration is reached, or if a
power supply is not connected, when the battery life is exceeded.
DOWNLOADING A SURVEY
Please refer to the following section for details on data download and presentation.

7
OVERVIEW
The SPC Pulse ships complete with a dedicated PC utility program which provides
communication, set up and data presentation capabilities. PowerPackPro is
designed to run on Windows XP and later platforms.
PowerPackPro is a task-orientated program and is extremely easy to drive, even for
new users. It provides the following functionality for the SPC Pulse:
Logger Set Up
Logger Status Check
Logger Download
Data Presentation
Multiple Trace ‘Zoom’ Graphing
Carbon Footprint Calculation
Multi-rate Tariff costing
Alarm Reporting
Statistical Analysis
Summary Reporting
Data Export to MS Office
Survey Sharing via eMail (MS Outlook)
NOTE: This manual is based on software version 3.0.0.1 and later. Earlier
versions of PowerPackPro are not compatible with the SPC Pulse. Please
go to www.spcloggers.com for a free upgrade.
LOADING THE SOFTWARE
To load PowerPackPro, install the CD and follow the on-screen instructions.
NOTE: PowerPackPro is available for free download at www.spcloggers.com
However to avoid potential driver problems it is important to load the
software on the CD supplied with the unit, even if a downloaded copy has
already been installed. Future software updates may then be downloaded
from the website as required.
The software ships with some sample data pre-loaded which can be used for
familiarisation with the package, and is this used in the examples in the ‘Using The
Graphing Package’ section.
POWERPACKPRO SOFTWARE (V3.0.0.1 and later)

8
SPC PULSE INITIALISATION PROCEDURE
I) Connect the SPC Pulse to a spare USB port on your PC using the supplied
A to B type USB cable. This will normally wake the unit up. If it does not,
firmly press the On/Off/Detect button to do so. Windows should
recognise the logger and install the necessary drivers etc. This is
confirmed by a dialogue ‘balloon’ at the bottom right of the screen.
NOTE: If the PC fails to recognise the SPC Pulse, or displays a different message,
refer to Appendix 1 ‘Loading the SPC drivers’ to rectify the situation.
I) With PowerPackPro running connect the SPC Pulse to a spare USB port on
your PC and after a few seconds the software will link to the logger and
display the dialogue box:
II) Press ‘OK’to add the logger to the tree on the upper left of the desktop.
CON PROGRAMMING THE SPC PULSE

9
SETTING UP
Right click the SPC Icon to open the command menu
This provides four options:
‘View Logger Status’ (also available via the icon)
Details of the device and any recorded data are shown, along with the logging status
indicator. Green for ‘on’ and red for ‘off’. Note that the logger name can be set as
desired.

10
‘Set Up Survey’ (also available via the icon)
Use this window to set the desired storage interval/survey period. For maximum
resolution it is recommended that the unit is set to use the entire memory to
complete the required survey.
Click ‘Set Logger’ to update the unit.
NOTE: The SPC Pulse internal clock will be se to match the PC clock at this point.
It is therefore essential that the PC calendar/clock is correct
‘Download Data’ (also available via the icon).

11
Step 1
Click ‘Next’ to download the data.
NOTE: This does not clear the logger memory.
Step 2
When the download reaches 100%, click ‘next’ to enter the survey name, location
and any relevant notes.
Step 3 (Enter Channel 1 Details)
At this point the description, utility and unit of measure must be entered for each
channel, along with the pulse value. The utility is selected from a menu of options
which will determine the ‘Units’ options available for the relevant utility. The pulse
value may be entered either as ‘Pulses per Unit’ or ‘Units per Pulse’. Note that these
two fields are interdependent, and each will reflect the value entered in the other.
I
Click ‘Next’ to repeat the process for channels 2 & 3.
NOTE: If one or more channels are unused, select ‘None’ from the utility
list.
NOTE: All entered values may be freely edited later if required (see page 20)
STEP 6 (Select Tariffs

12
Select a tariff from the drop down menu for use in cost calculations.
NOTE: PowerPackPro is pre-loaded with default single rate and day/night tariffs.
Other tariffs may be added by the user (see page 25).
Click ‘finish’ to open a graph showing the survey results
PowerPackPro will automatically open a graph after a survey has been successfully
downloaded. Graphs may also be opened by clicking on the relevant survey in the
survey list, or via the icon.
Depending on the length of the downloaded survey, the default settings will create a
graph of the entire survey, or in the case of longer surveys will create a graph using a
30 minute data interval with an initial view of a 1 week period. These settings may
be altered manually if desired. PowerPackPro is shipped with a SPC Pulse sample
survey pre-loaded which is used in the following pages.
USING THE GRAPHING PACKAGE

13
The above window shows the default view for the sample survey. Note that it is a
dual axis graph showing energy in kWh on the LH axis and Volume on the right, and
three data traces are present for electricity, water and gas (1 X bar chart and 2 X line
chart traces). The bar chart is always referenced to the LH Y axis, and the line charts
to the RH one.
Because the chart only has 2 Y axes and the SPC Pulse is a 3 channel device, the
graph behaviour is dependent on the number of channels used in the survey, and
the unit(s) of measure defined during the download process detailed above. If only
one or two channels are used during the survey, the graph will automatically show
both channels regardless of the programmed units. If all three channels are
populated, the graph will show three data channels provided that no more than two
units of measure are in use. If three different units are present (e.g. kWh, m3 and ft3)
the graph will display channels 1 & 2. The third channel may be manually accessed
via the axis controls as detailed below.

14
GRAPH CONTROLS
Axis Controls:
It will be noted from the above graph image that Y-Axis controls are present on the
menu bar providing individual control of the LH and RH axes. Click the menu arrow
against the desired axis label to open the main option list.
PowerPackPro is an energy and carbon management software package and
therefore allows instant presentation of all data acquired via the SPC Pulse to be
displayed either ‘As Measured’ or as energy in kWh, cost in £, or as kilograms of CO2.
‘As Measured’ will display the channel in the unit chosen during the
download process. In the case of electricity consumption, the as measured
value will be expressed as energy in kWh, but in the case of gas, water and
other utilities will be expressed in volume or mass or other relevant unit.
‘Energy’ will automatically convert the ‘as measured’ value into kWh, if
applicable. In the case of gas or oil for example, the software calculates the
kWh equivalent of the measured volume using standard calorific values. The
calorific values and calorific kWh factors may be adjusted from the pre-
loaded settings if required (see page 21). This option is not applicable to
utilities such as water, which cannot be expressed as energy.
‘Cost’ will automatically convert the ‘as measured’ value into a cost figure
using the tariff information loaded by the user. If no tariff information has
been loaded, the pre-loaded tariff will be used.
‘CO2’will automatically convert the ‘as measured’ value into kgs of CO2, if
applicable, using the standard carbon equivalent for the utility in question.
Carbon equivalent values may be adjusted from the pre-loaded settings if
required (see page 21).

15
Selecting the desired option will open a second menu window as below:
This allows the user to define which axis the channel(s) are allocated to. Note that
the LH axis displays the data as a bar chart, whereas the RH axis displays data as a
line chart. When 2 or 3 data sets are allocated to the LH axis they will be displayed
as a stacked bar chart, as in the example below. This is the same chart as that shown
on page 13 but the axis preferences have been changed to show the gas and water
against the LH axis and the electricity on the RH axis.
Check the boxes as required, and press the ‘OK’ button to set.
NOTE: The axis channel settings are context dependent. Non viable options will
be inhibited. I.e. it is not possible to add a ‘non energy’ utility such as
water to an ‘energy’ axis. Therefore the selection of ‘As Measured’
followed by the selection an ‘Electricity’ channel and a ‘Water’ channel on
the same axis is not possible. On the other hand, selecting ‘Cost’ followed

16
by an ‘Electricity’ channel and a ‘Water’ channel is valid, as both utilities
can be expressed as a cost.
NOTE: It may be necessary to uncheck a channel before checking another to
remove a ‘conflict of units’.
Data Interval:
Select the down arrow on the graph “Interval” option to change the data integration
period. The default behaviour will utilise the ‘As survey’ option for short surveys (up
to approximately 18 hours duration, and the ’30 minutes’ option for longer surveys.
Zoom:
Click the zoom tool buttons to activate the zoom cursor. Drag the cursor
over the desired graph area whilst holding down the left mouse button to define a
zoom area.
Release the mouse button to display the zoom area

17
NOTE: The zoom function can be repeated as many times as necessary to provide
a macro zoom capability. The button reverses the zoom-in process by
one step per click.
Application of the zoom tool creates scroll bars on the X and Y axes. These allow the
user to scroll backwards and forwards and up and down through the full extent of
the data, whilst maintaining the desired zoom resolution.
Show Data Values:
Select the ‘crosshairs’ button to see the graph data values on mouse-over.

18
Show Alarm Levels:
Click the button to display the alarm values on the graph. The alarm areas (high
and low) appear as pink areas on the chart with the ‘normal’ value area showing a
green tint. See page 23 for setting alarm levels.
Show Gridlines:
Click the button to toggle the graph gridlines on and off.
3D View:
Click the button to toggle between 2D and 3D graph view. Chart below shows
3D view.
Table of contents
