METER Group, Inc. Spectral Reflectance Sensor User manual

SRS
Spectral Reflectance Sensor
Operator’s Manual
METER Group, Inc. USA
14597-02

SRS Sensors
METER Group, Inc. USA
2365 NE Hopkins Court
Pullman WA 99163
Phone: 509-332-5600
Fax: 509-332-5158
Website: www.metergroup.com
sales.environmen[email protected]
METER Group, Inc. USA
c
2006-2019
All Rights Reserved
ii

SRS Sensors CONTENTS
Contents
1 Introduction 1
1.1 Customer Support . . . . . . . . . . . . . . . . . . . . 1
1.2 About This Manual . . . . . . . . . . . . . . . . . . . 2
1.3 Warranty ......................... 2
1.4 Seller’s Liability . . . . . . . . . . . . . . . . . . . . . . 2
2 About SRS 3
2.1 Overview ......................... 3
2.2 Specifications ....................... 4
3 Theory 6
3.1 Normalized Difference Vegetation Index (NDVI) . . . 6
3.2 EstimatingLAI...................... 8
3.3 Fractional Interception of Photosynthetically Active
Radiation ......................... 8
3.4 Canopy Phenology . . . . . . . . . . . . . . . . . . . . 10
3.5 Photochemical Reflectance Index (PRI) . . . . . . . . 11
3.6 Sun-Sensor-Surface Geometry Considerations . . . . . 12
3.7 Calculating Percent Reflectance from Paired Up and
Down Looking Sensors . . . . . . . . . . . . . . . . . . 15
4 Field Installation 19
5 Connecting the SRS 21
5.1 Connecting to METER Data Logger . . . . . . . . . . 21
5.2 3.5 mm Stereo Plug Wiring . . . . . . . . . . . . . . . 22
5.3 Connecting to a Non-METER Logger . . . . . . . . . 22
5.4 Pigtail End Wiring . . . . . . . . . . . . . . . . . . . . 23
6 Communication 25
6.1 SDI-12 Communication . . . . . . . . . . . . . . . . . 25
7 Understanding Data Outputs 27
7.1 Using METER’s Data Loggers . . . . . . . . . . . . . 27
7.1.1 Up Looking Sensor Outputs . . . . . . . . . . . 27
7.1.2 Down Looking Sensor Outputs . . . . . . . . . 27
7.2 Using other data loggers . . . . . . . . . . . . . . . . . 28
iii

CONTENTS SRS Sensors
8 Installing the SRS 29
8.1 Attaching and Leveling . . . . . . . . . . . . . . . . . 29
8.2 Cleaning and Maintenance . . . . . . . . . . . . . . . . 29
9 Troubleshooting 31
9.1 DataLogger........................ 31
9.2 Sensors .......................... 31
9.3 Calibration ........................ 31
10 Declaration of Conformity 33
iv

SRS Sensors 1 INTRODUCTION
1 Introduction
Thank you for choosing METER’s Spectral Reflectance Sensor (SRS).
We designed the SRS for continuous monitoring of Normalized Differ-
ence Vegetation Index (NDVI) and/or the Photochemical Reflectance
Index (PRI) of plant canopies. We intend for the SRS to be low cost,
easily and quickly deployable, and capable of reliable operation over
years. NDVI and PRI are used by researchers to monitor canopy
biomass, leaf area, phenology (green up and senescence), biomass
production, and light use efficiency, among other variables. This
manual will help you understand the sensor features and how to use
this device successfully.
1.1 Customer Support
If you ever need assistance with your sensor, have any questions or
feedback, there are several ways to contact us. METER has Cus-
tomer Service Representatives available to speak with you Monday
through Friday, between 7 am and 5 pm Pacific time.
Note: If you purchased your sensor through a distributor, please con-
tact them for assistance.
Email:
sales.environmen[email protected]
Phone:
509-332-5600
Fax:
509-332-5158
If contacting us by email or fax, please include as part of your mes-
sage your instrument serial number, your name, address, phone, fax
number, and a description of your problem or question.
1

1 INTRODUCTION SRS Sensors
1.2 About This Manual
Please read these instructions before operating your sensor to ensure
that it performs to its full potential.
1.3 Warranty
The sensor has a 30-day satisfaction guarantee and a one-year war-
ranty on parts and labor. Your warranty is automatically validated
upon receipt of the instrument.
1.4 Seller’s Liability
Seller warrants new equipment of its own manufacture against de-
fective workmanship and materials for a period of one year from the
date of receipt of equipment.
Note: We do not consider the results of ordinary wear and tear,
neglect, misuse, or accident as defects.
The Seller’s liability for defective parts shall in no event exceed the
furnishing of replacement parts “freight on board” the factory where
originally manufactured. Material and equipment covered hereby
which is not manufactured by Seller shall be covered only by the
warranty of its manufacturer. Seller shall not be liable to Buyer for
loss, damage or injuries to persons (including death), or to property
or things of whatsoever kind (including, but not without limitation,
loss of anticipated profits), occasioned by or arising out of the instal-
lation, operation, use, misuse, nonuse, repair, or replacement of said
material and equipment, or out of the use of any method or process
for which the same may be employed. The use of this equipment
constitutes Buyer’s acceptance of the terms set forth in this war-
ranty. There are no understandings, representations, or warranties
of anykind, express, implied, statutory or otherwise (including, but
without limitation, the implied warranties of merchantability and
fitness for a particular purpose), not expressly set forth herein.
2

SRS Sensors 2 ABOUT SRS
2 About SRS
2.1 Overview
The SRS are two-band radiometers we designed to measure either in-
cident or reflected radiation in wavelengths appropriate for calculat-
ing the Normalized Difference Vegetation Index (NDVI) or the Pho-
tochemical Reflectance Index (PRI). They are designed to be an al-
ternative to more complex and costly spectrometers. The SRS sensor
comes in four different versions: NDVI-hemispherical (Ni), NDVI-
field stop (Nr), PRI-hemispherical (Pi) and PRI-field stop (Pr). The
hemispherical versions (Figure 1) are built with Teflon diffusers for
making cosine-corrected measurements, with a hemispherical 180◦
FOV, and are primarily designed for up looking measurements of in-
cident radiation. The field stop versions (Figure 2) have a field of
view restricted to 36◦(18◦half angle) and are designed for pointing
downward to measure canopy reflected radiation.
Calculating NDVI or PRI requires knowing both incoming and re-
flected radiation. Unlike the reflected radiation, the incoming radia-
tion is spatially uniform above the canopy. So, you only need one up
facing radiometer to compute the vegetation indices for many down
facing radiometers that are within the same general area. The up
looking radiometer must be leveled and have a hemispherical field of
view.
The SRS is a digital sensor. Its outputs follow the SDI-12 standard.
The SRS is best suited for use with METER’s data loggers. How-
ever, customers can use the SRS with other loggers, such as those
from Campbell Scientific.
3

2 ABOUT SRS SRS Sensors
Figure 1: Hemispherical Version Figure 2: Field Stop Version
2.2 Specifications
Accuracy: 10% or better for spectral irradiance and radiance values
Measurement Time: <600 ms
NDVI Wavebands: 650 and 810 nm central wavelengths, with 10
nm full width half maximum band widths
PRI Wavebands: 532 and 570 nm central wavelengths, with 10 nm
full width half maximum band widths
Field of View: Hemispherical version: 180◦full angle, Field stop
version: 36◦full angle (18◦half angle)
Dimensions: 43 x 40 x 27 mm
Weight: 47 g (sensor), 170 g (sensor with 5 m cable)
Power Requirements: 3.6 to 15 V DC, 4 mA (reading, 600 ms) 30
µA (quiescent)
Operating Temperature: −40 to 50 ◦C
Connector Types: 3.5 mm (stereo) plug or stripped & tinned lead
wires (Pigtail)
Cable Length: 5 m standard
Other Features:
4

SRS Sensors 2 ABOUT SRS
•SDI-12 digital sensor, compatible with METER data log-
gers and CSI loggers
•In-sensor storage of calibration values
•Four versions
Ni - NDVI hemispherical
Nr - NDVI field stop
Pi - PRI hemispherical
Pr - PRI field stop
•NIST traceable calibration to known spectral radiance or
irradiance values
•Sensors can be mounted facing up or down, singly or in
tandem, leveled or aimed
•Sensor body and electronics are fully sealed from the ele-
ments and UV resistant to minimize drift over time
5

3 THEORY SRS Sensors
3 Theory
METER designed the SRS to measure NDVI and PRI vegetation in-
dices from plant canopies. We caution users that NDVI and PRI are
derived from measurements of radiation reflected from canopy sur-
faces, and therefore provide only indirect or correlative associations
with several canopy variables of interest and should not be treated
as direct measurements of these variables.
NDVI has a well-established and long history of use in remote sens-
ing research and ecological applications related to canopy structure.
PRI, while showing great promise for quantifying canopy physiolog-
ical function, is far more experimental with new uses and caveats
continually being discovered. While NDVI and PRI can be power-
ful tools for inferring structure and function of plant canopies, you
must take into account their limitations when interpreting the data.
Section 3 provides an overview of the theory and discusses some of
the uses and limitations of each vegetation index.
3.1 Normalized Difference Vegetation Index (NDVI)
A number of nondestructive methods exist for remotely monitoring
and quantifying certain canopy characteristics. Some of those char-
acteristics are: foliar biochemistry and pigment content, leaf area
index (LAI, Nguy-Robinson et al., 2012), phenology, and canopy
photosynthesis (Ryu et al., 2010). One nondestructive method in-
volves measuring NDVI. The underlying principle of NDVI derives
from a well known concept that vegetation reflects light differently in
the visible spectrum (400 to 700 nm) compared to the near infrared
(>700 nm).
Green leaves absorb light most strongly in the visible spectrum, es-
pecially at red wavelengths, but are highly reflective in the near in-
frared region (Figure 3). Because bare soil, detritus, stems, trunks,
branches, and other non-photosynthetic elements show relatively lit-
tle difference in reflectance between the visible and near infrared,
measuring the difference between reflectance in these two bands can
be related to the amount green vegetation in the field of view of a ra-
6

SRS Sensors 3 THEORY
diometer. See Royo and Dolors (2011) for an extensive introduction
to using spectral indices for plant canopy measurements.
Figure 3: Reflectance spectra for bare soil (Soil) and a healthy
wheat crop at various stages of development: heading (H), anthesis
(A), milk-grain stage (M), and post maturity (PM). Consider two
things about this figure: First, the considerable difference between
reflectance spectra from the soil and all stages of plant
development. Second, the changes in the visible spectra as the
canopy matures and senesces. Figure reproduced with permission
from Royo and Dolors (2011).
Calculate NDVI as:
NDV I =ρNIR −ρred
ρNIR +ρred
(1)
where, ρred and ρNIR are percent reflectances in the red and near
infrared (NIR). We assume percent reflectance to be the ratio of
reflected to incident radiation in the specified waveband. A detailed
description of how to calculate reflectances from measured radiation
values is provided in equation number 4.
7
3 THEORY SRS Sensors
3.2 Estimating LAI
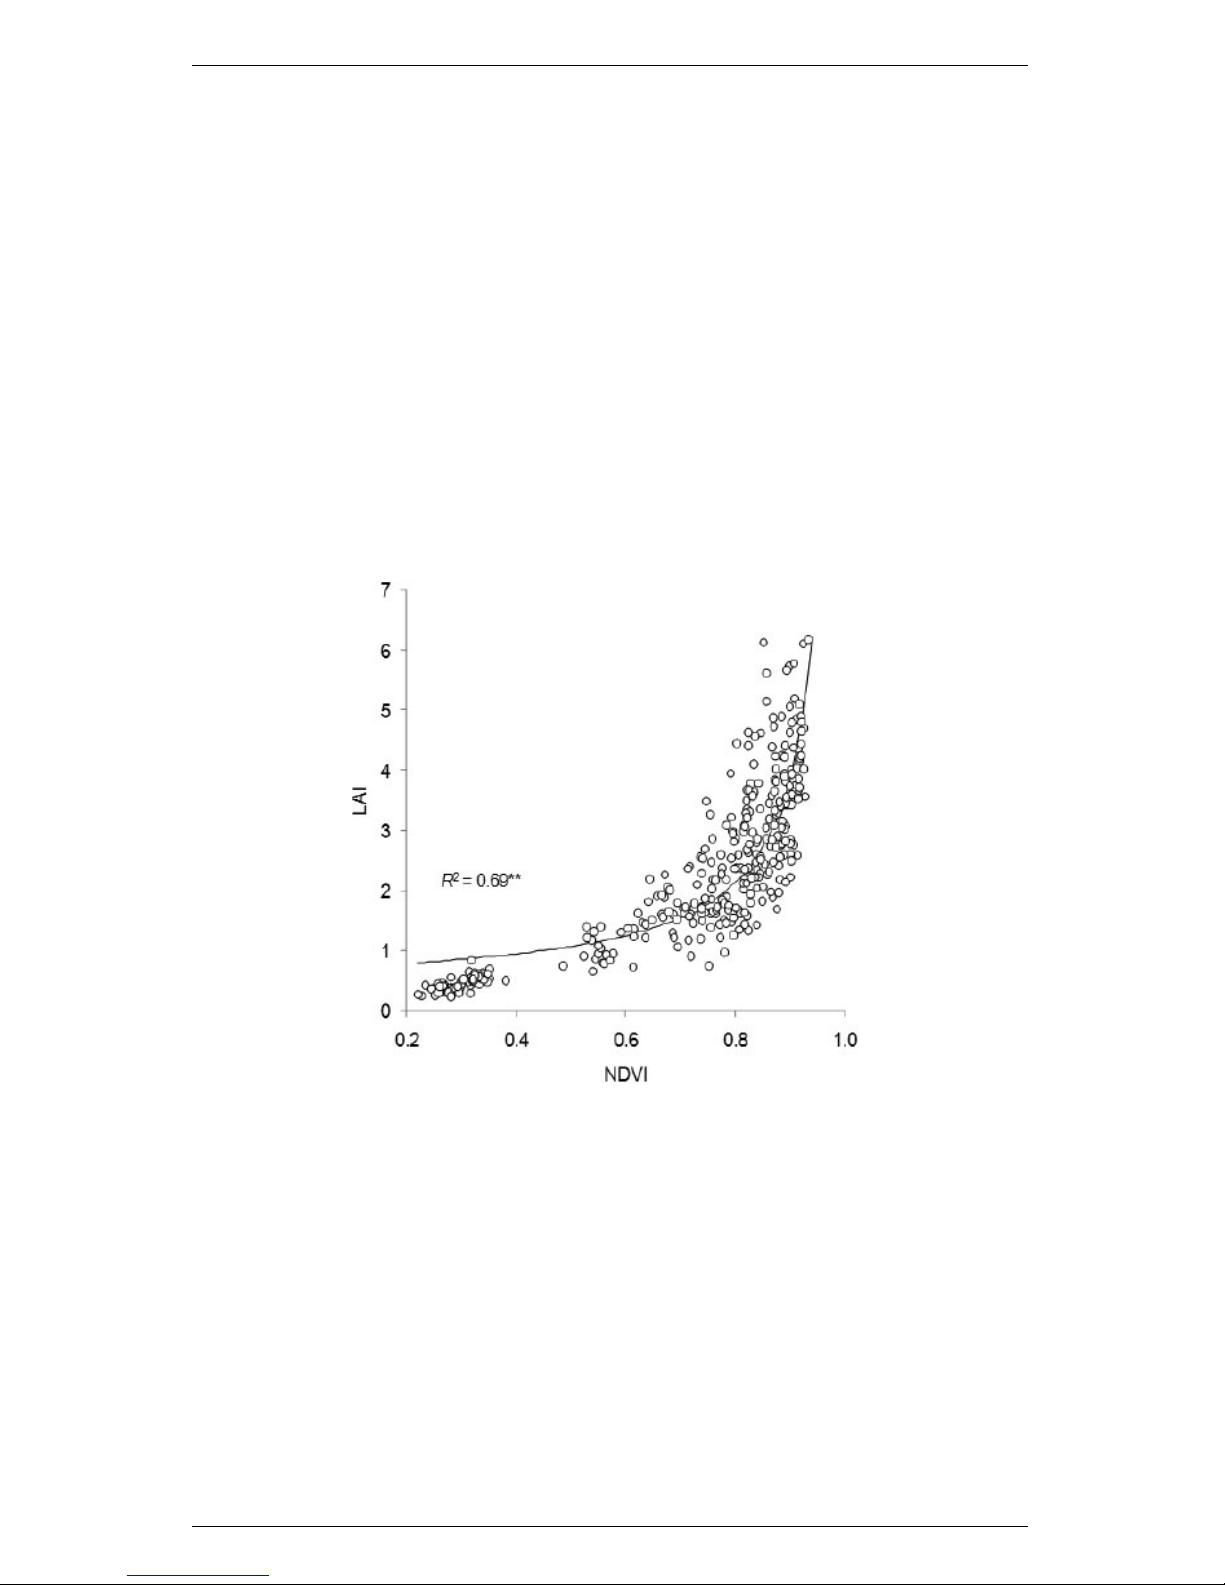
NDVI has been shown to correlate well with green LAI, although
the relationship is crop- or canopy-specific. For example, Aparicio et
al. (2002) studied NDVI versus LAI in more than twenty different
durum wheat genotypes in seven experiments over two years and
found the relationship shown in Figure 4. Nguy-Robinson (2012)
also studied the behavior of NDVI versus LAI in maize and soybean.
Their data suggest a similar relationship between the two crops, but
not identical. These relationships have been developed for a wide
range of crop and natural canopies and we encourage our customers
to seek out the best relationship for their application.
Figure 4: Relationship between leaf area index and NDVI for 20-25
durum wheat genotypes studied over two years in seven different
experiments by Aparicio et al. (2002). Values shown were taken at
anthesis and milk-grain stage. Used with permission from author.
3.3 Fractional Interception of Photosynthetically Ac-
tive Radiation
The use of NDVI for determination of leaf area index has limitations.
Like many nondestructive techniques (e.g., hemispherical photogra-
8

SRS Sensors 3 THEORY
phy and ceptometer techniques), the measurement of NDVI becomes
less and less sensitive as LAI increases above a certain point (Figure
4). Nguy-Robinson et al. (2012) suggest changes in LAI are difficult
to detect when LAI is much greater than 3 m2m−2. This should
not be surprising considering the spectral measurement being made.
NDVI measurements rely on reflected light from leaf surfaces. As
the canopy fills and upper leaves begin to cover lower leaves, the leaf
area will continue to increase without making a further contribution
to reflected radiation. Furthermore, foliar chlorophyll is a very effi-
cient absorber of radiation in red wavelengths so that reflectance from
leaves is typically very low in the red region ( Figure 3). Therefore,
increasing LAI, and thus canopy chlorophyll content, does not sub-
stantially change red reflectance beyond a certain point. For these
reasons NDVI has limited predictive ability in canopies with high
LAI. For some applications, however, NDVI saturation at high LAI
may not be as important as it would appear.
Although NDVI may have limited sensitivity when LAI is high,
shaded leaves tend to have much less impact on light capture com-
pared to sunlit leaves, and therefore contribute proportionally less to
canopy productivity. As a general modeling parameter, an estimate
of sunlit leaves may be adequate for estimating photosynthesis and
biomass accumulation (i.e., carbon uptake) for some applications.
Monteith (1977) proposed the now well-known relationship between
biomass accumulation and radiation capture seen in equation 2.
An, canopy =fsSt(2)
In equation 2, An,canopy is the biomass accumulation or carbon assim-
ilation and is a conversion efficiency often referred to as light use ef-
ficiency (LUE). The LUE depends on a variety of factors such as pho-
tosynthetic acclimation, physiological stress level, and plant species.
fsis the fractional interception of radiation by the canopy, and St
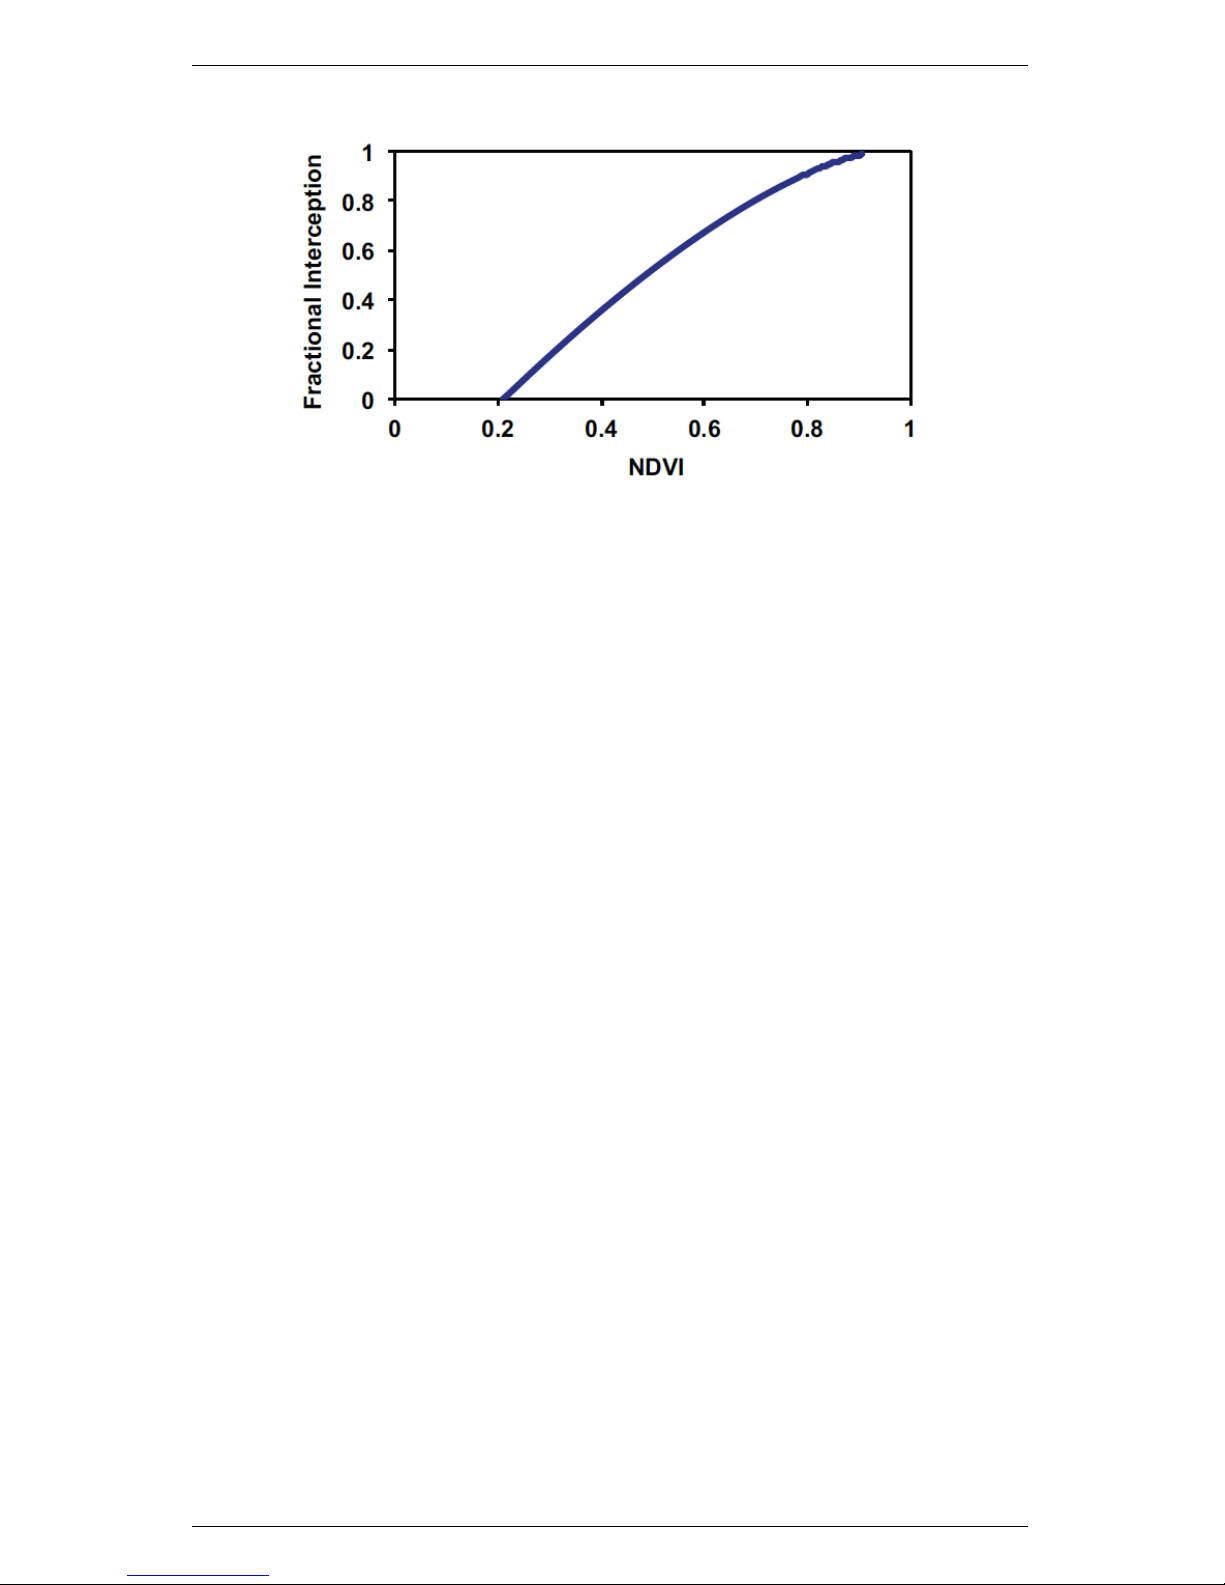
is the total incident radiation. The relationship between NDVI and
LAI in Nguy-Robinson et al. (2012) and the relation between frac-
tional interception and LAI (Campbell and Norman, 1998) show that
NDVI and fractional interception are approximately linearly related
(Figure 5). Even when LAI is high, NDVI can provide a good es-
timate of the fractional interception by green leaves in a canopy; a
value that is critical for carbon assimilation models.
9
3 THEORY SRS Sensors
Figure 5: Relationship between fractional canopy interception and
NDVI, where NDVI is converted to LAI using Nguy-Robinson et al.
(2012). Campbell and Norman (1998) give the relationship between
LAI and fractional interception.
3.4 Canopy Phenology
Like all spectral measurements, NDVI is an indirect measurement.
Over the years, researchers have correlated NDVI to several param-
eters of interest, like LAI and fs, biomass, and canopy productiv-
ity, among others. Two of these variables are the focus of Ryu et
al. (2010), who used an NDVI sensor, similar to the SRS-NDVI, to
measure canopy phenology and associated changes in photosynthesis
in an annual grassland over a four year period. Ryu et al (2010).
show an exponential relationship between NDVI and canopy photo-
synthesis, but found that the LAI of grassland never increases above
2.5 m2m−2. Ecosystem phenology can also be tracked in the time
series data from their NDVI sensor with errors on the order of a
few days. It should be noted that they filtered their data by lim-
iting NDVI measurements to a particular sun elevation angle (e.g.,
sampling under identical sun zenith and azimuth angles from day to
day).
10

SRS Sensors 3 THEORY
3.5 Photochemical Reflectance Index (PRI)
As described above, researchers use NDVI primarily as a proxy for
canopy structural variables. Although structural properties are crit-
ical, sometimes it is useful to have information about canopy func-
tional properties. For example, estimating gross primary productiv-
ity (GPP) of ecosystems is critical for modeling the global carbon
balance. The simple model presented in Equation 2 can be used to
predict GPP from three variables: incident light (St), intercepted
light (fs), and light use efficiency (). Stcan generally be estimated
depending on geographic location and time of day or measured with
a PAR sensor or pyranometer. Considering the near linear relation-
ship between NDVI and fractional interception noted above, a simple
two-band spectral reflectance sensor like the SRS-NDVI can provide
an estimate of fs. The light use efficiency term () remains to be
quantified in order to make accurate predictions of GPP.
Gamon et al. (1990, 1992) proposed a dual band vegetation index
(similar to the NDVI) that could be used to estimate . The founda-
tion of the measurement is based on the absorbance of xanthophyll
pigments in a fairly narrow spectral region around 532 nm. The xan-
thophyll cycle signal seen in reflectance at 532 nm has been shown
to be well correlated with LUE in many plant species (Gamon et al.,
1997).
The Photochemical Reflectance Index (PRI) uses reflectance at 532
nm and is calculated using Equation 3.
P RI =ρ532 −ρ570
ρ532 +ρ570
(3)
where, ρ532 and ρ570 are percent reflectances at 532 and 570 nm, re-
spectively.
In addition to LUE, PRI has also been shown to correlate with nu-
merous other physiological variables associated with plant photosyn-
thetic performance from the leaf to the ecosystem levels (Gamon et
al., 1992, 1997, 2001). Numerous studies correlate PRI to various
ecophysiological variables including the epoxidation state of xantho-
phyll, maximum photochemical efficiency of photosystem II, effective
11

3 THEORY SRS Sensors
quantum yield, maximum photosynthesis rate, electron transport un-
der saturating light, non-photochemical quenching, and chlorophyll
to carotenoid content ratio (Sims & Gamon, 2002; Garrity et al.,
2011; Garbulsky et al., 2011; Porcar-Castell et al., 2012). Garbul-
sky et al. (2011) and Porcar-Castell et al. (2012) provide excellent
overviews of what has been done with PRI including analyses of PRI
correlations with several of these variables at the leaf, canopy, and
ecosystem levels. We encourage our customers to use these references
as a starting resource.
3.6 Sun-Sensor-Surface Geometry Considerations
It is not uncommon for a time series of NDVI or PRI to contain high
amounts of variability due to changing environmental and observa-
tion conditions. Spectral reflectance measurements are inherently
variable due to radiation source, reflecting surface, and sun-sensor-
surface geometry. Sometimes NDVI and/or PRI values exhibit er-
ratic behavior due to changing environmental conditions. Some level
of data filtering (e.g., visual inspection for short time series or au-
tomated despiking and smoothing algorithms for longer time series)
may be required to remove spurious data points, including cleaning
up points that result in indeterminate or undefined results from the
NDVI or PRI calculation. Consider the NDVI time series shown in
Figure 6a. These data were collected from a corn canopy planted
in June. The data sampling interval was five minutes. There are
several things to notice:
12

SRS Sensors 3 THEORY
Figure 6: NDVI data collected at five minute intervals from a corn
canopy. B) Daily mean NDVI (blue circles) and smoothed daily
NDVI (red line), substantially reduce the high frequency variability
in the original NDVI time series.
1. Toward the beginning of the time series, NDVI data increase
until plateauing in early July, when canopy closure occurred.
2. There is a significant amount of high frequency variability, mak-
ing it difficult to see this pattern clearly.
3. One source of data variability is due to sun-sensor-surface ge-
ometry. A concave diurnal pattern of NDVI is normal, and is
caused by the sun moving across the sky each day (Figure 7).
13

3 THEORY SRS Sensors
Figure 7: A subset of the data displayed in Figure 6, showing a
single day of NDVI data. Notice the concave pattern that is typical
in diurnal NDVI measurements. The concave pattern is due to
changing sun-sensor-surface illumination geometry throughout the
day.
4. Calculating daily averages, using values acquired only during
the noon hour, significantly reduces the amount of data vari-
ability (Figure 6b). A smoothing algorithm applied to the daily
averages reduces variability even further. In this example, data
were filtered and averaged by time, but you can also use solar
zenith and azimuth angles to filter you data. For example, Ryu
et al. (2012) sampled across a consistent solar elevation angle
(60) each day, ignoring all other values. Using solar zenith an-
gle as a filter ensures that data from each day are collected
under similar sun-sensor-surface illumination conditions.
5. If you are comparing measurements acquired under different
sun-sensor-surface configurations (e.g., comparing PRI mea-
surements made during the morning and afternoon), it may
be necessary to first calculate a bidirectional reflectance distri-
bution function (BRDF). An empirical BRDF model, derived
from NDVI or PRI measurements and canopy-specific param-
14

SRS Sensors 3 THEORY
eters, can be used to reduce variations that arise from changes
in sun-sensor-surface geometry across diurnal time scales. For
additional details on BRDF normalization of vegetation index
time series, see Hilker et al. (2008).
3.7 Calculating Percent Reflectance from Paired Up
and Down Looking Sensors
Equation 1 shows that NDVI is the ratio of the difference to the sum
of NIR and red reflectances. Each reflectance value is the ratio of up-
welling (down looking sensor) to incident (up looking sensor) radiant
flux in each of the wave bands. Calculating this ratio is only possi-
ble when measurements of downwelling and upwelling radiation are
collected simultaneously under the same ambient conditions. Com-
bining measurements made with sensors located long distances apart
is typically not recommended because atmospheric conditions (e.g.,
cloud cover, aerosols) can be highly variable in space. Reasonable
distances between up looking and down looking sensors will depend
on the typical radiation environment of a given location.
It is important to arrange paired up looking and down looking sen-
sors to collect data at the same time to account for temporal vari-
ability in radiation conditions. In cases where multiple down looking
sensors have been deployed within close proximity to each other, it
is only necessary to have one up looking sensor. The measurements
from the single up looking sensor can be combined with the measure-
ments from each of the down looking sensors to calculate reflectances.
In the event that up looking measurements are not available, re-
arrangement of the vegetation index equations allows for a rough
approximation of the measurements. The following derivation is for
NDVI, but similar equations apply to the PRI. If Rnis the reflected
NIR radiation from the canopy, Rris the reflected red radiation, In
is the incident NIR, and Iris the incident red, then
NDV I =Rn/In−Rr/Ir
Rn/In+Rr/Ir
=(Ir/In)Rn−Rr
(Ir/In)Rn+Rr
=αRn−Rr
αRn+Rr
(4)
15

3 THEORY SRS Sensors
Where α=Ir/In, equation 4 allows the computation of NDVI from
just the down facing measurements if you know the ratio of red to
NIR spectral irradiance, α. Although not extensively tested, we have
found that this ratio (α= 1.86 for NDVI bands) can be used as
a rough approximation during midday under clear sky conditions.
However, we advise that direct measurements of downwelling radi-
ation is more accurate by accounting for any fluctuations in αthat
occur with changes in atmospheric conditions or across large varia-
tions in sun elevation angle.
In the event that you do not want to use the default αvalue or
if measurements from an up facing sensor are not available, it is pos-
sible to use a Spectralon panel or similar reflectance standard with a
field stop SRS to measure incident irradiance. To measure incident
irradiance with a down facing sensor, place a reflectance standard
within the field of view of the field stop sensor, making sure that the
reflectance panel is uniformly illuminated and that the field of view
of the sensor is fully within the area of the reflectance panel. Mea-
surements obtained from field stop sensors pointed at the reflectance
panel must be multiplied by πto convert radiance values to irradi-
ance values. Irradiance values can then be used in Equation 4 or to
calculate αdirectly.
References
Aparicio, N., Villegas, D., Casadesus, J., Araus, J.L., and Royo,
C., (2000). Spectral vegetation indices as nondestructive tools for
determining durum wheat yield. Agronomy Journal, 92: 83-91.
Aparicio, N.; Villegas, D.; Araus, J.L.; Casadess, J.; Royo, C.,
(2002). Relationship between growth traits and spectral reflectance
indices in durum wheat. Crop Science, 42: 1547-1555.
Campbell, G.S. and Norman, J.M., (1998). An Introduction to En-
vironmental Biophysics. Springer-Verlag. New York.
Gamon, J.A., Field, C.B., Bilger, W., Bjorkman, O., Fredeen, A.L.,
Penuelas, J., (1990). Remote sensing of the xanthophylls cycle and
16
Table of contents


 Specification sheet")


