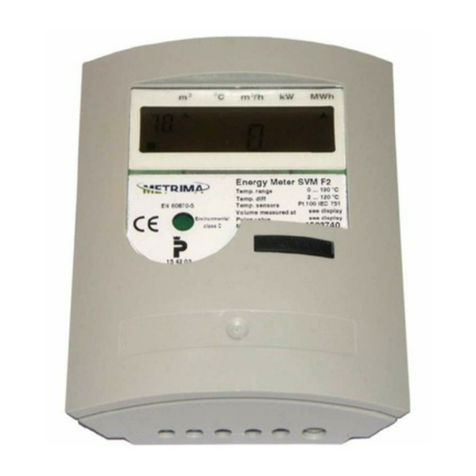
Metrima SVM F2 User manual

SVM F2 Calculator
A small competent calculator for compact or wall montage
Users’ manual


3
Users’ manual F2
1INSTALLATION.................................................................................................... 5
1.1 AT DELIVERY ......................................................................................................... 5
1.2 CONNECTIONS ....................................................................................................... 6
2MOUNTING............................................................................................................ 7
2.1 MOUNTING ON A FLOW SENSOR............................................................................ 7
2.2 LEAD-THROUGH .................................................................................................... 7
2.3 DIMENSIONS........................................................................................................... 7
2.4 INSTALLATION TEST .............................................................................................. 8
2.5 MOMENTARY VALUES ........................................................................................... 8
3HANDLING............................................................................................................. 9
3.1 DISPLAY ................................................................................................................. 9
3.2 DISPLAY SEQUENCE TABLE ................................................................................. 10
3.3 ERROR CODES...................................................................................................... 11
4SERVICE............................................................................................................... 13
4.1 SERVICE SEQUENCE TABLE ................................................................................. 14
5VERIFYING THE CALCULATOR ................................................................... 15
6SEALS.................................................................................................................... 16
7TECHNICAL DATA ............................................................................................ 17
7.1 POWER SUPPLY.................................................................................................... 17
7.2 TEMPERATURE SENSORS ..................................................................................... 17
7.3 FLOW SENSORS .................................................................................................... 17
7.4 TEMPERATURE RANGE ........................................................................................ 17
7.5 AMBIENT TEMPERATURE &TEMPERATURE CLASS............................................ 17
7.6 FLOW SENSOR PLACING....................................................................................... 18
7.7 MAXIMUM VALUES FOR POWER.......................................................................... 18
7.8 DYNAMIC BEHAVIOUR......................................................................................... 18
7.9 DATA OUTPUT INTERFACE................................................................................... 18
7.10 PULSE OUTPUTS (EITHER PULSE OUTPUTS OR PULSE INPUTS ON F2)................ 19
7.11 PULSE INPUTS (EITHER PULSE OUTPUTS OR PULSE INPUTS ON F2).................... 19
7.12 ALARM OUTPUT................................................................................................... 19
8APPENDIX............................................................................................................ 20
8.1 DECIMAL PLACING F2......................................................................................... 20
8.2 ARTICLE NUMBER F2........................................................................................... 21
8.3 DATA OUTPUT TABLE........................................................................................... 22


5
1 Installation
1.1 At delivery
F2 is delivered in the transport mode. This means that only the real
time clock is active. No measurements take place in this position.
The transport mode is indicated by a "no" in the upper left hand
corner.
Before installation commences the meter is to be set in the
operating mode. This is done by pressing and holding the push
button for approximately five seconds, and thus entering one of the
following two modes:
1. Service mode: Normally the calculator is set to enter the
service mode. Here it is possible to alter certain parameters
in the calculator. See also 4. Service. To indicate that the
meter has left transport mode, "no" on the display
extinguishes and is replaced by "00” - service mode.
2. Operating mode: If so ordered, the F2 calculator is set to
enter the operating mode directly. To indicate that the
meter has left transport mode, "no" on the display
extinguishes and is replaced by "10” - operating mode.
To enter the service mode from operating mode, please cf.
4. Service.
Note: In order to complete the installation the integrator must be set to operating mode.
Fig. 1.1c, Operation (normal) mode. The calculator
must be set into this mode in order to measure
YES
Fig. 1.1d, NOT operation mode
Upper display Transport mod
middle display Service mode
Lower display Test mode
NO
Blinking digits
Fig. 1.1a, Transport mode
m³/h kW°Cm³
F2
MadeinSweden Nr:000433
Display button
Fig. 1.1b, F2 display button

6
1.2 Connections
The screw terminal blocks are situated under the cover on the rear side of the calculator.
Note: The covers retaining screws is protected by a labelled sea.
When the calculator is mains powered the will be a permanent power cord.
Note: BR431 power supplied, flow sensor has to be connected to +3V.
Numbering
according to
EN1434
Marking on
terminals Description
9 3V
Flow sensor power supply (+)
10 Kt
Flow sensor(+)
11 0
Flow sensor (-)
5 F
High temperature sensor (H)
6 F
High temperature sensor (H)
7 R
Low temperature sensor (L)
8 R
Low temperature sensor (L)
16 P1
Pulse input/output 1 (+)
17/19 0
Pulse input/output 1 and 2 (-)
18 P2
Pulse input/output 2 (+)
60 A1
Siox input (option)
61 B1
Siox input (option)
24 MBUS M-Bus input
25 MBUS M-Bus input
Fig. 1.2a, Connection terminal F2
11 5 6 7 8 16 17/19 18
A1 B1 MBus MBus
ThisCalculatorisequppped with pulse outputs
9
0FFRR
P1 0 P2 AKt3V
50 60 61 24 25
Fig. 1.2b,Labels on the on the backside of the F2 cover. The picture on top F2 with pulse outputs and
the picture below F2 with pulse inputs.

7
2 Mounting
F2 can be mounted either on the flow sensor or wall mounted.
When the calculator is mounted on the flow sensor, the adapter
provided for this purpose has to be used.
2.1 Mounting on a flow sensor
The adapter allows the calculator to be mounted vertically or
horizontally, see fig. 2.1. Fixate the calculator by pulling the
screw tight.
1. Screw for fixating the adapter
2. Guide rails
3. Adapter
2.2 Lead-through F2 has six holes for connecting cables. To
obtain the environmental class, it is vital
that the diameter of cables is of the
following sizes:
1. Connection flow sensor, temper-
ature sensors, Ø4.3 ± 0.2 mm.
2. Spare (communication)
Ø4.3, ± 0.2 mm.
3. Cable for mains, Ø6.4, +0,-0.2
mm.
2.3 Dimensions
All dimensions are in [mm].
2.
1. 3.
Fig 2.1
2 1 3
Fig. 2.2, Genomföringar på F2
Fig. 2.3b, Dimensions wall adapter
14
18
Fig. 2.3a, F2 dimensions [mm]
m³/h kW
°C
m³
F2
Made in Swed en Nr: 000433
90 33
Ø4.3 (5x)
Ø6.4
112
Cove
r
Service button

8
2.4 Installation test
When installation has been completed simple test can be done
to verify that the calculator has been installed correctly. Wait
until the flow sensor supplies a pulse. This shall result in the
symbol for flow sensor pulse, a square shown on display will
flashing once. Check the display of the correct temperature.
Check that the built-in real time clock is working correctly. If
there is a need to change anything, see the chapter service.
2.5 Momentary values
Momentary power, display sequence ”20”, and momentary flow, display sequence ”21”, are calculated as
follows: As long as the time between the flow sensor pulses is longer than four seconds, flow and power are
calculated for each flow sensor pulse. When the time is less than four seconds, the pulses are summated for
approximately four seconds, where after calculation takes place.
Fig. 2.4d, Display sequence temperature sensors, “22” high (H) and “23” low (L)
Fig. 2.4e, Display sequence “24”, temperature difference
Fig. 2.4c, Display sequence “63” pulse value flow sensor “63” flow sensor placing
Fig. 2.4b, Display sequence ”15” error codes
Fig. 2.4a, Flow pulse indicator

9
3 Handling
3.1 Display
The F2 has an LCD (Liquid Crystal Display), see fig. 3.1a below. The values are displayed in
sequences. The left-hand sequence digit shows the relevant sequence.
The right-hand sequence digit shows which value in the sequence is being displayed. A
short button depression results in a move to the next value in the relevant sequence.
To change sequence, keep the pushbutton depressed until the left-hand sequence digit
starts to increment. Release the button at the required sequence. Change of values in the
selected sequence takes place as described above.
If no button depression occurs during a predetermined period of time the display will
revert to normal position after 60 seconds.
The display is configured as below:
1. sequence digits
2. Flow sensor pulse indicator
3. Relevant value shown here, maximum 7 digits
4. Arrow that indicates unit for displayed value
1.
2.
4.
3.
Fig 3.1a
OPTO interface
m³/h kW°Cm³
F2
MadeinSweden Nr: 000433
Display
button
16
xx
11
10 xx
20 xx xx
70
Fig. 3.1b, Push to toggle to next value. Hold to enter next sequence.
HOLD
PUSH

10
3.2 Display sequence table
Description
10 Accumulated energy (Default position)
11 Accumulated volume according to flow sensor1
12 Display test
13 Accumulated volume for pulse input 1 (Only when F2 fitted with
pulse inputs)
14 Accumulated volume for pulse input 2 (Only when F2 fitted with
pulse inputs)
15 Error code, see Error code
16 Error time, [Minutes]
20 Momentary power
21 Momentary flow
22 High temperature, 0 decimals
23 Low temperature, 0 decimals
24 Temperature difference, 1 decimals
30 Account days2, when values are stored, [YYMMDD]
31 Account days2, Accumulated energy
32 Account days2, Accumulated volume according to flow sensor
33 Account days2, Accumulated volume according to energy
calculation
34 Account days2, Accumulated volume pulse input 1, [m3]
35 Account days2, Accumulated volume pulse input 2, [m3]
36 Possible error code, at time of storage of account days
37 Possible accumulated error time, at the time of storage account
days, [Minutes]
3x Following account days registers (loop back)
40 Monthly registers3, date when values are stored, [YYMMDD]
41 Monthly registers3, Accumulated energy
42 Monthly registers3, Accumulated volume according to flow sensor
43 Monthly registers3, Accumulated volume according to energy
calculation
44 Monthly registers3, Accumulated volume pulse input 1, [m3]
45 Monthly registers3, Accumulated volume pulse input 2, [m3]
46 Possible error code, at time of storage of monthly register
47 Possible accumulated error time, at the time of storage,
[Minutes]
4x Following monthly registers (loop back)
50 Operating time, [Hours]
51 Relevant date, [YYMMDD]
52 Relevant time, [HH.MM]
53 Recommended date for battery replacement, [YYMMDD]
60 Communication address, Primary address
A0 Communication address, Secondary address (normally same as
meter S/N)
bx Calculator serial number (S/N)4
63 Pulse value [l/p]
64 Placing of flow sensor, [H/L], L = Low
70 Accumulated volume corresponding to accumulated energy
73 Last remote read accumulated energy
74 Time since latest remote read accumulated energy, [Hours]
75 Accumulated total error time, [Minutes]
1The calculator has two registers for accumulated volume. Value 11, is
incremented at the rate of arrived flow pulses. The other register, value 70 is
incremented in conjunction with energy calculation.
2In order to change to the next account day, keep pushing the button until the
date starts to increment, then release the button. After the display 37, see
table above, the next account day will display. Note: If the “Push button” is
held again, the display reverts to default position (seq. 10).
3To change to another month, keep pushing the button until the date starts to
increment. Release at the requisite month. After display 47, see above, the next
stored date will be displayed. Note: If the “Display button” is held again, the
display reverts to default position (seq. 10).

11
3.3 Error codes
Error codes are shown in display sequence ”15”.
Code Description
0001 Break in low temperature sensor (L)
0002 Short circuit in low temperature sensor (L)
0004 Break in high temperature sensor (H)
0008 Short circuit in high temperature sensor (H)
0005 Error code combination 0001 + 0004
000A Error code combination 0002 + 0008
0040 Low flow
0080 Mains power failure
0100 Battery replacement recommended
Fig. 3.3, Display sequence “15”error codes


13
4 Service
Certain parameters in F2 can be altered using the display button when F2 is set in the
service mode. Procedure to enter the service sequence:
1. Hold the service button on the rear side of the calculator pressed by using a
small screwdriver. A seal protects the service button.
2. Then hold the display button pressed for 5 seconds.
3. First release the display button the release the service button.
The calculator will be set to service sequence and the display will show ”00” as
confirmation.
To leave the service mode, use the same procedure as entering the service mode.
Note The altered values are not stored until the next sequence is displayed. Example,
changing the real time clock it’s necessary to proceed to date before leaving the
service mode.
Manoeuvre in service sequence, and changing values
By pushing the display button the value for the blinking digit can be altered. To change
next digit “HOLD” the display button pressed until next digit starts to blink. To change
service sequence “HOLD” the display button pressed until next service sequence is
reached.
00: Time
”00” is the real time clock is the format HHMM.
01: Date
”01” the relevant date in the format ”YYMMDD”.
02, 03: Pulse value
”02” and ”03” pulse value for flow sensor. ”02” pulse value and ”03” decimals for pulse
value.
Example 1 The pulse value shall be 2.5 [l/p]. “02” shall be 2500, and ”03” shall be 3.
E.g. 2500 with 3 decimals = 2.5 [l/p].
Example 2 The pulse value shall be 10 [l/p]. “02” = 1000, ”03” = 2. E.g. 10 [l/p].
04, 05: Account days
”04” and ”05” are account days with the format MMDD. F2 can store two. To
deactivate the account days set, MMDD to “0000”.

14
06: Communication address
”06” set communication address. The address is set with four digits.
Example: Address 5 is set as ”0005”.
07: Reset the accumulated error time
”07” the error time can be reset. Format “0 or “1”.
0 = Reset error time
1 = Do not reset error time
08: Flow sensor placing
”08” set flow sensor placing, format ”0” or ”1”.
0 = Flow sensor installed in low
1 = Flow sensor installed in high
09: Recommended date for battery replacement
”09” sets the battery replacement date, format YYMMDD.
0A: Exit service mode
It is possible to leave service mode without breaking the service seal.
In sequence ”0A” depending on which value is set:
0 = Reset error time
1 = return to service sequence “0”
4.1 Service sequence table
Table 4.1, Service sequence,
hh – hour, mm –minute, YY – Year, MM – month, DD – Day
Note: The display sequence in the ”Service mode” may vary depending on calculator configuration.
Service
sequence Description
00 Time [hhmm]
01 Date [YYYMMDD]
02 Pulse value for flow sensor,
Without decimal placing, 4 digits
03 Pulse value decimal placing, 0-4
04 Account days 1, MMDD
05 Account days 2, MMDD
06 Primary communication address, set
with 3 digits), e.g. ”5” is set ”005”.
07 Reset stored error time
0 = Reset stored error time (default)
1 = Do not reset error time
08 Flow sensor placing,
0 = Installed at low end (L)
1 = Installed at high end (H)
09 Recommended battery replacement
date [YYMMDD] Do not change
without consulting with Metrima AB.
0A Exit service sequence,
1 = EXIT
2 = return to service sequence ”00”
Fig. 4.1a, Service and test buttons
Se rvic e
Test
Sa ve d a t a
Service button
Test button
Fig. 4.1b, Test key

15
5 Verifying the calculator
Verification of the calculator's measurement accuracy is undertaken in the test mode, where the
energy value/flow sensor pulse is issued via the HF-output at the service adapter. For each flow
sensor pulse, measurement takes place on the temperature sensors and a pulse burst
corresponding to the measured energy of the meter is issued.
To test (verify) the measurement accuracy of the calculator by means of HF-pulses proceed as
follows:
1. While short circuiting the test button with a “Test key”, see fig. 4.1a and 4.1b, hold the “Push
button” until the display mode changes.
2. The calculator now enters test mode. This is indicated by a flash symbol being displayed.
3. Connect fixed resistance for simulation of Pt100 via terminal block units Nos. 5-6 (flow) and
7-8 (return).
4. Connect a pulse generator via terminal block unit Nos. 10-11 (connection 11 is ground) in
order to simulate flow sensor pulses. Note: Voltage level is max. 3V.
5. Connect an OPTO-head/interface with HF-pulse interface at the front.
6. Simulate a flow sensor pulse after which the meter issues an (approximately) 20 kHz pulse
burst corresponding to 100*k*dt pulses via the HF-output. “k” is the energy factor.
(kWh/°C/m3) and dt is the difference between simulated flow and return temperatures.
Example: Rf=138.50 (100.00°C), Rr=127.07 (70.00°C) => dt=30.00°C, k=1.141 gives
100*1.141*30 = 3423 pulses
7. The next flow sensor pulse can be sent immediately after the HF-pulse burst from the meter
has been dispatched.
To leave test mode proceed as follows:
1. While short circuiting the test button hold the “Display Button”, see fig.1.1b.
2. The calculator now enters operation mode.
To verify (test) the measurement accuracy of the meter with help of the display, first set up
connections in accordance with points 3 and 4 above for testing by means of HF-pulses. Testing
is undertaken in the meter's operation mode. Proceed as follows:
1. Supply flow sensor pulses until the energy display is incremented one step.
2. Supply flow sensor pulses with a maximum frequency of 12 Hz until the display has been
stepped appropriate numbers of steps.
3. Errors in testing decrease with the number of steps made during the test. If the meter is
programmed for 1.0 litre/pulse and resolution for display of energy is 0.001MWh, this means
that 10 steps on the display correspond to 288.85 pulses from the flow sensor with selected
temperatures in accordance with the above. The testing error is maximum + - 1 pulse, which,
in the example, corresponds to 0.35%.

16
6 Seals
1. Service seals
2. Test seal
3. Electronic seal
4. Installation seals
SVM
SVM SVM
SVM
SVM
1 2
3
4
Fig. 6, Sticker seals

17
7 Technical data
7.1 Power supply
Battery 3V – 2,2Ah
Operation time max. 10 years
Mains 230V±10%, 45-65Hz
Table 7.1, Power supply
7.2 Temperature sensors
Approved and matching pares of temperature sensors of the type Pt 100 or Pt 500 are to
be used. Maximum sensor current (RMS) 4 µA for PT100
Cable area
[mm2] Maximum cable length for
PT100 sensors [m]
0.22 2.5
0.50 5.0
0.75 7.5
1.50 15.0
Table 7.2, Cable areas for Pt100
7.3 Flow sensors
Flow sensor with pulse output.
Max. frequency [Hz] 12
Pulse value range [l/p] 0.0001-9999
Min. pulse length [ms] 40
Max. voltage [V] 3
Max. cable length [m] 15
Table 7.3, Technical specifications
7.4 Temperature range
Temperature range 0 - 190°C
Temperature difference 2 – 120K
Table 7.4, Temperature range
7.5 Ambient temperature & temperature class
F2 complies with the prerequisites for Environmental Class C according to EN1434.
Ambient temperature
storage/transport
-20°C to +70°C
Ambient temperature
operation
+5°C to +55°C
Table 7.5. Ambient temperature ranges

18
7.6 Flow sensor placing
F2 can be configured for flow sensor placement in high or low end of the pipe (supply
or return pipe). This is marked H = high or L = low in display sequence “64”.
Figure 7.6, Flow sensor placing
7.7 Maximum values for power
The values below are valid for energy unit [MWh] and standard decimal setting
Pulse value
[l/p] Maximum power
[ MW ]
1.0 3.3
10.0 33.0
100.0 330.0
2.5 3.3
25.0 33.0
250.0 330.0
Table 7.7, maximum power at pulse values
7.8 Dynamic behaviour
Measurements are undertaken for each flow sensor pulse, provided the time between the
pulses is five (5) seconds or longer. If the time between pulses is less than five seconds,
measurement takes place each five seconds. When the period between the flow sensor
pulses exceeds 60 seconds, a measurement takes place every 60th seconds, where only
the temperatures are updated.
7.9 Data output interface
M-Bus acc. to
EN1434-3 Via OPTO-interface (EN60870-5)
bus connection (terminals)
Table 7.9, data output interfaces

19
7.10 Pulse outputs
(either pulse outputs or pulse inputs on F2)
F2 can be equipped with two pulse outputs as standard of the type “Open collector” for
energy (pulse output 1) and volume (pulse output 2).
The last digit and the energy unit will reveal the pulse weight of the pulses. Example:
sequence “10” (energy) on display is shown “1001.01” MWh => pulse weight = 0.01
MWh/pulse.
Pulse output 1
Energy; one (1) pulse for each update of the last digit in the energy register (seq. “10”).
Pulse output 2
Volume, one (1) pulse for each update of the last digit in the flow register (seq. “11”).
Pulse value [ms] 250
Voltage [V] 3 – 30
Maximum current [µA] 20
Table 7.10, Pulse output data
7.11 Pulse inputs
(either pulse outputs or pulse inputs on F2)
F2 is equipped with two pulse inputs as standard. The pulse inputs can be
used for measuring of other meter with pulse outputs, such as cold and hot
water meters, gas, electricity meters and other meters. The pulse inputs can
be set as volume registers. These registers accumulate the pulses into two
volume registers with the value [m3].
Frequency [Hz] 12
Min. pulse duration [ms] 40
Max. Voltage [V] 3
Table 7.11, Pulse inputs
7.12 Alarm output
The F2 is equipped with one alarm output as standard of the type “Open collector”. The
alarm output sends a pulse every hour as long as an error code exists. The pulse duration
250 [ms] for pulse and alarm output can be altered using the “Service program” version
2 or higher in 125 [ms] steps.
Alarm frequency when an
error exists Once every hour
Pulse width [ms] 250
Table 7.12, Alarm output
+3V
Fig. 7.11, Pulse output

8 Appendix
8.1 Decimal placing F2
The decimal setting for F2 follows a ”de facto” standard for utilities
Pulse value
[l/p] MWh GJ m³ KWh MBTU kW m³/h m³
1.0 0.001 0.001 0.001 0.1 0.001 0.01 0.001 0.001
10 0.01 0.01 0.01 1 0.01 0.1 0.01 0.01
100 0.1 0.1 0.1 - 0.1 1 0.1 0.1
1000 1 1 1 - 1 1 1 1
2.5 0.001 0.01 0.01 0.1 0.01 0.01 0.001 0.01
25 0.01 0.1 0.1 1 0.1 0.1 0.01 0.1
250 0.1 1 1 - 1 1 0.1 1
2500 1 1 1 - 1 1 1 1
Table 8.1, Options marked ”-” should not be used.
Table of contents
Other Metrima Calculator manuals
