metrotek Bercut-ET User manual

Ethernet/Gigabit Ethernet Tester Analyzer
Bercut-ET
Operations manual
Version 1.1.0, 2009
Metrotek

c
Metrotek, 2006—2009
No part of this document may be reproduced in any form or by any means
without the express written permission of Metrotek. Metrotek retains the
right to make changes to the hardware, software of Bercut-ET and to this
document at any time, without notice.

3
Contents
1 General description 5
2 Supply kit 7
3 Setting-up procedures 9
4 Overview 11
4.1 Front panel . . . . . . . . . . . . . . . . . . . . . . . . . . . . . 11
4.2 External connectors . . . . . . . . . . . . . . . . . . . . . . . . 14
4.3 Status bar . . . . . . . . . . . . . . . . . . . . . . . . . . . . . . 15
5 Analysis. Typical tasks and solutions 17
5.1 Typical tasks . . . . . . . . . . . . . . . . . . . . . . . . . . . . 17
5.2 RFC 2544 methodology . . . . . . . . . . . . . . . . . . . . . . 17
5.3 Connecting device and starting to operate . . . . . . . . . . . . 21
5.3.1 Device connection schemes . . . . . . . . . . . . . . . . 21
5.4 RFC 2544. General settings . . . . . . . . . . . . . . . . . . . . 23
5.4.1 Setting up header . . . . . . . . . . . . . . . . . . . . . 23
5.4.2 Setting up header (advanced) . . . . . . . . . . . . . . . 24
5.4.3 RFC 2544. MPLS settings . . . . . . . . . . . . . . . . . 26
5.4.4 Test topology . . . . . . . . . . . . . . . . . . . . . . . . 27
5.4.5 Selecting frame size . . . . . . . . . . . . . . . . . . . . 27
5.5 RFC 2544. Test parameters setup . . . . . . . . . . . . . . . . . 28
5.5.1 Throughput test settings . . . . . . . . . . . . . . . . . 28
5.5.2 Latency test settings . . . . . . . . . . . . . . . . . . . . 28
5.5.3 Frame loss test settings . . . . . . . . . . . . . . . . . . 29
5.5.4 Back-to-back test settings . . . . . . . . . . . . . . . . . 30
5.5.5 Advanced . . . . . . . . . . . . . . . . . . . . . . . . . . 30
5.6 RFC 2544. Performing analysis . . . . . . . . . . . . . . . . . . 32
5.6.1 Throughput. Test results . . . . . . . . . . . . . . . . . 32
5.6.2 Latency. Test results . . . . . . . . . . . . . . . . . . . . 33
5.6.3 Frame loss. Test results . . . . . . . . . . . . . . . . . . 34
5.6.4 Back-to-back. Test results . . . . . . . . . . . . . . . . . 35
5.7 Asymmetric test . . . . . . . . . . . . . . . . . . . . . . . . . . 36
Bercut-ET. Operations manual

4 CONTENTS
5.8 Complex traffic . . . . . . . . . . . . . . . . . . . . . . . . . . . 37
5.8.1 Complex traffic. MPLS settings . . . . . . . . . . . . . . 42
5.9 Loopback . . . . . . . . . . . . . . . . . . . . . . . . . . . . . . 43
5.9.1 Configuring L2 Loopback . . . . . . . . . . . . . . . . . 44
5.9.2 Configuring L3 Loopback . . . . . . . . . . . . . . . . . 46
5.10 OAM . . . . . . . . . . . . . . . . . . . . . . . . . . . . . . . . . 48
5.11 ET discovery . . . . . . . . . . . . . . . . . . . . . . . . . . . . 51
5.12 Testing TCP/IP . . . . . . . . . . . . . . . . . . . . . . . . . . 53
5.12.1 Ping . . . . . . . . . . . . . . . . . . . . . . . . . . . . . 53
5.12.2 Traceroute . . . . . . . . . . . . . . . . . . . . . . . . . 56
5.12.3 DNS (DNS lookup) . . . . . . . . . . . . . . . . . . . . . 58
5.12.4 ARP monitor . . . . . . . . . . . . . . . . . . . . . . . . 59
5.12.5 TCP-client . . . . . . . . . . . . . . . . . . . . . . . . . 60
5.13 Pass through . . . . . . . . . . . . . . . . . . . . . . . . . . . . 64
5.14 Cable diagnostics . . . . . . . . . . . . . . . . . . . . . . . . . . 65
5.15 BERT . . . . . . . . . . . . . . . . . . . . . . . . . . . . . . . . 68
5.15.1 BERT. MPLS settings . . . . . . . . . . . . . . . . . . . 72
5.15.2 Connection schemes . . . . . . . . . . . . . . . . . . . . 73
5.16 Packet jitter . . . . . . . . . . . . . . . . . . . . . . . . . . . . . 75
5.17 Test traffic . . . . . . . . . . . . . . . . . . . . . . . . . . . . . 78
5.17.1 Test traffic. MPLS settings . . . . . . . . . . . . . . . . 79
5.18 Statistics . . . . . . . . . . . . . . . . . . . . . . . . . . . . . . 81
5.18.1 Aggregated statistics for two ports . . . . . . . . . . . . 81
5.18.2 Stats by frame types . . . . . . . . . . . . . . . . . . . . 82
5.18.3 Stats by frame size . . . . . . . . . . . . . . . . . . . . . 82
5.18.4 Stats by layer . . . . . . . . . . . . . . . . . . . . . . . . 83
5.18.5 Stats by frame errors . . . . . . . . . . . . . . . . . . . . 83
5.19 Saving test results . . . . . . . . . . . . . . . . . . . . . . . . . 84
5.20 Network setup . . . . . . . . . . . . . . . . . . . . . . . . . . . 86
5.21 Interface setup . . . . . . . . . . . . . . . . . . . . . . . . . . . 87
5.22 Device setup . . . . . . . . . . . . . . . . . . . . . . . . . . . . 90
5.22.1 Display setup . . . . . . . . . . . . . . . . . . . . . . . . 90
5.22.2 Basic settings . . . . . . . . . . . . . . . . . . . . . . . . 90
5.22.3 Information . . . . . . . . . . . . . . . . . . . . . . . . . 91
5.22.4 SFP information . . . . . . . . . . . . . . . . . . . . . . 92
5.22.5 Battery . . . . . . . . . . . . . . . . . . . . . . . . . . . 92
5.22.6 Managing options . . . . . . . . . . . . . . . . . . . . . 92
Bercut-ET. Operations manual

CONTENTS 5
6 Remote control 95
6.1 Management in the Terminal mode . . . . . . . . . . . . . . . . 95
6.1.1 Terminal mode connection settings . . . . . . . . . . . . 95
6.1.2 Updating analyzer software . . . . . . . . . . . . . . . . 96
6.2 Remote control via TELNET . . . . . . . . . . . . . . . . . . . 98
6.3 Remote control via WWW-interface . . . . . . . . . . . . . . . 98
6.4 Screen shot . . . . . . . . . . . . . . . . . . . . . . . . . . . . . 99
A Ethernet frame structure 101
B Remote control commands 103
C Specifications and Technical characteristics 109
D Troubleshooting 111
Bibliography 113
Bercut-ET. Operations manual

6
Bercut-ET. Operations manual

7
1. General description
Ethernet/Gigabit Ethernet tester-analyzer Bercut-ET (referred to as de-
vice, analyzer) is intended for performing analysis and diagnostic tests ac-
cording to the RFC 2544 [5] methodology, checking the state of a cable, and
checking link connectivity. In addition, the analyzer supports operations in
the loopback mode, and statistics getting for received and transmitted traffic.
Bercut-ET analyzer provides the following options.
1. Traffic generating and analyzing at the data link (MAC) and net-
work (IP) layers.
2. Getting and displaying statistics about traffic received and transmitted
at the physical, data link, and network layer.
3. RFC-2544 measurements: Throughput, Latency, Frame Loss, Back-to-
Back.
4. Copper cable faults diagnostics.
5. Ethernet loopback for physical, data link, network and transport layers
of the OSI model.
6. Loopback control via OAM protocol.
7. Bit Error Rate Testing (BERT).
8. Packet jitter measurements.
9. IP testing (ping, traceroute, telnet/http requests).
Bercut-ET. Operations manual

8
Bercut-ET. Operations manual

9
2. Supply kit
Table 2.1. Supply kit
Item Quantity
Ethernet/Gigabit Ethernet tester-analyzer Bercut-ET de-
vice 1
Ethernet/Gigabit Ethernet tester-analyzer Bercut-ET. Op-
erational manual 1
Power supply unit (12 V, 1,5 A) 1
Cable (220 V, 3-polar) 1
USB cable 1
Ethernet cable 1
Bercut-ET. Operations manual

10
Bercut-ET. Operations manual

11
3. Setting-up procedures
1. Get the tester from the box and make the external inspection.
2. Keep the tester in normal environmental conditions for at least 2 hours
(if the tester has been previously kept in conditions distinct from nor-
mal).
3. Plug-in the power supply unit to the electric network (if you use mains
voltage 110–240 V with the 50–60 Hz frequency).
4. Switch on the tester.
Bercut-ET. Operations manual

12
Bercut-ET. Operations manual
13
4. Overview
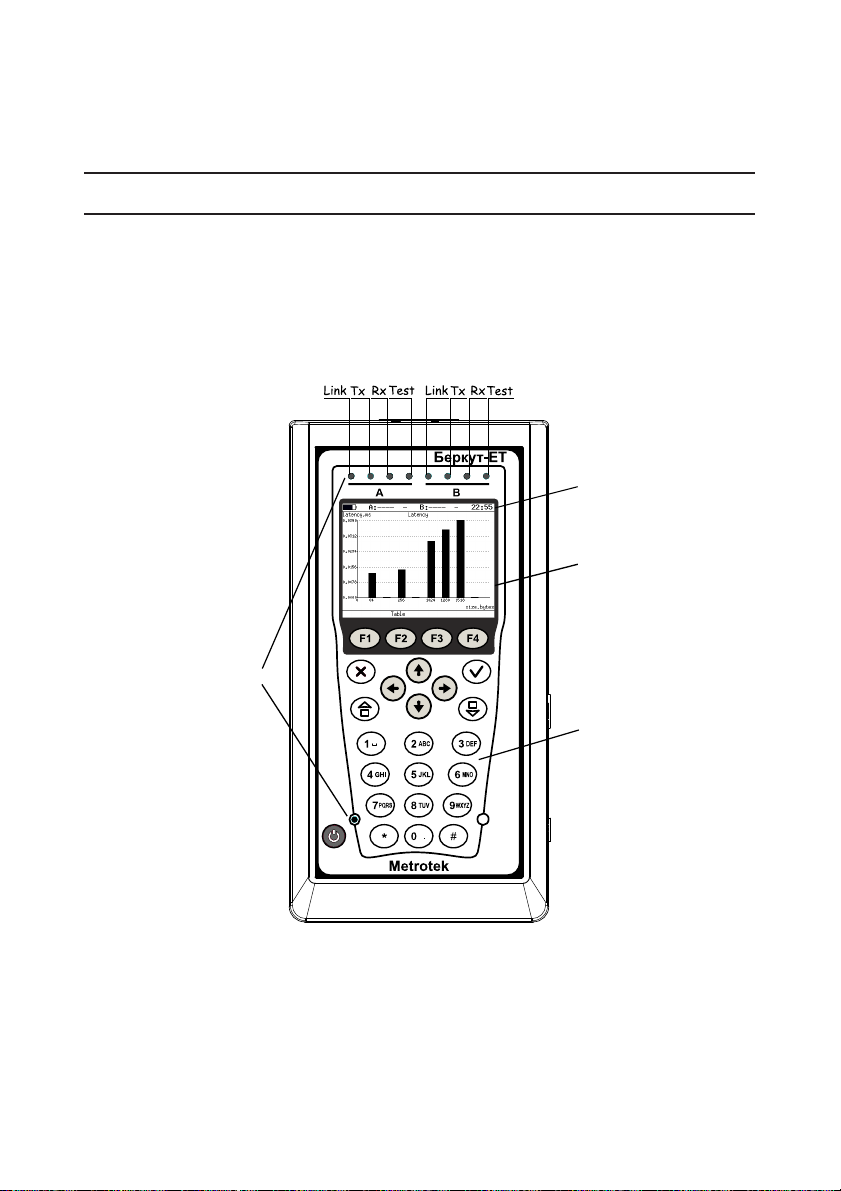
4.1 Front panel
Front panel of Bercut-ET analyzer is shown on the figure 4.1.
1
2
3
4
Figure 4.1. Front panel
1 – LEDs.
Three-color LEDs at the top of the front panel provide information about
interface state.
Bercut-ET. Operations manual

14 Overview
LEDs description
LEDs which are marked as Link on the fig. 4.1 show the connection
state:
•green — connection to DUT is successfully established;
•red — no connection.
LEDs which are marked as Tx on the fig. 4.1 show the data transmission
state:
•green (blinking or constant light) — data is transmitted at the moment;
•off — no data transmission at the moment.
LEDs which are marked as Rx on the fig. 4.1 show the data receiving
state:
•green (blinking or constant light) — data packets are received at the
moment;
•off — no data is received at the moment.
LEDs which are marked as Test on the fig. 4.1 show the test state:
•green — test is running at the moment;
•green (blinking) — Loopback mode is on at the moment.
LEDs in the bottom part of the front panel light up when the power supply
unit is plugged in:
•green — the battery is charged;
•green (blinking) — the battery is charging;
•green (twinkling) — updating analyzer software.
2 – Status bar.
See section 4.3 for details.
3 – Display.
Color graphic display.
4 – Keyboard.
Keys function:
•—Switch device on/off
To switch device on/off press and hold the button for 1–2 seconds.
•—Main menu
Press the button to return to the Main menu.
•—Enter
Bercut-ET. Operations manual
4.1 Front panel 15
–in the menu mode, if the selected item is highlited, pressing the
button will open the corresponding menu and display the cor-
responding screen;
–in the data entering mode, pressing the button will switch to edit
mode or switch to the parameter selecting menu. If the button
is used for the data input, then to return to the previous menu,
press the button.
•—Cancel/Escape
–in menu mode, press the button to return one level up (to the
previous menu);
–in data setup mode, press the button to cancel set values.
•—Infobar
When the button is pressed, the LEDs captions are displayed (back-
ground color corresponds to the LED’s color).
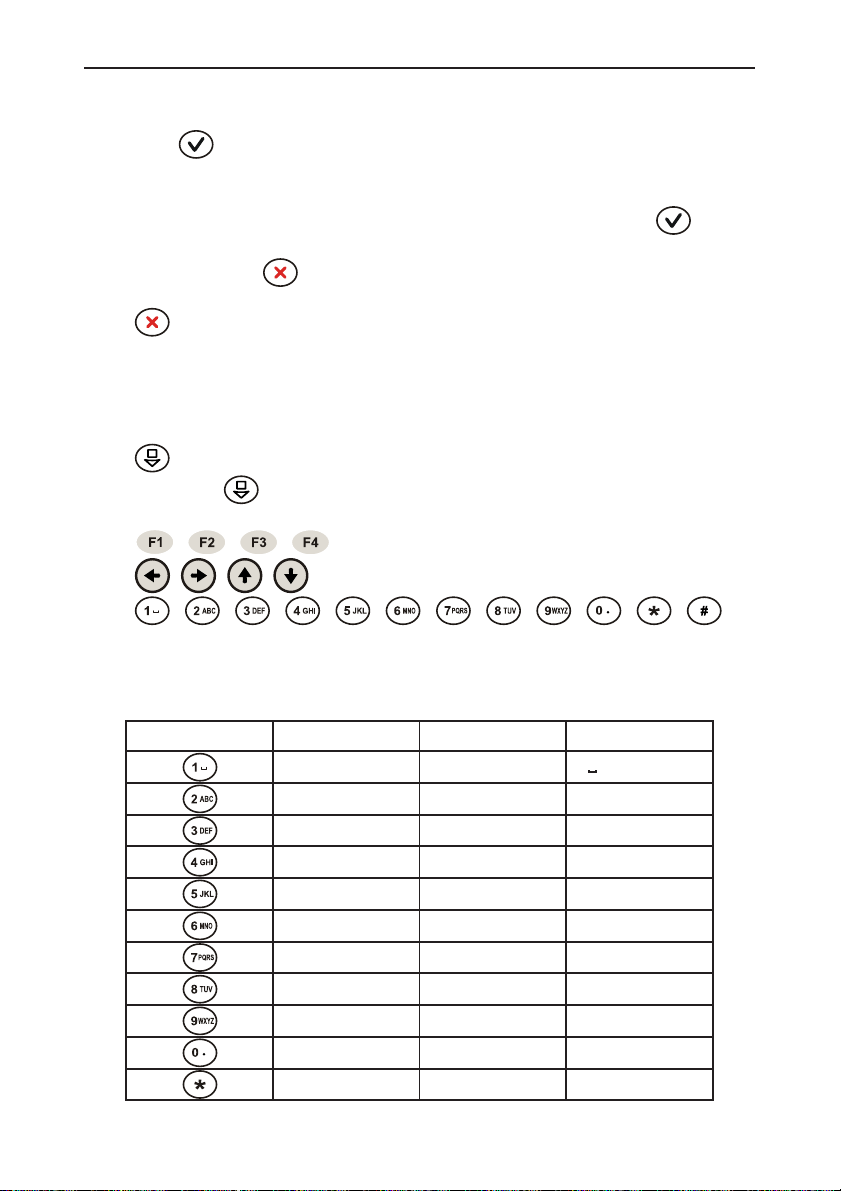
•, , , — Functional buttons.
•, , , — Cursor moving buttons.
•,,,,,,,,,,, —
Digits, letters, and symbols input buttons.
Table 4.1. Digits, letters, and symbols
Button Digits Letters Symbols
1 - - - @ / –
2 a b c - - -
3 d e f - - -
4 g h i - - -
5 j k l - - -
6 m n o - - -
7 p q r s - - -
8 t u v - - -
9 w x y z - - -
0 - - - . , : ;
- - - - - - *
Bercut-ET. Operations manual

16 Overview
4.2 External connectors
Location of external connectors on the top and side panels is shown on
the figures 4.2 and 4.3.
Figure 4.2. Top panel
Figure 4.3. Side panel
Tester connectors and equipment to be connected are described in the
table 4.2.
Table 4.2. Connectors description
Designation Description Connected equipment
A, B RJ-45 connectors to connect to
the tested network or
equipment (supported rates
10/100/1000 Mbps)
Ethernet cable
SFP-module connectors SFP-module
LAN1Remote control connector
(supported rates 10/100 Mbps)
Ethernet cable
USB Connect to PC via
USB-interface
USB cable
12 V External power unit connector Power supply unit
1Connector availability depends on the tester version.
Bercut-ET. Operations manual

4.3 Status bar 17
4.3 Status bar
Status bar shows information about the following parameters (left to
right):
•battery charge state;
•transmission rate for the port A;
Note: if you connect SFP-module, white color of this inscription will
be changed to yellow.
•test that is running now via port A;
•transmission rate for the port B;
Note: if you connect SFP-module, white color of this inscription will
be changed to yellow.
•test that is running now via port B;
•current time.
Type of test running via port A(B) is marked in the status bar with the
following abbreviations:
•THR — throughput analysis;
•LAT — latency analysis;
•BTB — back-to-back test;
•FRL — frameloss test;
•LB1 — loopback at the Physical layer (layer 1);
•LB2 — loopback at the Data Link layer (layer 2);
•LB3 — loopback at the Network layer (layer 3);
•LB4 — loopback at the Transport layer (layer 4)
•BER — bit error rate test;
•PJ — packet jitter analysis;
•GEN — test flow generation;
•J+G — packet jitter analisys and test flow generation on the same
port;
•PTH — pass through mode.
Bercut-ET. Operations manual

18
Bercut-ET. Operations manual

19
5. Analysis. Typical tasks and solutions
5.1 Typical tasks
The main task for the Ethernet-network testing is the estimation of com-
pliance of the tested services with the service level agreement (SLA) between
operators and subscribers. In the first place, the task concerns the guaran-
teed Quality of Service (QoS) providing described by the following parameters:
throughput, frame loss rate, latency, and back-to-back. These parameters are
tested according to the RFC 2544 methodology. To test availability of specific
address within or out of a network and to analyze routes of data transmission,
Ping and Traceroute utilities are used. The Loopback mode allows redirecting
traffic at the physical, data link, network and transport OSI layers.
5.2 RFC 2544 methodology
The RFC 2544 methodology defines a specific set of tests to measure and
report the performance characteristics of network devices.
According to the RFC 2544, for Ethernet-network test the following frame
sizes are recommended to be used: 64, 128, 256, 512, 1024, 1280, and
1518 bytes. Taking into consideration the tests defined by the methodology
(throughput, latency, frame loss rate, and back-to-back), this methodology is
the de-facto standard for analyzing the Ethernet-network performance.
Bercut-ET analyzer supports four standard tests defined by the RFC 2544
methodology.
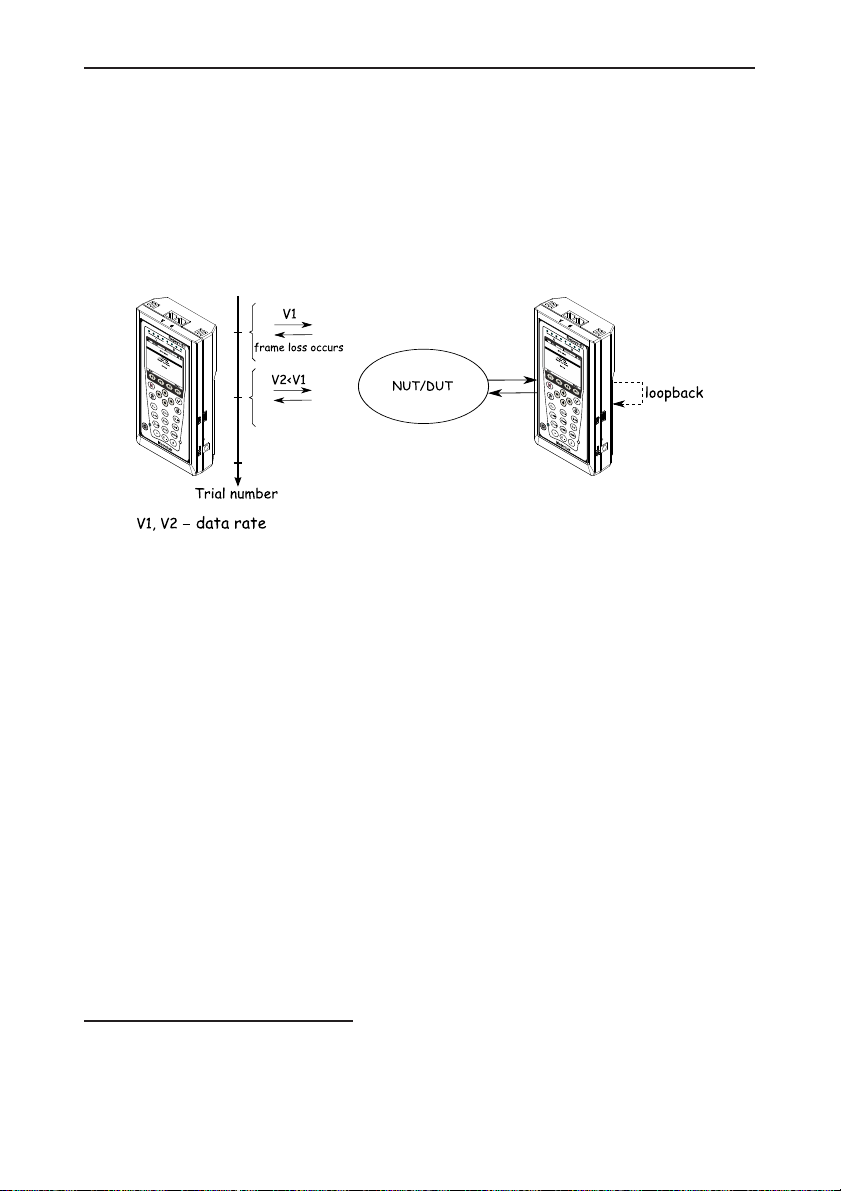
1. Throughput. This test allows to determine the maximum possible rate
for the Ethernet-networks equipment.
Throughput — the fastest rate at which the number of test frames
transmitted by the DUT is equal to the number of test frames sent to
it by the test equipment.1
When measuring the throughput, specific number of frames with min-
1The following terms are synonyms in the tests descriptions: frame, datagram, and
packet.
Bercut-ET. Operations manual
20 Analysis. Typical tasks and solutions
imum interframe gap is sent to DUT2(fig. 5.1 3). Then, the analyzer
counts the frames that are transmitted by the DUT. If the fewer frames
are received than transmitted, the interframe gap is increased and the
test reruns.
Note: relation between interframe gap and load is inverse,
thus, the bigger gap value is, the lesser the load is.
.
.
.
.
1
2
Figure 5.1. Throughput
2. Latency. This test allows to analyze the time during which a frame will
be transmitted from the source to destination and then back to source.
The latency is one of the major parameters for the real-time services
operation.
When analyzing the latency, the throughput for DUT at each of the
listed frame sizes is determined first. Then, a stream of frames at a par-
ticular frame size is sent through the DUT at the determined through-
put rate to a specific destination. The minimum duration of the stream
transmission is set as 120 seconds (user can specify alternative value
in the range of 1–2886 seconds). In a specific time, an identifying tag
is included into one frame with the type of tag being implementation
dependent. The time at which this frame is fully transmitted is record-
ed as a Ta time stamp value. The receiver port of the analyzer then
recognizes the tag information in the frame stream and records the time
at which the tagged frame was received (Tb value).
The latency value is the difference between time stamp Tb and time
stamp Ta values.
2For the current test and tests described further, all steps are performed automatically.
3At the figures, only one of connection type is shown. For other possible connection
schemes please refer to the see section 5.3.
Bercut-ET. Operations manual
Table of contents
Other metrotek Measuring Instrument manuals


 instruction manual")


