Miles TimePod 5330A Operation manual

®
5330A Programmable Cross Spectrum Analyzer
Operation and Service
Revision 1.2a
September 20, 2017


3
Table of Contents
Introduction ............................................................................................................................................ 9
Specifications ........................................................................................................................................ 11
Getting started ...................................................................................................................................... 13
What’s in the box?............................................................................................................................. 13
Sales and technical support ............................................................................................................... 13
USB driver and software installation.................................................................................................. 15
Front panel features .......................................................................................................................... 17
Rear panel features ........................................................................................................................... 19
Choosing an external reference ......................................................................................................... 20
Making your first measurements ....................................................................................................... 21
Tips for new users.............................................................................................................................. 24
A brief architectural note................................................................................................................... 27
Making measurements.......................................................................................................................... 29
“What’s all this ADEV stuff, anyhow?” ............................................................................................... 31
Allan Deviation (a) ......................................................................................................................... 32
Modified Allan Deviation (m) ......................................................................................................... 32
Hadamard Deviation (h)................................................................................................................. 33
Time Deviation (t) .......................................................................................................................... 33
Examining changes in stability over time........................................................................................ 34
Common artifacts in ADEV and related measurements .................................................................. 35
Hints for xDEV measurements ....................................................................................................... 40
Working with phase- and frequency-difference traces....................................................................... 43
Phase difference (Original) (w)....................................................................................................... 43
Phase difference (Unwrapped) (p) ................................................................................................. 43
Frequency difference (f)................................................................................................................. 44
How does TimeLab measure frequency?........................................................................................ 45
Phase/frequency measurements with the TimePod ....................................................................... 45
Measurement initialization............................................................................................................ 46
Examining traces in detail .............................................................................................................. 48

4
Navigating zoomed graphs............................................................................................................. 49
Hints for phase/frequency stability measurements ........................................................................ 51
Phase noise, AM noise, and jitter....................................................................................................... 53
Integrated noise and jitter measurement....................................................................................... 54
The spur table................................................................................................................................ 55
Show or hide known spurs ............................................................................................................. 55
Spur measurement options............................................................................................................ 56
Is it a spur, or isn’t it?..................................................................................................................... 57
Understanding instrument spurs.................................................................................................... 57
Hints for noise measurements ....................................................................................................... 59
TimeLab command reference ................................................................................................................ 61
File menu........................................................................................................................................... 63
Load .TIM file (l)............................................................................................................................. 63
Save image or .TIM file (s).............................................................................................................. 63
Copy image to clipboard (Ctrl-c)..................................................................................................... 64
Import .PNP phase noise data (N) .................................................................................................. 64
Import ASCII phase or frequency data (L) ....................................................................................... 64
Export ASCII phase data (x) ............................................................................................................ 65
Export ASCII frequency data (X) ..................................................................................................... 65
Export binary phase data ............................................................................................................... 66
Export phase data to Stable32 (Ctrl-x)............................................................................................ 66
Export xDEV trace .......................................................................................................................... 67
Export AM/PM noise trace............................................................................................................. 67
Export AM/PM spur table .............................................................................................................. 67
Print image .................................................................................................................................... 68
Scale file dialogs by window size.................................................................................................... 68
Warn before exiting with unsaved plots......................................................................................... 68
Reset all parameters, options, and settings at next startup ............................................................ 68
Close selected plot (Del) ................................................................................................................ 68
Close all visible plots (Home) ......................................................................................................... 69
Delete selected plot’s .TIM file (Ctrl-Del)........................................................................................ 69
Quit (q or Esc) ................................................................................................................................ 69

5
Edit Menu.......................................................................................................................................... 71
Trace properties (e) ....................................................................................................................... 71
Flatten selected or zoomed phase data (Ctrl-f)............................................................................... 73
Remove selected or zoomed phase data (F4) ................................................................................. 74
Subtract global linear phase trend (frequency offset) (Ctrl-o)......................................................... 75
Subtract global linear frequency trend (drift line) (Ctrl-l)................................................................ 75
Subtract quadratic linear frequency trend (drift curve) (Ctrl-q) ...................................................... 75
Undo last flatten or subtract operation (Ctrl-z) .............................................................................. 75
Trace Menu ....................................................................................................................................... 77
Phase/frequency traces begin at zero (z) ....................................................................................... 77
Show linear phase/frequency residual (r)....................................................................................... 77
Show linear phase/frequency trend (Ctrl-t).................................................................................... 79
Phase/frequency Y axis unlocked in zoom mode (y) ....................................................................... 80
Averaging window for phase/frequency traces (g) ......................................................................... 80
Increase averaging window (Ctrl +) ................................................................................................ 80
Decrease averaging window (Ctrl -)................................................................................................ 80
Draw xDEV traces with spline interpolation (i) ............................................................................... 82
Show xDEV error bars (Ctrl-e) ........................................................................................................ 82
Clip xDEV traces by noise bandwidth (Ctrl-b).................................................................................. 83
Clip xDEV traces by confidence (Ctrl-v)........................................................................................... 83
Show correlation gain for selected noise trace (Ctrl-g) ................................................................... 83
Show FFT segment filter slopes (Ctrl-i) ........................................................................................... 83
Show imaginary part of cross spectrum (Ctrl-F3) ............................................................................ 84
Show estimated instrument noise (F2)........................................................................................... 84
Mark spurs in noise traces (Ctrl-m) ................................................................................................ 85
Suppress spurs in noise traces (Ctrl-s) ............................................................................................ 85
Smooth noise traces (Ctrl-w).......................................................................................................... 85
Show raw PN channel trace(s) (Ctrl-r) ............................................................................................ 85
Show AM noise in PN view (F8)...................................................................................................... 86
Tick marks (k)................................................................................................................................. 86
Toggle trace thickness for current measurement (T) ...................................................................... 87
Display Menu .................................................................................................................................... 89

6
Edit colors...................................................................................................................................... 89
High contrast (C)............................................................................................................................ 89
Numeric table (Ctrl-n).................................................................................................................... 90
Show cursor time (Ss) .................................................................................................................... 90
Show cursor time (Hh:Mm:Ss)........................................................................................................ 90
Show cursor time/datestamp......................................................................................................... 90
Do not show cursor values............................................................................................................. 90
Browse plots one at a time (b) ....................................................................................................... 91
Overlay all loaded plots (o) ............................................................................................................ 91
Toggle visibility of selected plot (v) ................................................................................................ 91
Select next plot in chart (+ or down arrow) .................................................................................... 91
Select previous plot in chart (- or up arrow) ................................................................................... 91
Move selected plot up (Ctrl-up arrow) ........................................................................................... 91
Move selected plot down (Ctrl-down arrow).................................................................................. 91
X zoom in ( ] )................................................................................................................................. 92
X zoom out ( [ ) .............................................................................................................................. 92
Y zoom in ( } )................................................................................................................................. 92
Y zoom out ( { ) .............................................................................................................................. 92
Decrease font size ( ( or Ctrl-mouse wheel )................................................................................... 92
Increase font size ( ) or Ctrl-mouse wheel ) .................................................................................... 92
Legend Menu..................................................................................................................................... 93
Measurement Menu .......................................................................................................................... 95
Masks Menu...................................................................................................................................... 97
Clear mask selection ...................................................................................................................... 97
User-defined mask entries............................................................................................................. 97
Edit mask definitions . . . ................................................................................................................ 98
Scripts Menu ..................................................................................................................................... 99
Creating a new test script .............................................................................................................. 99
Run script …................................................................................................................................. 100
Edit script … ................................................................................................................................. 100
Delete script …............................................................................................................................. 100
Run last-executed script (Shift-Space) .......................................................................................... 100

7
Toggle script console for selected plot (F11) ................................................................................ 101
Stop all running scripts (F12)........................................................................................................ 101
Acquire Menu.................................................................................................................................. 103
Miles Design TimePod.................................................................................................................. 103
Acquire from counter in Talk-Only mode ..................................................................................... 103
Acquire from live ASCII file........................................................................................................... 104
HP 53131A/53132A/53181A ........................................................................................................ 104
HP 53220A/53230A ..................................................................................................................... 104
HP 5335A..................................................................................................................................... 104
HP 5370A/B ................................................................................................................................. 104
HP 5371A/5372A ......................................................................................................................... 104
Philips/Fluke PM6680 .................................................................................................................. 104
Picotest/Array U6200A series ...................................................................................................... 104
Stanford Research SR620 ............................................................................................................. 104
Wavecrest DTS-2050/2070 series................................................................................................. 104
Symmetricom 5115A / 5120A / 5125A (Frequency stability)......................................................... 105
Symmetricom 5115A / 5120A / 5125A (Phase noise).................................................................... 105
Stop/repeat acquisition (Space) ................................................................................................... 105
Abort and retrigger selected acquisition (Ctrl-a)........................................................................... 106
Keep and retrigger selected acquisition (Ctrl-k)............................................................................ 106
Enable deferred acquisition (Ctrl-d) ............................................................................................. 107
Trigger deferred acquisition(s) (Enter) ......................................................................................... 107
Configure deferred acquisition..................................................................................................... 107
Help Menu....................................................................................................................................... 109
User guide (F1) ............................................................................................................................ 109
About TimeLab ............................................................................................................................ 109
Debug mode ................................................................................................................................ 109
Check for updates (Ctrl-u) ............................................................................................................ 109
Appendix: Some examples of residual performance ............................................................................ 111
Appendix: JavaScript API Function Reference ...................................................................................... 115
Appendix: The STREAM.EXE Phase/Frequency Data Server .................................................................. 135
Launching STREAM.EXE ................................................................................................................... 136

8
Using STREAM.EXE........................................................................................................................... 137
/serial:<sernum> ......................................................................................................................... 137
/file:<filename> ........................................................................................................................... 137
/logfile:<filename> ...................................................................................................................... 138
/port:<portnum> ......................................................................................................................... 138
/msglvl:<0-5>............................................................................................................................... 139
/format:<P, F, TSC>...................................................................................................................... 139
/window:<samples>..................................................................................................................... 140
/rate:<1, 10, 100, 1000> .............................................................................................................. 141
/timestamp:<s, MJD>................................................................................................................... 143
/sep:<character> ......................................................................................................................... 143
/ref:<Hz> ..................................................................................................................................... 144
/input:<Hz>.................................................................................................................................. 144
/autoupdate ................................................................................................................................ 145
/noexit......................................................................................................................................... 146
/notcp ......................................................................................................................................... 146
/nowarnings ................................................................................................................................ 146
Appendix: Schematic diagrams and service notes ................................................................................ 147
Appendix: Legal and regulatory notices ............................................................................................... 155
Federal Communications Commission Statement ............................................................................ 156
EC Declaration of Conformity........................................................................................................... 156
Performance Certification and Validation ........................................................................................ 157
Limited Warranty............................................................................................................................. 157
Software License: TimeLab .............................................................................................................. 157
Software License: FFTSS................................................................................................................... 158
Software License: FIDLIB.................................................................................................................. 158
Software License: V8 JavaScript Engine............................................................................................ 163

9
Introduction
The TimePod® 5330A Programmable Cross Spectrum Analyzer measures the amplitude, phase and
frequency stability of RF sources and two-port devices at frequencies from 0.5 MHz to 30 MHz. Results
can be viewed at timescales ranging from femtoseconds to days.
Measurements made by the TimePod 5330A include the following:
-Real-time ‘strip charts’ of phase and frequency differences at subpicosecond precision
-Absolute frequency counts at 13+ digits per second, 17 digits maximum
-Allan deviation (ADEV) typically less than 1E-13 at t=1s
-Modified Allan deviation (MDEV), Hadamard deviation (HDEV), and time deviation (TDEV)
-Phase noise and AM noise at offsets from 0.01 Hz to 100 kHz and levels below -170 dBc/Hz
-RMS-integrated time jitter with less than 100 fs residual jitter from 0.01 Hz to 100 kHz
-RMS-integrated phase noise, residual FM, and SSB carrier/noise ratio
Using high performance host-based DSP techniques on a Windows® PC, all of these measurements can
be made simultaneously. Real-time results appear as you watch – and you can save, view, compare,
export, or print them at any time. Accuracy and stability are inherited from a user-supplied external
reference which can run at any frequency within the supported range, with no calibration required by
the instrument itself.

10

11
Specifications
Input frequency and level 0.5 MHz – 30 MHz, -5 dBm - +20 dBm, 50 ohm TNC-F
Reference frequency and level 0.5 MHz – 30 MHz, -5 dBm - +20 dBm, 50 ohm TNC-F
Input/reference VSWR (0.5-25 MHz) 1.5:1 or better
Input/reference port isolation (10 MHz) 130 dB or better
Maximum allowed DC at any RF input +/-5V
Allan deviation (5 MHz-25 MHz, t=1s) 1E-13 minimum, 5E-14 typical (50 Hz ENBW)
Allan deviation (5 MHz-25 MHz, t=1000s) 5E-15 minimum, 1E-15 typical
Phase stability (5 MHz) Less than 10 ps/hour after 2 hour warmup
Typically below 3 ps/hour
Residual phase noise floor (5 MHz, 1 Hz) -140 dBc/Hz minimum, < -145 dBc/Hz typical
Residual phase noise floor (25 MHz, 1 Hz) -130 dBc/Hz minimum, < -135 dBc/Hz typical
Residual phase noise floor (5 MHz, 10 kHz) -170 dBc/Hz minimum, < -175 dBc/Hz typical
Residual phase noise floor (25 MHz, 10 kHz) -165 dBc/Hz minimum, < -170 dBc/Hz typical
Residual AM noise floor (5 MHz, 10 kHz) -160 dBc/Hz minimum, < -165 dBc/Hz typical
Spurious responses (5 MHz, 1 Hz-100 kHz) Less than -100 dBc (phase noise) or -90 dBc (AM noise)
Typically below -120 dBc
Physical dimensions 280 mm x 120 mm x 75 mm, 1 kg
11” x 5” x 3”, 2 pounds
Power requirements 90-264 VAC, 47-63 Hz, < 25W
3-pole AC inlet IEC320-C14
Ambient temperature 15C to 35C operating, -20C to +50C storage
60F to 95F operating, 0F to 125F storage
Note: Due to the use of cross correlation to cancel instrument noise, the phase noise and AM noise floors depend strongly on
the measurement time and available signal levels. Residual specifications assume that measurements are made after a two-
hour warmup period in a temperature-stable environment with +15 dBm at both INPUT and REF IN jacks and Trace→Smooth
noise traces enabled. Under these conditions, 5-10 MHz signals are typically measurable to better than -170 dBc/Hz at offsets
> 10 kHz after less than 10 minutes. Quieter signals, lower-amplitude signals, signals near the frequency-coverage limits, and
measurements of very low close-in noise may require more time to converge.

12

13
Getting started
What’s in the box?
Please check the contents of your package carefully upon arrival. Each TimePod 5330A unit should be
accompanied by the following items:
•(1) USB 2.0 cable, A Male / B Male
•(1) Power supply
•(2) TNC-M / BNC-F coax adapters
•(2) 1” (25.4 mm) SMA-M / SMA-M coax jumpers (preinstalled)
Additionally, each 5330A delivered to North American customers includes a standard IEC320 / NEMA 5-
15P power cord for 120V service. For operation in other countries, the 5330A’s power supply accepts
50/60 Hz AC power at all standard line voltages from 100V to 240V, and is compatible with IEC320-C13
power cords available locally.
Sales and technical support
For prompt assistance, contact Miles Design at the email address or telephone number on the inside
front cover of this manual. When leaving a message, please include your name, organization, callback
number, and preferred time to call (if any). Telephone calls and email are typically returned within 12-
24 hours.

14

15
USB driver and software installation
The current TimeLab release may be downloaded from http://www.miles.io/timelab/readme.htm.
Please install the most recent version of TimeLab before using your new 5330A!
The latest edition of this manual is available at http://www.miles.io/TimePod_5330A_user_manual.pdf.
TimeLab runs on Intel® or AMD® x86-based PCs equipped with Microsoft Windows® XP SP2 or later
versions. It supports a wide variety of time and frequency measurement instrumentation in addition to
Miles Design’s own instruments. Minimum system requirements are 100 MB of disk space, 1 GB RAM
and a CPU with SSE2 support. A dual- or quad-core processor is strongly recommended.
By default, TimeLab will automatically check the Miles Design web site on a weekly basis and inform you
if a newer version is available for download. Updates are always free of charge. To configure or disable
automatic update notifications, select Help→Check for updates.
For best results, TimeLab should be installed prior to
connecting the 5330A to your PC’s USB port for the first time.
Before exiting from the install program, make sure that the box
labeled Install TimePod 5330A USB Driver is checked. This will
help Windows locate the USB driver without further
intervention when the 5330A is connected. After the driver has
been successfully installed on your system, a confirmation
message will appear.

16
To perform measurements with the 5330A, an Intel Core 2 Duo or faster processor is required.
Referring to the benchmarks at http://www.cpubenchmark.net/common_cpus.html, the minimum
PassMark score for reliable acquisition falls in the 1,600 to 2,000 range.
Use of a system with inadequate CPU performance may result in acquisition errors, often accompanied
by a flashing red fault indication on the 5330A’s status LED. It may be necessary to disable one or more
measurement types to achieve reliable operation in such cases. For example, if you are interested only
in phase/frequency stability, uncheck the Phase Noise and AM Noise boxes in the Available
Measurements area of the TimePod acquisition dialog.
For improved performance, a 64-bit version of TimeLab will automatically be installed on x64-based
systems. If you need to record long phase records with the 5330A (or any other equipment), an x64
system with several GB of RAM is recommended.
17
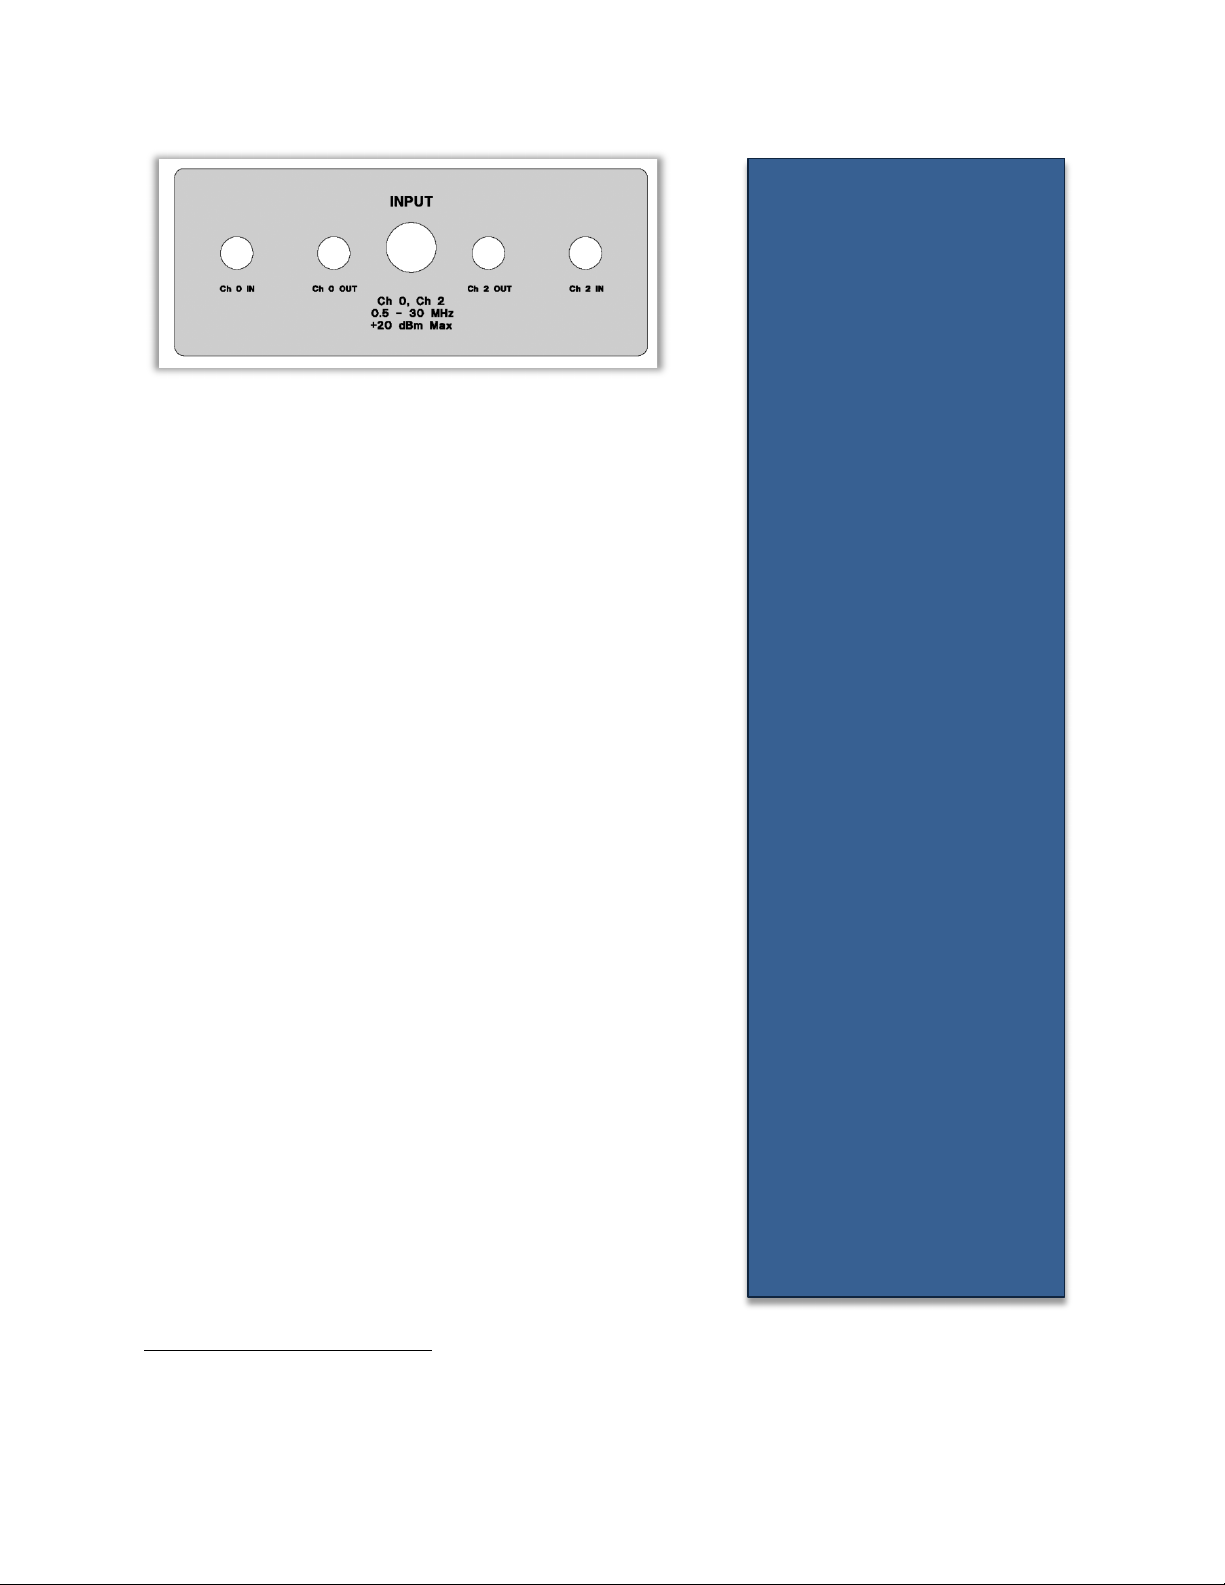
Front panel features
Four SMA jacks and one TNC jack are present on the 5330A’s
input jack panel. In most applications, the input signal from the
device under test should be applied to the centrally-located TNC
jack labeled INPUT.
Internally, the INPUT jack is connected to a 50-ohm 0° RF
splitter whose two outputs are routed to the SMA jacks labeled
Ch 0 OUT and Ch 2 OUT. These jacks are normally connected to
the adjacent Ch 0 IN and Ch 2 IN jacks using two SMA jumpers.
Although TNC interconnects offer superior mechanical stability,
BNC-TNC adapters are also provided for convenience.
Regardless of your choice of coax fittings, double-shielded
cables such as RG223 or RG400 are recommended for low-level
measurements that may be affected by crosstalk and
environmental interference. Use of RG58 and other single-
shielded cables can cause artifacts in stability and noise plots.
Input signals should be greater than 0 dBm for best
performance -- +5 to +15 dBm is recommended. The 5330A’s
specifications assume that sine-wave signals from 50 ohm
sources are applied to the INPUT and REF IN jacks, but you can
also measure CMOS and other square-wave clocks with the help
of a simple L-network (resistive or otherwise) to attenuate the
signal and increase the load impedance where necessary.1
Spur performance may be compromised with non-sinusoidal
inputs. This is especially true at lower frequencies where
multiple harmonics fall within the 0.5 – 30 MHz passband.
1Both the INPUT and REF IN jacks are coupled to their respective input splitters via 0.1 uF 100V capacitors. These capacitors are also present at
the Ch 0 IN and Ch 2 IN jacks. However, application of DC levels greater than 5V peak to any RF signal input is not recommended.
Why the added complexity?
Wouldn’t a single input jack be
enough?
The 5330A is really two identical
instruments in one box. Each of
these two “instruments” consists of
a pair of software-defined HF
receivers for the DUT and reference
input signals. All four receiver
channels are implemented with high
performance 16-bit RF ADCs. During
cross-correlated phase noise and AM
noise measurements, the even-
numbered channels (0and 2) are
assigned to the input ADCs, while
odd-numbered channels (1and 3)
are associated with the reference
ADCs.
Because the instrument noise
originating within each ADC tends to
be uncorrelated with the noise from
that ADC’s counterpart in the other
“instrument,” the differential-mode
noise falls out of the cross-spectrum
average, approaching zero amplitude
over time. Ideally, only the desired
phase and amplitude information
will remain.
Like the input-channel ADCs (0 and
2), ADC channels 1 and 3 are fed
identical copies of the signal at the
REF IN jack through an RF splitter,
but this signal path is only routed
internally. Making the individual
input ADC channels available with
the Ch 0 IN and Ch 2 IN jacks is
worthwhile, though, because it
opens up some possibilities for
advanced measurements.
For example, you can make low-
noise measurements at VHF and
microwave frequencies far beyond
the 5330A’s rated 30 MHz limit by
using two identical downconverters
to mix the DUT signal down to an IF
in the supported 0.5 – 30 MHz range.
If the Ch 0 and Ch 2 downconverter
local oscillators are uncorrelated,
their phase noise and AM noise
contributions will disappear from the
cross spectrum average over time,
just like the ADC noise!

18

19
USB 2.0 High Speed support is required
for all 5330A acquisitions. In most cases
the use of passive or active USB hubs
with the 5330A is acceptable, but if
connection problems occur, you may
find it helpful to connect the supplied
USB cable directly to the host PC.
In general, measurement errors are
much more likely to be caused by
insufficient CPU resources than by USB
connectivity problems.
Rear panel features
The rear jack panel provides a TNC-F input for the external
reference signal required in all 5330A measurements. All guidelines regarding signal levels and
interconnect choices for the INPUT jack also apply to the REF IN input. Suggestions for choosing
appropriate reference sources appear below.
Additionally, the 5330A’s rear panel provides a 5-pin DIN jack for connection to the power supply
(POWER), an 8-pin Mini DIN jack for future accessory expansion (ACC), and a USB Series ‘B’ receptacle
for PC connectivity (USB).
The STATUS indicator is a high-brightness RGB LED that reveals the instrument status at a glance:
Blue Present for the first few minutes while the 5330A’s internal OCXO
warms up.
White e The 5330A is ready to acquire data. Stability measurements at 50 Hz and higher
bandwidths may be performed as soon as the LED turns from blue to white,
although a 30-minute warmup period is recommended. Input/reference drift
warnings may occur with shorter warmup periods.
Green A measurement is either pending or in progress. No fatal errors have occurred.
Flashing purple Excessive signal level is present at either INPUT or REF IN, causing input clipping
in one or more ADC channels. An unexpected increase in signal level after
measurement has begun can cause this indication. This is not a fatal error, but
acquired data is questionable. Damage may occur at input levels greater than
+20 dBm.
Flashing red A USB data overrun has occurred. This is a fatal error. Insufficient CPU power
(or disconnection of the USB cable during a measurement) is typically
responsible. You may be able to run the measurement successfully if you
uncheck one or more of the Available Measurements options in the acquisition
dialog.

20
Choosing an external reference
In addition to the host PC and an appropriate power source, all measurements made with the 5330A
require an external reference to be supplied at the REF IN jack. Virtually all aspects of measurement
performance – accuracy, repeatability, noise floor, spurious responses – depend on your ability to
provide the best reference signal possible.
But what does the “best reference possible” mean? It depends on the goal(s) of your measurement.
Few reference sources are ideal for both short- and long-term measurements. Typical “house clocks”
that distribute 5 or 10 MHz signals at levels between +5 and +20 dBm often work well for ADEV and
other time/frequency measurements, but atomic and GPS standards that are often used as sources for
centralized clock distribution may exhibit more short-term phase noise than an undisciplined crystal
oscillator. Distribution amplifiers can also add substantial noise of their own, as well as phase drift at
longer timescales due to temperature sensitivity. Finally, even when using the best standards,
distribution amps and double-shielded cables, it’s almost impossible to build a large clock distribution
network that’s free of environmental spurs. As a result, you should consider using a standalone low-
noise OCXO for phase noise and AM noise measurements.
Unlike most other stability and noise analyzers, the 5330A can work with any reference whose
frequency lies within its specified range (0.5-30 MHz), regardless of the input frequency from the device
under test (DUT). Frequency readings and phase noise levels are always referred to the frequency at
the INPUT jack. For example, if your 10 MHz DUT’s phase noise when measured with a 5 MHz reference
is -160 dBc/Hz at 10 kHz and its Allan deviation is 3E-12 at t=10s, you will still measure -160 dBc/Hz and
ADEV=3E-12 if you switch to a 10 MHz reference, or one at any other frequency.
The only complication is the need to handicap the reference’s phase noise and FM/PM spur amplitudes
by 20*log10(FDUT/FREF) dB when the DUT and reference frequencies differ. This is the same
consideration that applies at all other times when a signal undergoes broadband frequency
multiplication or division. The effective phase noise and spur performance of the reference source
would be 6 dB worse in the example above where a 5 MHz reference is used to characterize a 10 MHz
device. Likewise, the reference’s long-term stability characteristics (e.g., Allan deviation) would be
degraded by a factor of 2.
Ideally, the phase noise of your reference after any applicable 20*log10(FDUT/FREF) correction should be
at least 8-10 dB lower than the expected performance of the DUT at the offsets of interest. The
reference’s phase noise will not affect the measurement to any great extent as long as this margin is
maintained.2
2This being said, it’s sometimes useful to measure the phase noise or stability of a DUT by using an identical device as the reference. In such a
case, where the phase noise of the reference and DUT is presumed to be identical but uncorrelated, the resulting PN graph will be 3 dB too
high, while Allan deviation and related measurements will be artificially elevated by a factor of sqrt(2). You can use the Rescale Phase field in
TimeLab’s Edit→Trace properties dialog to correct the ADEV of two identical devices by scaling the phase data by 0.707. Similarly, the phase
noise may be corrected by entering -3 in the PN Gain field to lower the trace by 3 dB.
Table of contents


