6 | Clinical Practice Manual
1.10. Motor output to the muscles and joints
A baby learns to balance through practice and repetition as impulses sent from the sensory
receptors to the brain stem and then out to the muscles form a new pathway. With repetition,
it becomes easier for these impulses to travel along that nerve pathway –a process called
facilitation –and the baby is able to maintain balance during any activity. Strong evidence
exists suggesting that such synaptic reorganization occurs throughout a person’s lifetime of
adjusting to changing motion environs.
This pathway facilitation is the reason dancers and athletes practice so arduously. Even very
complex movements become nearly automatic over a period of time. This also means that if
a problem with one sensory information input were to develop, the process of facilitation can
help the balance system reset and adapt to achieve a sense of balance again.
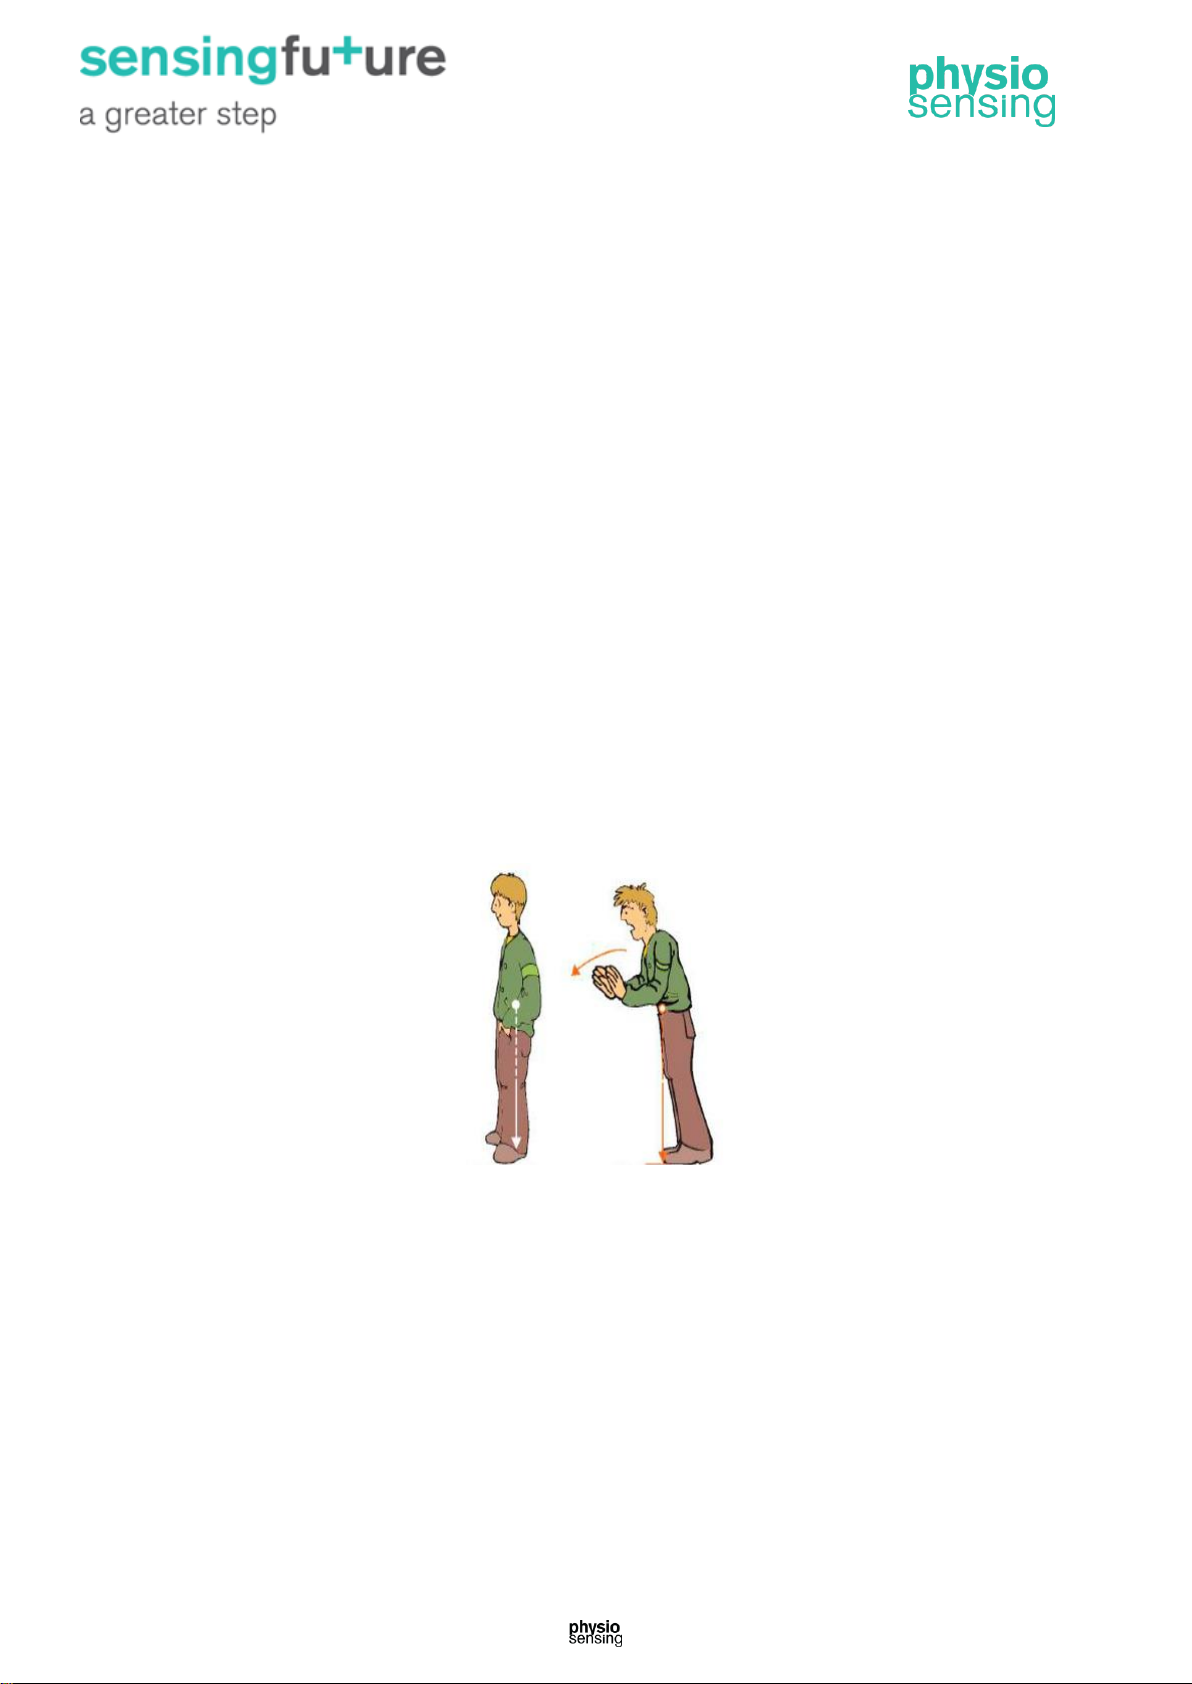
For example, when a person is turning cartwheels in a park, impulses transmitted from the
brain stem inform the cerebral cortex that this particular activity is appropriately
accompanied by the sight of the park whirling in circles. With more practice, the brain learns
to interpret a whirling visual field as normal during this type of body rotation. Alternatively,
dancers learn that in order to maintain balance while performing a series of pirouettes, they
must keep their eyes fixed on one spot in the distance as long as possible while rotating their
body.
1.11. Motor output to the eyes
The vestibular system sends motor control signals via the nervous system to the muscles of
the eyes with an automatic function called the vestibulo-ocular reflex (VOR). When the head
is not moving, the number of impulses from the vestibular organs on the right side is equal to
the number of impulses coming from the left side. When the head turns toward the right, the
number of impulses from the right ear increases and the number from the left ear decreases.
The difference in impulses sent from each side controls eye movements and stabilizes the
gaze during active head movements (e.g., while running or watching a hockey game) and
passive head movements (e.g., while sitting in a car that is accelerating or decelerating).
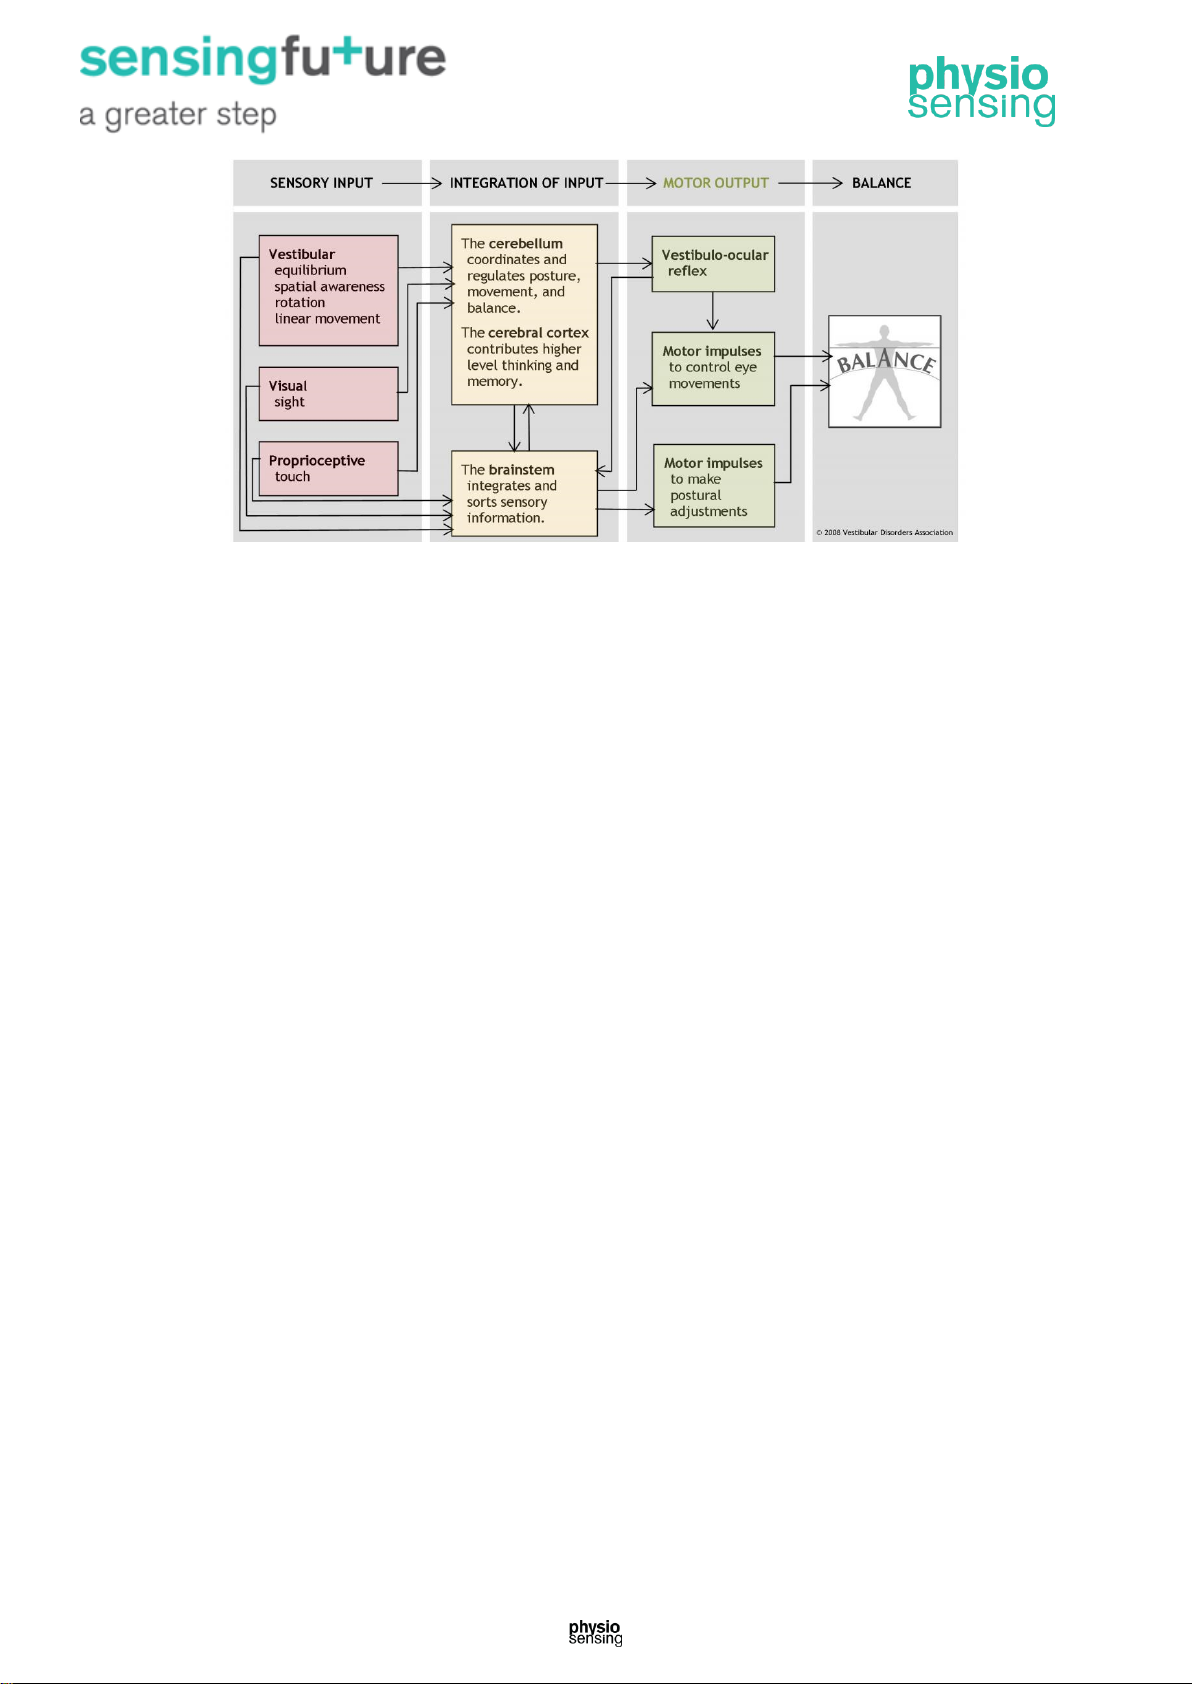
1.12. The coordinated balance system
The human balance system involves a complex set of sensorimotor-control systems. Its
interlacing feedback mechanisms can be disrupted by damage to one or more components
through injury, disease, or the aging process. Impaired balance can be accompanied by
other symptoms such as dizziness, vertigo, vision problems, nausea, fatigue, and
concentration difficulties.
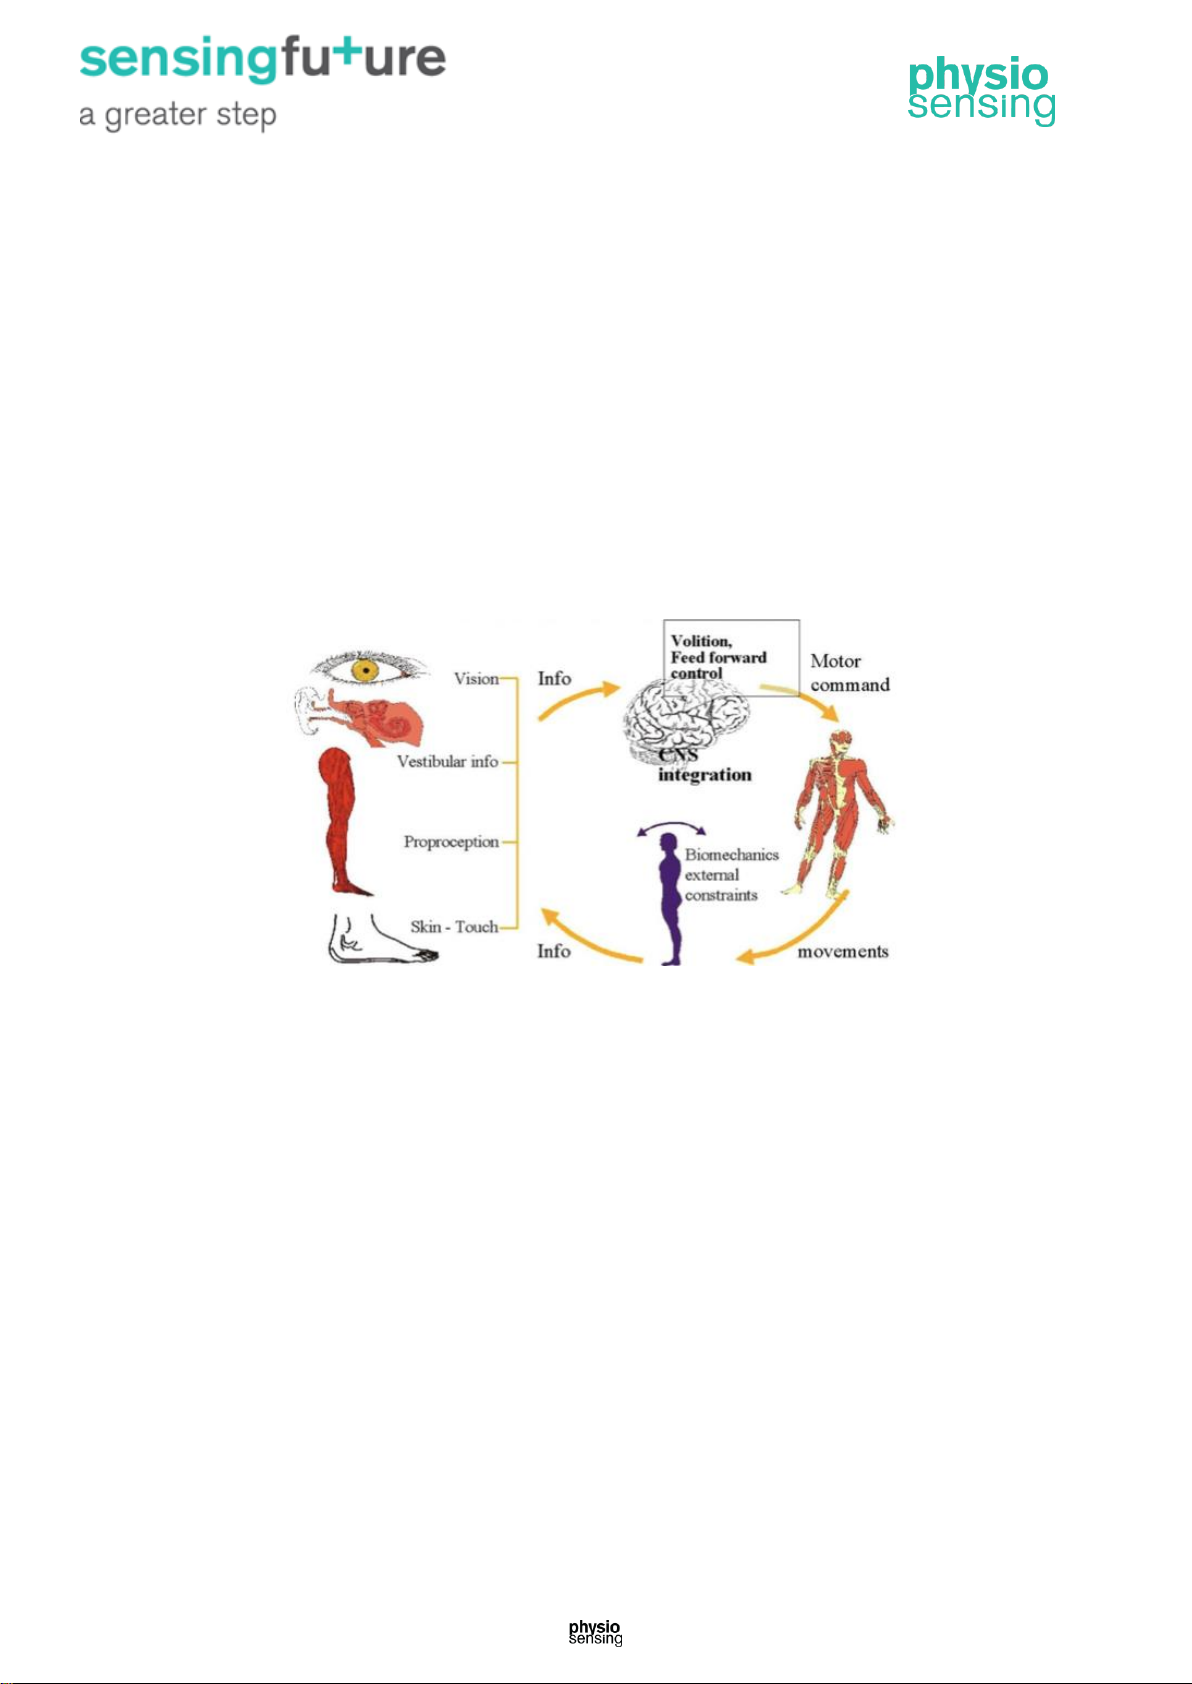
The complexity of the human balance system creates challenges in diagnosing and treating
the underlying cause of imbalance. The crucial integration of information obtained through
the vestibular, visual, and proprioceptive systems means that disorders affecting an
individual system can markedly disrupt a person’s normal sense of balance. Vestibular
dysfunction as a cause of imbalance offers a particularly intricate challenge because of the
vestibular system’s interaction with cognitive functioning, and the degree of influence it has
on the control of eye movements and posture.