manuals.online logo
Brands
  1. Home
  2. •
  3. Brands
  4. •
  5. POTOMAC INSTRUMENTS INC.
  6. •
  7. Measuring Instrument
  8. •
  9. POTOMAC INSTRUMENTS INC. AA-51 User manual

POTOMAC INSTRUMENTS INC. AA-51 User manual

www.SteamPoweredRadio.Com
I
I .
I
I
I
I
I
I
I
I
I
I
I
I
I
I
I
I
I
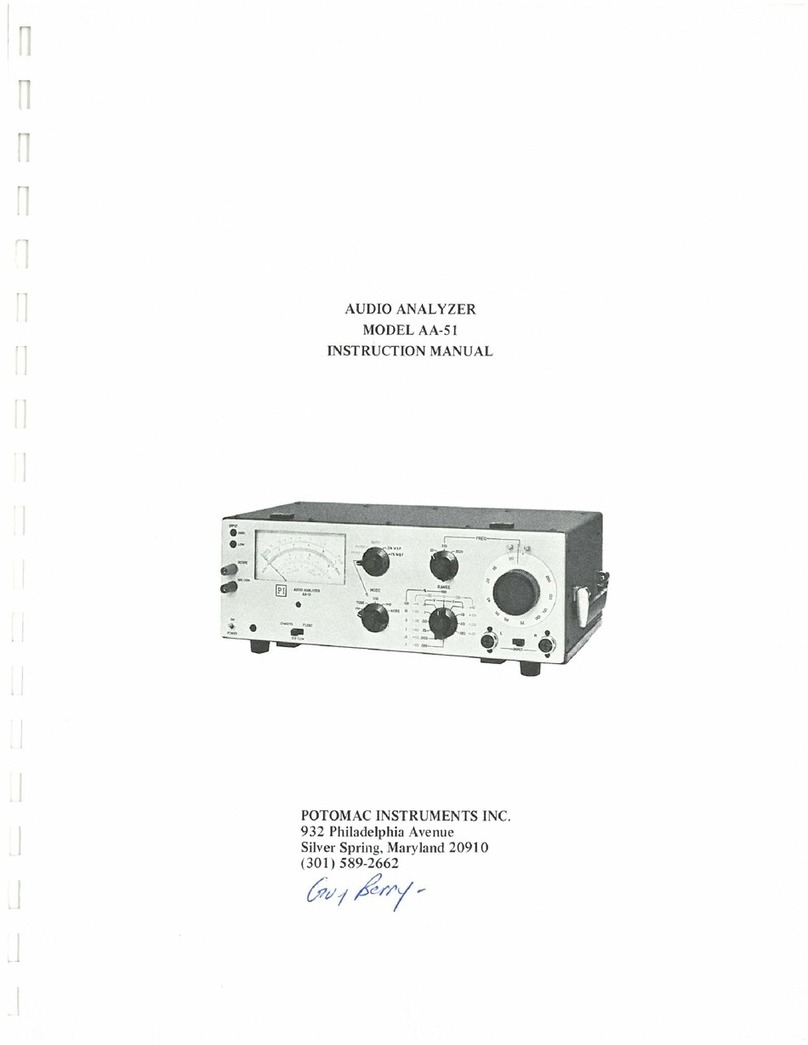
INSTRUCTION MANUAL
AUDIO ANALYZER
Model AA-51
POTOMAC
INSTRUMENTS,
INC.
932 PHILADELPHIA AVE.
PI
SILVER SPRING, MO. 20910
www.SteamPoweredRadio.Com
WARNING
This
instrument
must
be
used
with
a 3
prong
U-
grounded
receptacle
outlet.
Failure
to
use a
grounded
out
l
et
may
result
in
improper
opera-
tion
or
safety
hazard.
I
I
I
I
I
I
I
I
I
I
I
I
I
I
I
I
I
I
I
www.SteamPoweredRadio.Com
AUDIO ANALYZER
MODEL AA-51
INSTRUCTION MANUAL
POTOMAC INSTRUMENTS INC.
932
Philadelphia Av
enue
Silver Spring, Maryland
20910
(301)
589-2662
Revised 1 February 1979
www.SteamPoweredRadio.Com
l
\
WARRANTY
FOR EQUIPMENT
AND
ACCESSORIES
Potomac Instruments Inc. Warrantseach new
equipment
to
be free
of
defects in material
and workmanship,
for
a
period
of
one (1) year
after
date
of
original shipment,
except
for
fuses, transistors, diodes, and integrated circuits,
wh
ich are warranted
for
a period
of
ninety
(90) days.
Any
instrument
which
is
found
within
one year
not
to
meet
the fore-
going standards
after
examination
by
our
factory,
will
be
repaired
or
at
the
option
of
Potomac Instruments replaced
without
charge. This
warranty
does
not
apply
to
equip-
ment
wh
ich
has
been altered,
improperly
handled,
or
damaged
in
any
way.
CHANGES IN SPECIFICATIONS
The
right
is
reserved
to
change the published specifications
of
equipment
at
any
time,
and
to
furnish merchandise
in
accordance
with
current
specifications,
without
incurring
any
liability
to
modify
equipment
previously sold.
RETURNING
EQUIPMENT
TO
THE
FACTORY
Factory
service
is
available
for
repair and
adjustment
of
this
instrument;
however, a des-
criptio
n
of
the
trouble,
plus
the
model
and serial number(s)
of
the
unit
should
be
for-
warded first, whereupon instructions
for
correcting
the
trouble
or
authorization
for
returning
the
equipment
will
be given.
This
applies
to
all units,
whether
under
warranty
or
not.
Shipment
in
an
improper
container
may
result in damaged
equipment
thereby
voiding
warranty.
www.SteamPoweredRadio.Com
TABLE
OF
C
ONT
ENT
S
Paragraph
Title
Page
SECTION
1
GENERAL
DESCRIPTION
1.1
Function
1-1
1.2 Specifications, AA-51 1
-1
SECTION
2
OPERATING
INSTRUCTION
S
2.1 Installation
2-1
2.2 Controls and Indicators
2-1
2.3 Connectors 2-3
2.4
Fuse Location 2-4
2.5
Adjustment
of
Mechanical Zero 2-4
2.6 General Operating Information 2-4
2.7 Operating Procedures 2-5
SECTION
3
THEORY
OF
OPERATION
3
.1
General Description 3-1
3.2
Block Diagram Description 3-1
3.3 Detailed
Theory
of
Operation 3-3
3.3.1 Signal Leveler (BD41), A2 3-3
3.3.2 Phase
and
Ratio Detector (BD
40
),
A3
3-4
3.3.3 IM/WF Demodulator (BD42),
AS
3-5
3
.3.4
Null Amp
(A6)
and Quadrature
Detector
(A4)
3-6
3.3.5 Voltmeter Circuits (BD43, BDS0,
BDS
l)
3-8
3.3.6 Regulated Power Supply,
Al
3
-9
SECTION
4 .
MAINTENANCE
4. I General 4-1
4.2 Periodic Maintenance
4-1
4.3 Alignment Procedure/Performance Test 4-1
4.4 Troubleshooting, General 4-6
4.5 C
ir
cuit Module Troubleshooting 4-7
4.5.1 General 4-7
4.5.2 Power Supply,
Al
4-7
4.5.3 Leveler, A2 4-7
4.5.4
Phase
and
Ratio Detector, A3 4-7
4.5.5 Quadrature Detector, A4,
and
Null Amp, A6 4-8
4.5.6 IM/WF Demodulator,
AS
4-9
4.5.7
Voltmeter
Circuit Assembly, A7 4-9
www.SteamPoweredRadio.Com
Table
4.1
4.2
4.3
4.4
4.5
4.6
4.7
4.8
4.9
4.10
4.11
4.12
4.13
4.14
4.
15
4.16
4.17
Figure
2.1
3.1
4.1
4.2
4.3
4.4
4.5
4.6
4.7
4.8
4.9
4.10
4.11
4.12
4.13
4.14
4.15
4.16
4.17
4.18
4.19
LIST
OF
TABLES
Title
AA-5
1
Board-level Troubleshooting
Voltage Readings, Leveler,
A2
Voltage Readings, Phase
and
Ratio Detector,
A3
Voltage Readings, Quadrature Detector, A4
Voltage Readings,
IM/WF
Demodulator,
AS
Voltage Readings, Null Amp, A6
Voltage Readings, Voltmeter, A
7
Part
s List AA-51 Chassis
Parts List, Power Supply
PCB
Assembly,
Al
Parts List, Leveler PCB Assembly, A2
Parts List. Phase and Ratio Detector PCB
Assembly, A3
Parts List, Quadrature Detector
PCB
Assembly,
A4
Parts List,
IM/WF
Demodulator PCB Assembly,
AS
Parts List, Null Amplifier PCB Assembly, A6
Parts List, Noise Filter PCB Assembly,
A
7A1
Parts List, Voltmeter Amplifier, A7A2
Part
s List, Voltmeter Buffer Assembly, A7A3
UST
OF
ILLUSTRATIONS
Title
AA-51 Controls and Indicators
AA-51 Block Diagram
IMD
Test
Signal Network
Circuit Module and Test
Point
Location, AA-5I
Component Location, Power Supply
Al
Schematic Diagram, Power Supply
Al
Component Location, Signal Leveler A2
Schematic Diagram, Signal Leveler A2
Component
Location, Phase and Ratio De
tector
A3
SchematicDiagram, Phase and Ratio Detector A3
Component
Location, Quadrature
Detector
A4
Schematic Diagram, Quadrature
Detector
A4
Component Location,
IM
/WF
Demodulator
AS
Schematic
Di
agram, IM/WF Demodulator
AS
Component Location,
Nu
ll Amp A6
Schematic Diagram, Null
Amp
A6
Component
Locabon, Noise Filter A7A1
Component
Location,
Voltmeter
Amplifier A7A2
Component
Location,
Voltmeter
BufferA7A3
Sch
ema
tic
Diagram,
Voltmeter
Assembly A7
Wiring Diagram,
AA-5
l
ii
Page
4-6
4-10
4-11
4-12
4-13
4-14
4-15
4-37
4-39
4-40
4-43
4-45
4-47
4-50
4-53
4-54
4-56
Page
2-2
3-2
4-3
4-16
4-18
4-19
4-20
4-21
4-22
4-23
4-24
4-25
4-26
4-27
4-28
4-29
4-30
4-3 l
4-32
4-33/4-34
4-35/4-36
www.SteamPoweredRadio.Com
1.1 FUNCTION
SECTION 1
GENERAL DESCRIPTION
1.1.l
Th
e
Potomac
Instruments Model AA-51 Audio Analyzer is a solid
state
instrument for
measuring ac voltages,
total
harmonic distortion (THO),
int
ermodulation distortion (IMO), signal
plus noise
to
noise, relative phase, amplitude ratio, and weighted peak flutter (W&F).
1.1.2
The voltmeter contained in
th
e Model
AA-51
can
be used separately for general purpose
voltage
and
gain measurements.
The
voltmeter has a frequency range
of
5 Hz
to
200
kHz and a
voltage range
of
1 mV
to
100 Vrms
full
scale.
1.1.3
Total hannonic distortion levels
of
0.1%
to
I00% full scale are measured in seven ranges
for any fundamental frequency from
20
Hz
to
20
kHz: harmonics
are
indicated
to
100 kHz. InpuI
signals between 0.1 Vrms and
80
Vrms are automatically leveled
and
no
manual adjustment is
required.
Too
high
or
too
low
input
signal levels are indicated
by
front
panel LED
's
. A scope
output
is provided for use with an oscilloscope.
The
instrument
is capable
of
an
isolation voltage
of
:!:200
V
above chassis ground.
1.1.4 Intermodulation distortionlevels
of
0.1%
to
100% full scale are measured in seven ranges
for an SMPTE standard signal
of60
Hz and 7 kHz (4:1 ratio).
Input
signals between 0.1
Vnns
and
80
Vrms are
auto
matically leveled.
Too
high
or
too
low
input
signal levels are indicated by LED's.
1.1.S Noise levels as low as -75 dBm
(600
ohms) are measured
ina
passband
of20
Hz
to
20
kHz.
1.1.6 Relative phasebetween two signals is measured in two ranges
of
±54
degrees and ±180
degrees full scale within a frequency range
of
20
Hz
to
20
kHz.
Input
signals between 0.3 Vrms
and
6 Vrms are fully limited;however,
the
amplitude ratio should be within
±6
dB for best accuracy.
1.1.
7 Amplitude ratio
of
two signals is measured over a ±6 dB range within
the
frequency range
of
20
Hz
to
20 kHz.
The
input
signal levels can
be
between 0.3 Vnns
and
6 Vrms.
1.1.8 Weighted peak
flutter
is measured in
two
ranges
of
0.3% and 1% full scale.
The
input
signal
must
be
3.15 kHz ±10% within the amplitude range
of
0.1 Vrmsand
80
rms. A wide band
(0
.2 Hz
to
200
Hz) scope
output
is provided.
1.2 SPECIFICATIONS, AA-51
AC
Voltmeter
Frequ
ency
Range:
Voltmeter
Range:
Voltmeter Accuracy:
Input
Impedance:
Scope
Outpu
t:
20
Hz
to
200
kHz
1 mV
to
100 Vrms (full scale), 10 dB steps
±3%
(full
scale)
330K
ohms
shunted
by
150
pf
capacitor
100 mV p-p
(full
scale)
1-1
www.SteamPoweredRadio.Com
THD Distortion Meter
Fund
amenta
l
Frequency
Range:
Bandwidth
:
Di
s
tortion
Range:
Accuracy:
Dynamic
Rang
e:
Input
Impedance
:
Scope
Output:
Internal
Distortion
& Noise:
IM
Distort
ion
Meter
Input
Signal
Required:
Distortion
Ran
ge:
Accuracy:
Dynamic
Range:
Input
Imp
edance:
Scope
Output:
Internal
Distortion
& Noise:
Signal
Plus
Noise Meter
Frequency
Range (- 3 dB):
Voltmeter
Range:
Signal
Plus
Noise
-
to-Noise
Accuracy:
Residu
al
Hum
&
Noise
:
Input
Imp
edance:
Scope
Output
:
20
Hz
to
20
kHz
in
3
decade
rang
es
100 kHz
0.1%
to
I
00
% full scaJe
±5% (full scale)
0.1
Vrms
to
80
Vrms
automatically
leveled
SOOK
ohms
shunted
by
105
pf
capacitor
100
mV
p-p (full scale)
,;;;;Q
.04
%,
50
Hz - 7.5 kHz;
,;;;;.08%,
20
Hz
-
20
kHz
60
Hz
& 7
kHz
@
4:
1
ratio
(SMPTE
standard)
0.1%
to
100%
±5
%
(full
scale)
0.1
Vrms
to
80
Vrms
automatically
leveled
SOOK
ohms
shunted
by
I
05
pf
capacitor
100
mV
p-p
(full scale)
<.03%
20
Hz
to
20
kHz
I
mV
to
100
Vrms
(full scale)
±5% (full scale)
< - 80 dBm
330K
ohms
shunted
by
150
pf
capacitor
1
00
mV
p-p
(full scale)
1-2
www.SteamPoweredRadio.Com
Phase Meter
Rang
e:
Bandwidth:
Accuracy:
Dynamic Range:
Input
Impedance:
Scope
Output:
Resolution:
Ratio Meter
Range:
Bandwidth:
Accuracy:
Dynamic Range:
Input
Impedance:
Scope
Output:
Resolution:
W&F
Meter
Range:
In
put
Frequency:
Accuracy:
Dynamic Range:
Inpu
t Impedance:
Internal Distortion & Noise:
Scope
Output:
±
54
degrees and ±180 degrees
20
Hz
to
20
kHz
±5% (full scale)
0.3 Vrms
to
6 Vrms
SOOK
ohms
shunted
by
180
pf
capacitor
Rectangular wave
at
input
frequency, 0.
5V
p-p,
duty
cycle proportional
to
phase angle
3 degrees
±6 dB
20
Hz
to
20
kHz
±5% (full scale)
0.3 Vrms
to
6 Vrms
SOOK
ohms
shunted
by
1
80
pf
capacitor
de
voltage proportional
to
ratio
.:;;;;
±0.25 dB
0.3%and
1%
weighted
peak
flutter
in
two
ranges
3.15 kHz ±10%
±5% (full scale)
0.1 Vfms
to
80 Vrms
SOOK
ohms
shunted
by
150
pf
capacitor
¾.01%
Bandwidth .2
to
200
Hz, sensitivity
500
mV
-p-p
(1
%full scale)
1-3
www.SteamPoweredRadio.Com
External Power:
Weight:
Dimensions
(Wx
HxD)
CM
(IN):
115V
or
23
0V
, 50
or 60
Hz
, I
OW
12
lb -
with cover
38.74
X
13.34
X
20.32
(15¼
X
5¼
X
8)
1-4
www.SteamPoweredRadio.Com
SECTION 2
OPERATING INSTRUCTIONS
2.1 INSTALLATION
The Model AA-51 is ready
for
operation as delivered
and
need
only
be
connected
to
an
AC
power
source.
WARNING
The
AA-5 I
must
be
used
with
a 3-prong
U-grounded receptacle outlet. Failure
to
use a grounded
outlet
may
result in i
m-
proper operation
or
safety hazard.
2.2
CONTROLS
AND
INDICATORS
The following controls and indicators are identified
on
Figure 2-1.
2.2.1
POWER Switch,
SI
Applies AC
power
to
the
unit when
in
the
ON position.
2.2.2
POWER Indicato
r,
DSJ
Illuminates
to
indicate
the
presence
of
main DC,
(+23V)
power.
2.2.3
FREQ
Range Switch,
S2
The setting
of
this switch indicates
the
multiplier
for
the
calibrated
FREQ
dial.
2.
2.4
MODE Switch, S3 (upper)
The
upper MODE switch is used
to
select
the
1%
W&F
, .3% W&F,
RAT
IO, PHXIO,
PHX3 modes
or
, in its
most
counter-clockwise position,
to
transfer
contro
l
of
mode selection
to
the
lowerMODE switch, A7-S
1.
2
.2.5
MODE
Switch
A7-S1 (lower)
The lower MODE switch is used
to
select
VM,
TUNE, THD, lMD
or
NOISE
mode
when
the
upper
MODE switch,S3, is
in
its
most
counter-clockwise position.
2.2.6
INPUT Switch,
S4
The
INPUT switch,
S4,
is used
to
select
either
the
L (J6)
or
R
(J7)
input
in those modes
which require
only
a single input signal.
2.
2.
7 LEVEL Switch,
SS
The LEVEL
pushbutton
is used
to
disable
the
rejection-notchTesponse
of
the
null
amplifier
for
test
purposes.
2-1
www.SteamPoweredRadio.Com
J11
0S2
0S3
J10
Ml
AUOIO
ANAi.
YZEft
AA-51
ON
CHASSIS
OAT
S3
THO
VM
S2
,------F
:
REt>-----
RANGE
~,.
oe-~-oo-,
I (
,--v-1-v--,
1
30
-IO
.3
3 +tO
NOIS€
10
-ao J
c.;
l
(.I
'1,0
Pi
R •
...,..
COM
r
---------•
t
----------
t
----,11
1
11
..
r-i
S1
DS1
S6
...
MECHANICAL
ZERO
J9
A7-S1 A7-S2
FRONT
PANEL
~
• .I. '
A -
.,,.
aa:ESJI
...
,,
.:, I ~ •
'>
\'
• 1 ,
•~•
'1
'•
! "
,;..:
I'~\
I
,1
11
,,- 11
,,
'3\
J8
F1
REAR PANEL
Fi
gure 2.1. AA-
51
Co
nt
rols and Indicators
2-2
GROUND
www.SteamPoweredRadio.Com
2.2.8
SIG
COM
Switch,
S6
The
setting
of
the
SIG COM
switch,
S6,
detennines
whether
the
L
(16)
an
d R
(J7)
signal
input
grounds
(analyzer
circu
it
c
ommon)
are
floating
or
connected
to
chassis
grou
nd
.
2.2.9
RANGE
Switch,
A7-S2
The
RANGE
switch
is used
to
se
lect
the
full scale range
in
Volts,
percent
or
dB
of
the
meter
Ml.
2.2.10
FREQ
Di
al
The
FREQ
dial
is
used
in
conjunction
with
the
FREQ
range
switch,
S2,
to
tune
the
notch
filter frequency
to
the
input
signal
fundamental
frequency.
2.2.11
Meter,
Ml
The
front
panel
meter
, M 1, gives
direct
readings
of
amplitude
ratio
in
dB,
noise
and
signal levels in
Vrms
or
dB, signal phase in degrees,
and
harmonic
distortion,
intermodulation
distortion
and w
eighted
peak
flutt
er
in
percent.
2.
2.12
OS2 HIGH Indicator and OS3
LOW
Indicator
The
HIGH
and
LOW
indicator
LEDs
illuminate
singly
in
THO
,
1MD
and
WF
modes
to
indicate
an
input
signal level which is
too
high
or
too
low
for
proper
operation
of
th
e analyzer.
In
THO
mode
,
both
indicators
will
illumina
te
simultaneously
to
indicate
an
off
-null
condi
ti
on
of
the
null
amplifier.
2.3 CONNECTORS
Front
and
rear
panel
connectors
are
identified
in
Figure
2-1.
2.3.1 L INPUT,
16
and
R INPUT,
J7
The
L
and
R
input
connectors
,
located
on
the
analyz
er
front
panel,
are
used
to
apply
signals
to
the
analyzer
for
measurement.
In
phase
and
ratio
modes
both
inputs
are
used
, whereas
in
other
modes
,
one
of
the
two
inputs
will
be
selected
by
INPUT sw
it
ch
S4.
The
mating
connector
for
J6
and
J7
is
Switchcraft
part
no. O5CL3M, available from
Switchcraft
distributors
or
Potomac
Instruments.
2.3.2
AC
IN
Connector,
J8
Connector
J8 is
located
on
t
he
rear
panel
and receives
the
line
co
rd
connecto
r
to
provide
AC
power
input
to
the
AA-51.
2.3.3
AC OUT
Connector,
19
Connector
J9
is
located
on
the
rear
panel
and
provides
an
unfused
115
/2
30
V
ac
auxiliary
output.
2.3.4 SIG
COM
Output
Connector,
110
and
SCOPE
Output
Connector,
JI
1
Connectors
J
10
and J1
J
are
3-way
binding
post
connectors
which
provide a signal
output
for
an oscilloscope.
2-3
www.SteamPoweredRadio.Com
2.4 FUSE
LOCATION
A I/8 amp,
250V
fuse
(F
1) is accessible
in
a screw-type
holder
on
the
generator
rear panel.
2.5
ADJUSTMENT
OF
MECHANICAL
ZERO
Be
fore
operating
the
AA-51
for
the
first time,
check
the
me
ter
mechanical zero.
To
do
this
,
if
analyzer
is
on
,
tum
off
and
allow 2
to
3
minutes
for
complete
capacitor
discharge.
Turn
the
meter
zero
adjust screw,
shown
in Figure
2-1.
using a small-
bladed
screwdriver
until
an
exact
zero
indication
is achieved.
2.6
GENERAL OPERATING INFORMATION
2.6.1
Input Connections
One
or
two
signal
source
s
may
be
connected
to
the
AA-51 using
the
shielded cables pro-
vided
with
the
analyzer. In these cables
the
alligator clip insulators are
color
coded.
Red
is
the
signal
high lead;
blue
is
the
signal
low
or
common
lead;
and
black
is
the
cable shield
and
chassis
ground.
The
eff
e
ct
of
input
and
test
cable
capacitanc
e
on
frequency
re
sponse
must
be
considered when
the
device
under
test
has
a high ou
tput
imp
e
danc
e.
The
test
cable capacitance is
approximately
400
pf;
this
added
to
the
AA-51
input
capacitance res
ults
in
a capacitive reactance
load
on
the
device
under
test
of
20,000
ohms
at
15 kHz.
For
a
sourc
e
impedance
of
600
ohms
this reactance has negligible
effect,
but
for
a
sourc
e impedance
of
10,000
ohms
the
measured voltage is
down
1.0 dB from
the
no-load value
at
15 kHz. Low-capacitance
test
leads can
reduce
this
effect
to
0.1 -0.2 dB.
In
some
cases
what
is called
"output
impedance"
is
not
the
circuit
generator
impedance
,
but
the
minimum
recommended
load
impedance.
The
true
output
impedance,
which
may
be
lower,
can
be
measured
by
finding
the
resistance
that
drops
the
output
voltage
to
half
its no-load value
at
a signal level low
enough
to
main-
tain
linear
operation.
2.6.2
Grounding
When
the
AA-51
power
cord
is plugged in,
the
chassis is
connected
directly
to
the
AC
power
neutr
al
line
through
the
third
wire
of
the
power
cord.
This
may
or
may
not
provide
minimum
pickup
of
unwanted
hum
and
noise
in
the
measuring circuits.
Often
the
AA-51
must
be
grounded
solidly
to
the
equipment
under
test
to
obtain
minimum
hum
pickup.
This
connection
may
be
made
using
the
test
cable shield,
which
is
connected
to
the
chassis,
or
by
using a
separate
wire from
the
ground
binding
post
on
the
rear
of
the
unit. In
such
cases
it
may
also
be
necessary
to
isolate chassis
ground
from
power
line
ground
, using a three-prong-to-two-prong
adapter
to
obtain
minimum
noise
pickup.
If
this
is
done
be
certain
to
observe
th
e following warning:
WARNING
Be ce
rt
ain
that
the
chassis
of
the
AA-51 is solidly
grounded
to
an
earth-grounded
point
before using
an
adapter
or
other
means
to
br
eak
the
power
cord
ground
connection.
Otherwise a dangerous
voltage
may
be
present
on
th
e AA-51 chassis.
2.6.3 Use
of
Scope T
erminal
The
scope
te
rmin
als provide a l
00
mV p-p
output
for
full scale
meter
deflection.
These
terminals
can
be
used
to
monitor
the
output
signal
with
an
oscilloscope.
The
combination
of
2-4
www.SteamPoweredRadio.Com
the
analyzer and oscilloscope provides more significant information
about
the
device under test
tban the expression
of
magnitude alone. The impedance
at
the scopeterminals is 2200 ohms
and excessive loading should be avoided to maintain
the
accuracy
of
meter reading. Watch for
a
drop
in the reading when connectinga load; for high-impedance oscilloscope inputs the
effect
is
negligible.
2.6
.4 Signal Common Chassis-Float Switch
For
mostmeasurements this switch should
be
in the CHASSIS position.
The
FLOAT
position
is
for
use when neither
of
the pair
of
signal terminals under test is
at
ground potential.
In
this mode
the
signal common may be
at
up
to
±200 volts
de
or
peak ac with respect to
chassis ground.
If
the terminals under test are a balanced pair so
that
signal voltage exists
on
both
AA-51
input
leads, the
VM
and NOISE functions operate normally,
but
distortion measure-
ments will
not
be
correct.
For
distortion measurements
on
a balanced line a balanced-to-unbalanced
transformer between the device under test and
the
AA-Sl
is
recommended.
2.6.5 Balanced Line Measurements
The AA-51 measuring circuits are unbalanced,
that
is, one
of
its
input
terminals (designated
Signal Common)
is
directly connected
to
the measuring circuitground. Signal Common may be
floated with respect
to
chassis ground,
as
explained in 2.
6.4,
but
the measurements possible
on
balanced lines arelimited. Voltage measurements are possible,
but
the THD measurement circuit
does
not
function well in the FLOAT mode,
and
a transformer is required.
2.6.6 Equipment Performance Measurements
Equipment Performance Measurements (EPM)
to
determine a broadcast facility's audio
performance are required
by
the
FCC and described in various sections
ofthe
FCC Rules, Part 73.
These tests are commonly referred to
as
an "Audio Proof" although
the
FCC perfers to use
the
term
"Proof"
only
for
measurements
to
verify the performance
of
AM
directional antenna systems.
Useful guides
to
these EPMs for AM and FM stations have been prepared by Broadcast Engineering
Magazine and are available from Broadcast Engineering, P.O. Box 12901, Overland Park, Kansas 66212.
2.7
OPERATING
PROCEDURES
2.7.1
GENERAL
The AA-51 audio analyzer should
be
operated
from
a 115 volt
or
230
volt ac power
sourceaccording to
the
rating on the nameplate
on
the
rear
of
the
unit.
CAUTION
Switch (SIG COM) from (CHASSIS) to (FLOAT) when measur-
ing signals between
two
points which are
both
above ground
potential.
2.7.2
Voltmeter
Mode
The AA-51 becomes a general purpose ac voltmeter when the MODE selectoris set
to
VM
position (Upper MODE Switch max.
CCW).
Perform
the
following steps when ma.king
voltage measurements:
a.
Position RANGE selector to a range exceeding
tl1e
value
of
the
signal
to
be
measured.
2-5
www.SteamPoweredRadio.Com
b.
Connect
signal
to
either
the
Lor
R
connector
with
INPUT
sw
itch
in
proper
position
to
read
signal.
c.
Select
a
meter
RANGE
to
give a reading as
close
to
full scale as possible.
d.
Observe
meter
indication
and
meter
RANGE
setting
to
obtain
signal level.
2.7.3 Total Harmonic Distortion Mode
a.
Position
MODE
selector
to
TUNE
(Upper
MODE
Switch
max.
CCW).
Th
e
SIG
COM
switch
must
be
at
CHASSIS.
b.
Connect
test
leads
from
device
under
test
to
either
the
Lor
R
connector
with
INPUT
switch
in
proper
pos
i
tion
to
read
signal.
c.
See
that
the
HIGH
and
LOW lights are
both
out.
If
the
LOW
light
is
on,
switch
the
FREQ
switch
one
step
above
or
below
the
correct
position
(or
press
LEVEL
switch
S5)
and
read
the
meter:
if
the
pointer
is
at
full scale,
indicating
that
signal leveling is
effective,
the
THO
reading
will
be
accurate.
Normally
this
occurs
for
input
levels
as
low
as
50
mV
RMS.
At
such
low
levels,
however
,
the
AA
-5
I's
residual
noise
may
cont
ribut
e
to
the
reading.
Accurate
readings
are
also
pos
s
ible
for
input
levels
above
that
which
turns
on
the
HIGH
light,
as
high
as
100
volts
,
if
leveling
is
effective
and
i
nstru
-
ment
distortion
is
low
.
d.
Position
FREQ
rang
e
selector
and
frequency
dial
to
fundamental
frequency
of
input
signal.
Adjust
frequency
dial
to
obtain
a
minimum
indication
on
the
meter.
e.
Position
MODE
se
l
ector
to
THD.
HIGH
and
LOW lights will
light
together
until
automatic
nulling
is
nearly
completed.
If
the
lights
do
not
go
out,
recheck
the
dial
setting
in
TUNE
~steps a-c).
f.
Observe
meter
indication
and
RANGE
switch
set
tin
g.
For
example,
if
meter
indicates
.8
and
the
RANGE
selector
is
in
1
%
position,
distortion
measured
is
0.8
%.
If
the
THD
reading
seems
abnormally
high,
the
problem
is
often
power
frequency
(hum)
or
other
noise
pickup,
which
can
be
identified
by
using
an
oscilloscope
at
the
SCOPE
terminal.
g.
If
a series
of
THO
measurements
is
being
made
at
various
known
frequencies,
in
most
cases
the
MODE
switch
can
be
left
at
THO
and
the
dial
reset
by
eye
to
each
new
frequency.
The
AA-51
has
enough
pull-in
rang
e
to
null
auto-
matically
without
using
the
TUNE
step
if
the
dial
is
set
carefully,
except
that
it
may
be
ne
cessary
to
swit
ch
to
TUNE
and
back
to
THD
for
nulling
near
20
kHz.
2.
7.4
Intermodulation Distortion
a.
Position
MODE
selector
to
IMO
(Upper
MODE
Switch
max.
CCW).
b.
Connect
test
leads
from
device
under
test
to
either
the
L
or
R
connector
with
input
switch
in
proper
position
to
read
signa
l.
2-6
www.SteamPoweredRadio.Com
c. See
that
the
HIGH
and
LOW lights are
both
out.
lf
the
LOW light lights,
switch
the
MODE
switch
to
TUNE
and
FREQ
to
xl0,
and
read
the
meter.
If
the
pointer
is
at
full scale,
the
IMD
reading will
be
accurate (see 2.7.3c).
d.
Observe
meter
indication
and
RA
NGE switch setting
to
determine
the IMD
percentage. A dual-trace oscilloscope used
to
compare
the
SCOPE
output
voltage
with
the
input
test
signal will indicate
at
what
point
on
the
test
signal waveform the distortion occurs.
2.7.5 Noise Mode
a. Position MODE selector
to
NOISE.
(Upper
MODE
Switch
max
. CCW).
b.
Connect
test
leads from device
under
test
to
either
the L
or
R
connector
with
INPUT switch
in
proper
position
to
read signal.
c. Observe
meter
indication and RANGE sw
itch
setting
to
determine
the
noise voltage.
The
noise voltage
may
be
observed
for
analysis
with
an
oscilloscope
at
the SCOPE terminal.
d.
For
signal-to-noise ratio measurements (actually signal-plus-noise-to-noise
ratio)
,
a referencelevel may
be
established
by
applying
the
signal
in
the
NOISE
mode.
An example is, applying
modulation
to
a transmitter
to
obtain
a referencelevel
and
then
removing
it
to
measure noise.
In
the
NOISE
mode,
for
sine waves,
the
reference voltage applied
must
not
exceed 8.0
volts RMS
up
to
7.5 KHz
or
4.0
volts
at
15
kHz
for
accurate results.
For
higher voltages use
the
VM
mode
to
estab
lish
the
referencelevel.
The
meter
sensitivity
for
VMis
the
same as
for
NOISE.
If
in
doubt,
look
for
distortion due
to
too-high levels
in
the NOISE circuits using
an
oscilloscope
at
the
SCOPE terminal.
2.7.6 PhaseAngle Mode
a.
Position MODE switch
(upper)
to
PHASE x 10.
b.
Connect
test
leads from the
Land
R
input
connectors
to
the
points
on
the
device
under
test
between
which
the
phase angle is
to
be
measured.
c.
With signals applied, see
that
the
HIGH
and
LOW lights are
both
out.
If
not
or
if
in
doubt,
switch
to
the
VM
mode
and
measure
the
input
levels
to
see
that
they are within
the
specified range
of
0.3
to
6.0
volts.
d. Read
the
meter;
if
the
indication
is
less
than
5
on
the
PHx l0 range, switch
to
the
PHx3 range. Multiply
th
e reading
by
10
or
3
to
obtain
the
phase
angle.
Note
the
sign
of
the
reading. A positive angle means
that
the
R
input
lags
the
L
input,
or
the
R
input
is delayed
in
time
with
respect
to
the
L input.
e.
Fast
phase changes
may
be
seen
by
observing
the
output
signal
at
the
SCOPE terminal using
an
oscilloscope. This signal is a square wave
with
duty
cycle
proportional
to phase angle;
it
is symmetrical
(50
percent
duty
cycle)
for
an
angle
of
zero.
2-7
www.SteamPoweredRadio.Com
2.7.7 Ratio Mode
a. Positi
on
MODE switch (upper)
to
RATIO.
b. Connect
test
leads from
the
Land
R
input
connectors
to
the
points
on
the
device
under
test between which the amplitude ratio is
to
be
measured.
The
L
input
is
the
reference signal in
the
RATIO circuit, and the
meter
response
time
for
R voltage changes is faster than
for
L
voltage changes.
c. With signals applied, see
that
the
HIGH
and
LOW
lights are both
out.
If
not
or
if
in
doubt,
switch
to
the
VM
mode
and measure
the
input
levels
to
see
that
they are within
the
specified range
of
0.3
to
6.0
volts.
d. Read
the
indicated ratio directly in dB. A positive indication means
that
the
R voltage is greater than
the
L voltage.
e. A de voltage proportional
to
the
ratio
is available at the SCOPE terminal.
This voltage is
zero
for
a
ratio
of
zero dB, and changes
+3
.0, - 1.5
volts
for
ratios
of
±6
dB.
2.7.8
Wow
and
Flutter
Mode
a.
Position MODE switch (upper)
to
1% W&F.
b.
Connect
test
leads from
either
the L
or
R
connector
to
the
device
unde
r
test
with
input
switch in
the
proper
position
to
read
the
signal. See
that
the
HIGH and
the
LOW
lights are
both
out.
c. Observe percentage
of
W&F
indicated
on
meter.
If
meter
indication is
small, switch MODE selector
to
.3%
W&F
for
increased sensitivity.
d.
The
instantaneous
output
of
the
wow and flutter
demodulator
may be
observed
on
an oscilloscope
at
the
SCOPE terminal.
The
sensitivity is
constant
for
flutter frequencies from
0.2
to
200
Hz. There is
no
weighting
filter
at
this point.
2-8
www.SteamPoweredRadio.Com
SECTION
3
THEORY
OF
OPERATION
3.1 GENERAL DESCRIPTION
ThL'
Modd
AA-5 1
Audio
Analyzer
as
shown
in
the
overall
block
diagram.
Figure
3.
I.
consists
basirally
or
a
meta
with
SL'Veral
differl'nt
input
tirtuits
whil'.h
may
be
s
elected
for
dif
-
ferent
m
easu
ring
tasks.
The
meter
itsl'lf
is
driven
by
the
A7
buffer/amplifier
and
switching
assembly
which
reecivcs
its
input
either
directly
from
the
front
panel
jacks,
or
from
one
of
the
s
pecial
mea
surement
:Ind
demodulation
circuits.
These
circuits
t.:
onsist
of
the
A3
board.
used
for
phase
and
rati
o
measurement.
the
AS
board,
used
for
measuring
lM
dislorlion
and
wow
and
flutter.
anti
the
A4
and
A6
t:in.:uits
which
work
togethL'r
to
provide
automatic
measurement
of
harmonic
distortion.
The
A3
circuit
receives
its
signal
input
directly
from
the
front
panel
jacks.
while
the
otha
measurement
ci
rcuit
s r
ece
iv
e
their
input
by
way
or
the A'2
leveler
circuit.
which
automatically
atknuaks
the
input
signal
to
the
proper
level
for
measurement.
3.2
BLOCK
DlAGRAM
DESCRJPTJON
3.2.
l
AC
Voltmeter
Mode
In
the
VM
mode
of
operation,
the
input
signal
from
either
the
Lor
R
input
connector
passes
through
S4
to
the
A7
voltmeter
assemb
l
y.
On
the
noise filt
er
board,
A7A I,
the
signa
l
passes
dirn
ctly
through
switch
SI
F
to
the
A7
A3
voltmeter
buff
er where
it
will
be
attenuated
either
1:
I
or
1000:
1,
depending
011
the
pos
i
tion
of
range
switch
S2
A.
The
attenua
ted
signal
from
th
e A7
A3
board
is
then
further
attenuated
on
the
voltmeter
amp
li
fier
board,
A7A2,
as
it
passes
through
swi
t
ches
S28
and
SIC
to
the
vo
l
tmeter
drive
amplifier.
The
meter
drive
output
cu
rrent
then
passes
through
S3D
and
E
and
is
applied
to
the
meler.
3.2
.2
Noise
Measurement
Mode
Operation
in
the
NOISE
mode
is
similar
to
that
described
above
for
VM
mod
e,
excep
t
that
the
input
is
bandpass
filtered
to
remove
signals
lying
outside
the
noise
band
(20
Hz
to
20
kHz).
Thi
s
filtering
is
accomplis
hed
by
UIA
and
UlB
on
th
e
A7Al
board
,
through
whic
h
the
signal
is
routed
by
switches
SJF
(on
A7Al)
and
S1B
(on
A7A3)
before
it
is
applied
to
the
circuits
on
A7A3.
3.2.3
Total
Harmonic
Distortion
Measuring
Mode
In
the
THD
mode
of
operation
the
input
signal
from
either
the
L
or
R
connecto
r is
applied
to
the
A2
leveler
circu
it
and
is
attenuated
by
relay
K1
if
the
signal l
evel
is
greater
than
3 Vrms.
After
buffering
,
the
input
signal is passed
through
a
current
controlled
attenuator
which
is
feedback
controlled
to
maintain
a
constant
output
amplitude
from
th
e l
eveler
circuit.
Th
e signal level
is
al
so
monitored
by
a
detector
circuit
(Q 1
etc.)
which
operates
the
HI
and
LO
indicators
to
indicate
improper
signal
le
vel, and
activates
relay
KI.
The
levelled
output
of
the
A2
board
is
applied
to
a
rejection
amplifier,
A6,
which
when
prop
e
rJy
tuned
suppresses
the
fundamental
co
mponent
of
the
tuned
signal
better
than
80
dB.
To
assure
proper
tuning
of
the
rejection
amplifier
and
to
reduc
e
the
time
involv
ed
in
harmonic
measurement,
automatic
null
balan
c
ing
is
employed
once
the
operator
has
rough-
tuned
the
signal
frequency.
The
A4
quadrature
detector
board
perfonns
this
null
balancing
operation
by
ana
lyzing
the
null
amp
output
and
supplying
control
signals
to
adjust
null
amp
parameters.
The
A4
circuit
also
has
the
capability
to
activate
the
Hl
and
LO
indicators
simultaneously
to
indicate
improper
null
amp
tuning.
The
output
of
the
null
amplifier
is
then
appl
ied
to
the
voltmeter
circuits
of
the
A7
assembly
for
measurement
of
the remaining harmonic components.
3-1
www.SteamPoweredRadio.Com
w
I
IJ
R i,,f
~
[±J
A2 LEVELER
I-----
-
--------
'
I
I
I
20
L__
__
_
A4 QUADDE
T-MON
ITOR
I-
-
-~-3~A-~-A-,o-,
~ii-a
-~~c-
- - 7
,------tl---3--
a
HILIMJ
!PHASE!
I.•.
~
I
."-..
15
4
L_1o
______
_
LEVELED
SIGNAL
A5
IM/WF
DEMOD
----------
,B
i3
I
......
__,•~3-
201
I I
9
-
--
--
---
- -
--
--
*S
YM
BO
LS
3.7-
-GAI
N'
3.7
LPF-
LOW PAS$
FILTER
HPF-
HIGH
PASS FILTER
LI
M-
-
LIMITER
INT-
-INTEGRATOR
C---
COMPARATOR
PK-·-
PEAK DETECT
OR
VCR-
VOLTAGE
CO
NTROLLED RESISTOR
* RECTIFIER CI
RCU
IT
S3C-·
SWITCH
S3,
SECTION
C
SCOPE
SWITCH FUNCTION
S2- - - • - -
FREQ
S3-----
MOOE(UPPER)
$4
-
---
-INPUT
S5
--
--
-
LEVEL
A7S1-
---
MOOE(LOWERJ
A7S2
--
-
RANGE
Figure 3.1.
AA-51
Block Diagram
AG
NULL
AMPL
------
--
--
,3
7
S5
WIEN
1
BRIDGE
----
-1-·1FREQI
# ------
DIAL
!
I
IL
---,
~
I --
----
_
_E_
'{_M_ASSY
__
I
41
j
'
I
I
I
I
I
!
l:_--;;~...:c•~~·--
--h
'
I
~
.---, .---,
N_l,2
I
I
I
I
___
_ _
__
__J
-- - -
--
-
----------

Other POTOMAC INSTRUMENTS INC. Measuring Instrument manuals
POTOMAC INSTRUMENTS INC. FIM-21 User manual

POTOMAC INSTRUMENTS INC.

POTOMAC INSTRUMENTS INC. FIM-21 User manual

POTOMAC INSTRUMENTS INC. FIM-41 User manual

POTOMAC INSTRUMENTS INC.

POTOMAC INSTRUMENTS INC. FIM-41 User manual

POTOMAC INSTRUMENTS INC. AM-19 User manual

POTOMAC INSTRUMENTS INC.

POTOMAC INSTRUMENTS INC. AM-19 User manual

POTOMAC INSTRUMENTS INC. AA-51A User manual
POTOMAC INSTRUMENTS INC.

POTOMAC INSTRUMENTS INC. AA-51A User manual

POTOMAC INSTRUMENTS INC. AA-51 User manual

POTOMAC INSTRUMENTS INC.

POTOMAC INSTRUMENTS INC. AA-51 User manual

POTOMAC INSTRUMENTS INC. PI 4100 User manual

POTOMAC INSTRUMENTS INC.

POTOMAC INSTRUMENTS INC. PI 4100 User manual

Popular Measuring Instrument manuals by other brands

Hanna Instruments HI 96745 instruction manual

Hanna Instruments

Hanna Instruments HI 96745 instruction manual

SICK Master Data Analyzer operating instructions

SICK

SICK Master Data Analyzer operating instructions

Eurochron 1544543 operating instructions

Eurochron

Eurochron 1544543 operating instructions

ero electronic DPS instruction manual

ero electronic

ero electronic DPS instruction manual

BAMO IER TURBISWITCH GS4 operating instructions

BAMO IER

BAMO IER TURBISWITCH GS4 operating instructions

Technomark GraphiX user guide

Technomark

Technomark GraphiX user guide

Hitachi UG 50Y instruction manual

Hitachi

Hitachi UG 50Y instruction manual

Levitronix LEVIFLOW LFSC-D Series user manual

Levitronix

Levitronix LEVIFLOW LFSC-D Series user manual

Tektronix P7350 instruction manual

Tektronix

Tektronix P7350 instruction manual

Greenlee 93-172 instruction manual

Greenlee

Greenlee 93-172 instruction manual

ABB AK101 user guide

ABB

ABB AK101 user guide

Teledyne HASTINGS 2002 instruction manual

Teledyne

Teledyne HASTINGS 2002 instruction manual

VONROC LL505DC Original instructions

VONROC

VONROC LL505DC Original instructions

AJA Io Express Installation and operation guide

AJA

AJA Io Express Installation and operation guide

Kikusui KJM6335 Operation manual

Kikusui

Kikusui KJM6335 Operation manual

EFI ES-2000 Setup guide

EFI

EFI ES-2000 Setup guide

TESTO 416 instruction manual

TESTO

TESTO 416 instruction manual

MEWOI 7800 user manual

MEWOI

MEWOI 7800 user manual

manuals.online logo
manuals.online logoBrands
  • About & Mission
  • Contact us
  • Privacy Policy
  • Terms and Conditions

Copyright 2025 Manuals.Online. All Rights Reserved.