ProfiTap PROFISHARK 100M User manual

WWW.PROFITAP.COM
PROFISHARK 100M
User manual
Ethernet Protocol Analyzer TAP

Page 2 LAN-WAN Test Equipment
Thank you for purchasing the PROFISHARK 100M.
Package content
Inside the package are provided :
- 1* PROFISHARK 100M main unit
- 1* 2Gb USB key containing drivers and softwares
- 1* RJ45 cable
- 1* USB2.0 cable
- 1* Carrying pouch
- 1* User manual

www.profitap.com Page 3
Table of contents
1. General Information…..………………………….…………..
2. PROFISHARK 100M Visual Description………………….
3. Installation……………………………………………………..
3.1 Hardware & Driver installation
3.2 Analyzer Installation
4. Optional Software Description……………………………..
4.1 EasyStat
4.1.a Installation
4.1.b Description
4.1.c Usage
4.2 NanoSec Converter
4.2.a Installation
4.2.b How to use it?
4.3 ProfiTAP User SetUp
4.3.1 Installation
4.3.2 Usage
5. Additional Informations……………………………………..
5.1 System requirements
5.2 Technical and electrical features
4
6
7
8
10
11
12
12
12
13
16
16
16
18
18
19
22
22
22

1. General Information
The PROFISHARK is a straightforward solution. In-Line, it sees and monitors
all 7 protocol layers. It captures and aggregates Full-Duplex traffic at Wire-
Speed (200Mb). It requires only one USB 2.0 (480Mb) port. It is a cost-
effective, ultra compact, easy to use solution. The hardware setup takes less
than a minute.
This new Test Access Port (TAP) generation brings the main advantage to
highly simplify necessary connections and is open to be used with a larger
number of Operating Systems (i.e. Windows, Mac OS and Linux).
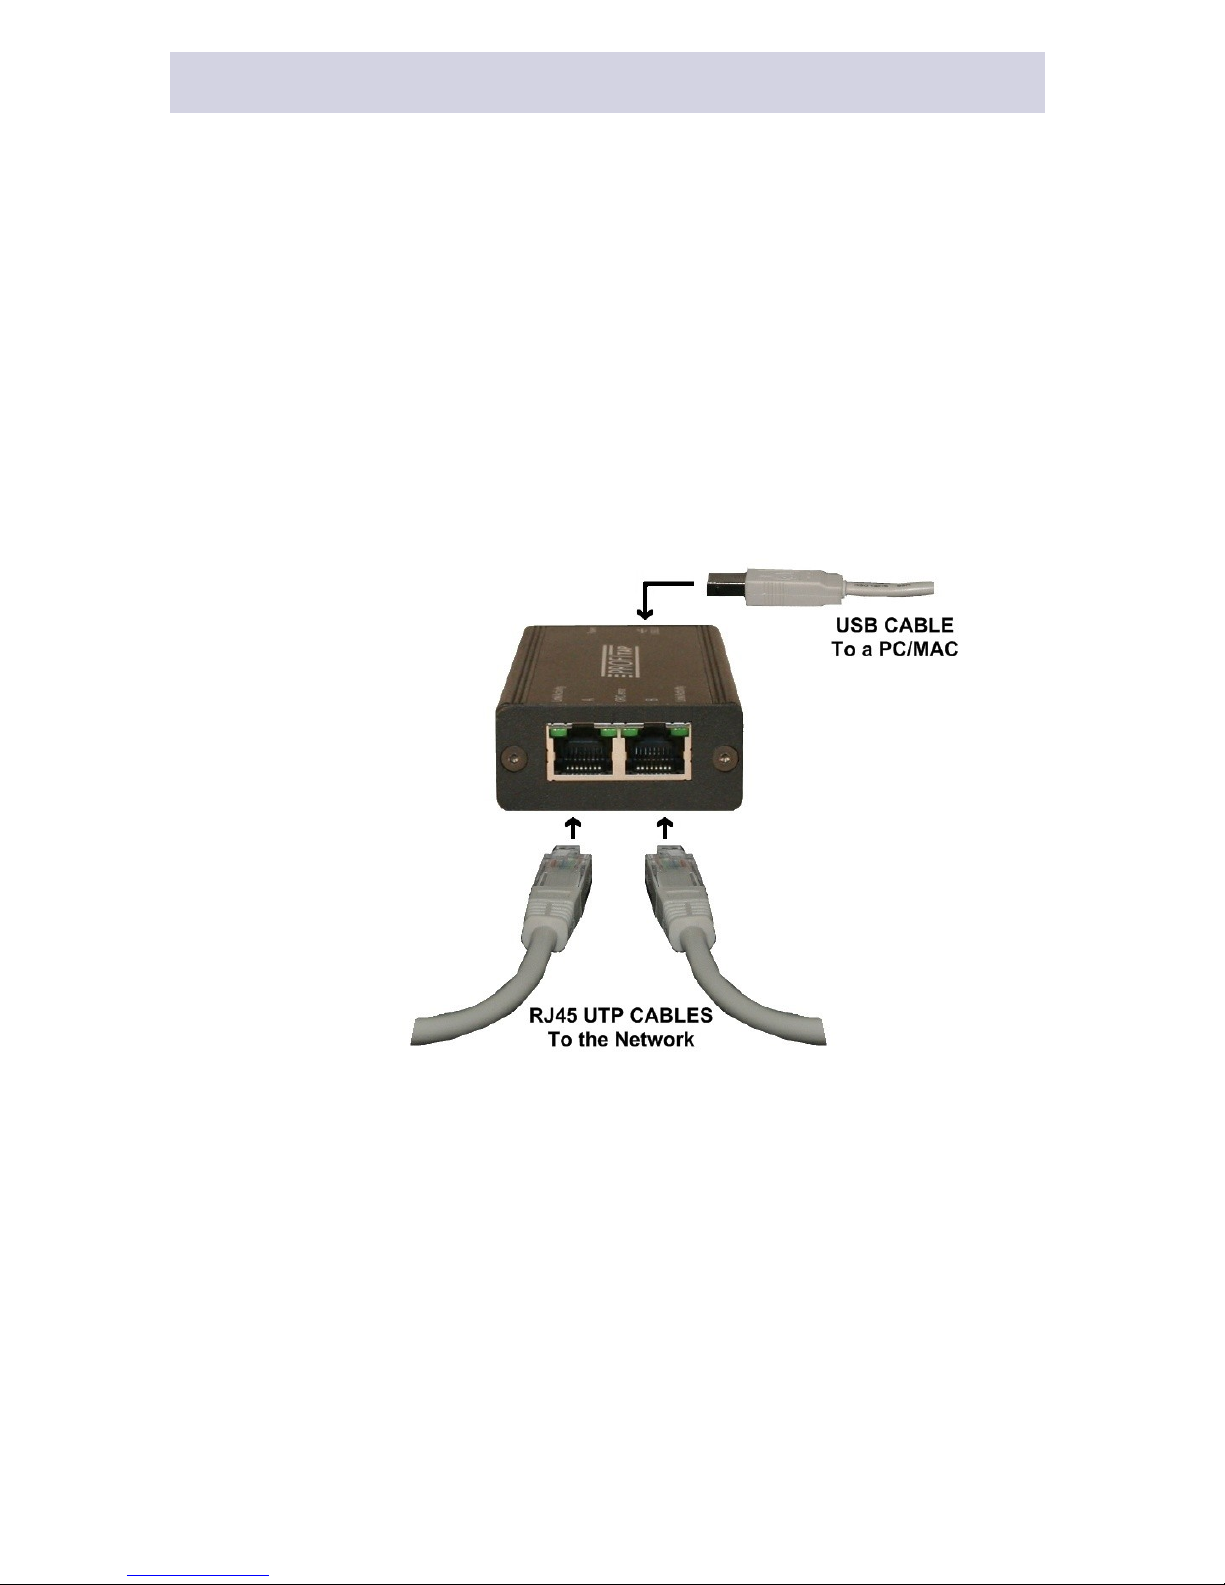
The following pictures show the new way using PROFISHARK:
PROFISHARK cuts down the equipment needed for Network Analysis, even
reducing the points of failure during Analysis. - only a Notebook and one
Page 4 LAN-WAN Test Equipment

The power is supplied by your monitoring equipment via USB2.0 connection,
no extra adaptor is required.
PROFISHARK is invisible to the network and does not interfere in auto nego-
tiation/
speed or duplex settings. The Permanent Network Link feature guarantees
permanent network connectivity and no package loss, also when power fails
or the USB port is disconnected. One LED shows Power, two LEDs shows
Link/Activity, two more show CRC Errors on monitored link.
PROFISHARK is designed to work with 3rd party software like Wireshark/
Ethereal,
Optiview, Etherpeek, etc. The USB key holds the necessary drivers and
powerful analysis software.
Due to the design of PROFISHARK, unlike ordinary NIC's, it passes the
information about MAC Level faults like CRC, etc. to the Analyzer.
There are several ways to indicate this kind of errors with PROFISHARK: via
LEDs on the frontpanel, via the EasyStat or with the used Analyzer.
Finally, ProfiTAP is declined under different versions depending on option
chosen. In fact we provide to our consumers the ability to lead their analysis
as they wish. Optional software is available to deal with your specific needs
such as EasyStat, NanoSec Converter and ProfiTAP User SetUp.
In this manual you will find everything you need about how to install and use
the product and its provided software.
www.profitap.com Page 5

2. PROFISHARK 100M Visual Description
1) Port A (RJ45) connected to the network
2) Port B (RJ45) connected to the network
3) Two green LEDs to indicate whether a CRC error occurs
4) Two green LEDs to indicate the activity on the network
5) Green LED to give information about power supply status
(e.g. lightning LED = device powered)
6) USB 2.0 connector linked to your monitoring device
(i.e. a laptop computer)
Page 6 LAN-WAN Test Equipment

3. Installation
www.profitap.com Page 7
3.1 Hardware & driver installation
a. Insert the USB key for accessing/copying the contents to an installa-
tion folder.
Note : It is recommended to copy the contents to your hard disk first, if there
is no more other USB2.0 port available. After copying you may disconnect the
USB key and proceed. Otherwise use the USB key for installation procedure
and decide to connect PROFISHARK to a second USB2.0 port and remove
USB key when finished.
b. Connect PROFISHARK to the network using Category 5 UTP cables.
Network Port A : to DCE by straight Cable / to DTE by cross-over cable.
Network Port B : to DTE by straight Cable / to DCE by cross-over cable.
The maximum distance between any of the connected devices is 90m.
c. Connect the USB port
Connect the USB port to a PC/MAC USB2.0 port, the Power LED lights. The
cable length should not exceed 5mtr.
Page 8 LAN-WAN Test Equipment

While plugging the USB cable, the CRC LEDs should light for approximately
one second to show what is your ProfiTAP factory configuration.
Right LED lightning indicates whether filter setup is available or not.
Left LED lightning indicates whether timestamp is enabled or not.
d. Install the driver
Install the driver according to your Operating System. The current available
drivers are located on the USB key at the driver section or within your installa-
tion directory on your hard disk.
Supported O.S. are :
Windows ME/98/CE 5.0
Windows XP/2000/Vista 32-bit
Windows XP/2003/Vista 64-bit
MAC OS X 32-bit/64-bit/x86/PowerPC
Linux kernel 2.6.0 ~ 2.6.13
Linux kernel 2.6.14 ~ 2.6.22
Please check the latest driver released for your Operating System in the User
Section at www.profitap.com. You need to be a registered User to access this
area. Registering is free and will let you participate on ongoing product im-
provements.
e. Setup the TAP Network Card
After the installation PROFISHARK presents itself as a virtual Network Inter-
face Card (NIC) to your Operating System and to any Analyzer.
The following settings are for internal communication only - there is no exter-
nal effect nor are these settings presented or exposed to the monitored link.
In any case we recommend to set an IP address. The installed TAP driver (as
under section d.) is represented as a Network Interface Card (NIC) to your
Operating System.
Configure the IP Protocol Stack :
IP address : 192.168.0.1
Submask : 255.0.0.0
Note : Gateway or DNS settings must be undefined.
PROFISHARK is now ready to use as source for your installed Analyzer or for
use with Easy Stat Tool
www.profitap.com Page 9

3.2 Analyzer installation
To perform analysis you can use either any of the supported Analyzer or the
powerfull Analyzer Wireshark provided on the USB key.
a. Selecting PROFISHARK as source for your Analyzer
Start your preferred Analyzer and select the new virtual device showing up at
the "select NIC" window. Refer to your Analyzer's manual or the User Help
about how to select a Network Interface Card.
b. Using alternative Wireshark/ EtheReal
As an option you may install an alternate Analyzer, i.e the one provided on
the USB key or even from any other source.
Notes :
Always follow the specific instructions as indicated by the installation wizard
of the chosen Analyzer.
In addition, perform step a. to enable PROFISHARK to be the selected
resource for Analysis.
Verify the listing on our website regarding supported Analyzers at the User
Section of www.profitap.com
Make sure to use the latest available version if any problem occurs with
PROFISHARK.
Page 10 LAN-WAN Test Equipment

4. Optional Software Description
On the front panel of PROFISHARK you will find the exact edition / version of
the purchased unit. This chapter is about the corresponding optional software.
www.profitap.com Page 11

4.1 EasyStat (model C1AP-100-S)
a. Installation
Using the EasyStat requires the installation of a Java based application,
located on the USB key or in your prior chosen installation folder on your local
hard disk.
Locate the folder "EasyStat" on USB key or at your installation directory on
the hard disk.
Copy the folder "EasyStat" with its subdirectories to a location on your hard
disk.
If you downloaded the latest version from the website, unzip the downloaded
file EasyStat.zip or .rar to the selected folder.
You may create a shortcut on your desktop to have EasyStat in one click
available.
Note : The EasyStat requires Java Runtime Environment installed on your
PC. This basic program is provided also on the USB key.
In addtion, Java Runtime is available as free download for various Operating
systems at www.java.com.
We recommend to have latest Java Runtime version running with your
ProfiTAP - checking the website of Java from time to time..
b. Description
EasyStat is a standalone application designed for PROFISHARK. There is no
need to deactivate your Analyzer while performing any action with that soft-
ware.
Locate the executable file EasyStat.jar in the folder "EasyStat" or any other
defined location as installed. Double-click on EasyStat.jar to execute the
application in the upcoming window.
Each time starting the ‘EasyStat <version>.jar’ will cause the automatic
creation of two csv-files in the same folder as the .jar file. This files will be
used to store the collected statistics and will be updated and expanded during
monitoring. You may erase this files after closing the PROFISHARK Network
Statistics or keep them for further usage.
As an overview and without any Analyzer functionality , this troubleshooting
tool will display in one quick view the bandwidth or any low layer errors by
Page 12 LAN-WAN Test Equipment

chart or graph prior to a deeper investigation performed by an Analyzer.
In addition to the display of CRC errors via LEDs on the front of
PROFISHARK device, it displays detailed informations about RX and TX lines
of the monitored link with the EasyStat.
Once PROFISHARK is connected to the Network and the USB2.0 port, it will
monitor all 7 layers at the link. To display the traffic in a listing or graphical
chart you need to run this Java application as prior installed under section
4.1.a.
The Stat Mode uses the TAP exclusive by default. For using the native Tap
Mode for Analyzer purposes toggle between Modes by selecting the check-
box Stat- or TAP-Mode.
Note : In some systems, the *.jar extension is associated to a different pro-
gram, e.g. Winrar or Nokia’s Cellphone applications . In this case, EasyStat
will be opened instead of being executed. Occasionally an undefined error
may occur. Correct this by deassociating the JAVA extension in your configu-
ration setting.
c. Usage
EasyStat provides several ways to display informations about traffic statistics.
The following pages give an overview about all the options.
Counters
www.profitap.com Page 13

The picture on the prior page shows the set of counters and informations
available for the monitored transmitted (TX) and received (RX) lines :
PROFISHARK counts the following events : CRC error, size bracket of fra-
mes, undersized and oversized frames, collisions and jabbers. Furthermore
the lower row gives the total of bytes seen.
In addition to above counters informations about average value per second,
percentage and differential are provided.
Every single column can be cleared by clicking on the buttons to the left of the
window.
Graphs
This screenshot shows a different way to display informations.
Select via checkboxes on the right to monitor the kind of events you want
track in real time on the graphs. It is also possible to either display the events
on percentage in total or by number of packets.
You may zoom in by drawing an area with the cursor starting with the top-left
corner to the bottom-right corner of the selection box. To cancel the zoom,
just perform another selection now starting now with the bottom-right corner
to the top-left corner.
Page 14 LAN-WAN Test Equipment

Meters
This view use meters and gauges in order to display the average bandwidth
utilization and CRC error occurances. The values are percentage of the total
of seen packets on the monitored TX and RX lines.
Log
This tab offers setting up thresholds for bandwidth traffic and CRC error and
to write an event into a log if the values exceeds this thresholds. The recor-
ded entries can be identified easily by type of event and its value and direc-
tion on the monitored link
www.profitap.com Page 15

Page 16 LAN-WAN Test Equipment
4.2 NanoSec Converter (model C1AP-100)
For Packet Capture with/via PROFISHARK, the TAP can be set to add a 5
nanosecond resolution time information to each packet. (see chapter: User
SetUp)
Note: As of today, to take advantage of this nanosecond timestamp it is
mandatory to perform the initial packet capture in combination of
PROFISHARK and Wireshark.
Per default, the Converter will read a recorded captured file and interpret this
additional precise timing information to create a new capture file with a Nano-
second resolution timing transferred to the standard position in each packet..
The new file will be stored again as *.pcap file. Depending on your Analyzer,
you may also use this new file on other Analysis equipment.
a. Installation
Copy the file ‘NanoSec Converter.jar’ on your hard disk.
You may create a shortcut on your desktop to have the Converter in one click
available.
Note : The software is a Java based application as well. Make sure you
installed JAVA on your computer first, otherwise refer to 4.1.a to install Java
Runtime.
b. How to use it?
During Packet Capture, the Wireshark Analyzer creates one or more *.pcap
files as being controlled by the user.
Locate the folder of the capture files and execute the NanoSec Converter.
The file(s) to be converted can be drag and dropped into the window of the
Converter tool (see picture on next page) and will be automatically processed.
To identify the converted file(s) in this folder each new file(s) will carry a
prefix ns.***.pcap.

Window of NanoSec Converter
During conversion, follow the instruction as displayed in the application
window.
Note : The native capture file(s) will not be changed.
After conversion, open the ns.***.pcap file(s) with Wireshark. You will find the
precise timing information at its proper position.
Note : Wireshark may store this new file in other than *.pcap formats to make
it available for other vendors import formats. Refer to your other Analyzers
for being able to work with time resolutions of less than microseconds first.
www.profitap.com Page 17

4.3 ProfiTAP User Setup (model C1AP-100)
The User SetUp is used at Model -T and -TF to enable or disable features or
setting up filters for individual use.
Depending on the demands for analysis you may intend to exclude some
unimportant data or any unwanted frames. You may need to reduce the
monitored traffic for your Analyzer or even exclude other devices for your
current environment.
With the provided filter cababilities PROFISHARK will work in a customized
setting for temporary or permanent usage.
PROFISHARK’s filter mechanic work almost like a pure hardwarefilter - using
this features result in a better performance during packet capture and helps to
keep an eye on the important things.
1. Installation
Install WinPcap 3.1 or above on your computer either by downloading it at
www.winpcap.org or by installing Wireshark (see section 3.2.b).
Locate the folder named "ProfiTAP: User SetUp" on the USB key. As a
registered customer you may check for latest available versions at our websi-
te www.profitap.com.
Copy the files ‘User SetUp.jar’ and ‘jnetpcap.dll’ to the same directory on your
hard disk. If you’re running a Windows based OS, you can copy ‘jnetpcap.dll’
to c:\windows\system32 instead.
You may create a shortcut on your desktop to have the ProfiTAP User SetUp
available in one click.
Notes :
The software is a Java based application as well. Make sure you have instal-
led JAVA on your computer first, otherwise refer to 4.1.a to install Java Runti-
me.
Furthermore, in some systems, the *.jar extension is associated to a different
program, e.g. Winrar or Nokia’s Cellphone applications . In this case, EasyS-
tat will be opened instead of being executed. Occasionally an undefined error
may occur. Correct this by deassociating the JAVA extension in your configu-
ration setting.
The next pages give detailed informations about the functionality offered by
PROFISHARK.
Page 18 LAN-WAN Test Equipment

2. Usage
Run the program: a green button in the upper left corner of the User SetUp
window indicates that PROFISHARK is properly installed and connected.
As shown above there are four configurable options/settings available :
- CRC error filter
- CRC32 remover
- TimeStamp enable/disable
- MAC/IPv4 adress & protocol filter
www.profitap.com Page 19

a. CRC error filter (deactivated by default)
You may decide not to keep packets corrupted by a CRC error. Select the
checkbox ‘Enable CRC error filter‘ to exclude those packets upstream to the
Analyzer during your analysis.
b. CRC32 remover (deactivated by default)
You may consider CRC32 bytes to be useless, This option allows the TAP to
truncate this information from your frames. Please keep in mind that since
ProfiTAP natively keeps packets containing CRC errors, all of the erro-
neous packets will be treated like fair ones.
c. Timestamp enable/disable (activated by default)
PROFISHARK adds a timestamp field to each packet seen on the monitored
link. (see chapter 4.2). To disable this option, deselect the ‘Enable Times-
tamps’ checkbox.
Note: Disable this feature will result in a traditional recording of packets
during capture without 5nS-time information appendix.
d. MAC/IPv4 adress & protocol filter (empty by default)
Due its nature, a standard TAP is transparent and forwards all packets seen
without any restrictions upstream to your Analyzer.
Setting up this Filters allow to control the monitorer dataflow upstream to your
Analyzer by a range of MAC/IPv4 adresses and/or protocol type to keep or to
discard.
General
The filters are straight solutions. There is only one Filter active at a time. The
most important decison has to be made by defining the way the filter should
work : creating an excluding or including filter (see next page)
You may combine all filter options to one filter, i.e. Ethertype plus one MAC
Adress plus IP Range.
About Ethernet MAC area :
Replace ‘XX.XX..’ with a full or a partial hexadecimal MAC address in order to
either select one specific or a range of source and/or destination addresses.
Page 20 LAN-WAN Test Equipment
Other manuals for PROFISHARK 100M
1
Table of contents
Other ProfiTap Measuring Instrument manuals


Popular Measuring Instrument manuals by other brands


Leica Geosystems
Leica Geosystems Rugby 640 quick start

RKI Instruments
RKI Instruments GX-8000 operating manual

Cloudray
Cloudray 3DM580S user manual

Stabila
Stabila LD 400 operating instructions

ETAS
ETAS ES1336.1 user guide

Greyline Instruments
Greyline Instruments SFM 6.1 Installation & operation instructions