RadonTec Expert+ User manual

Radona Expert+
Version: normal, without steering output
06.04.2021
Manual
The RadonTec Radona Expert+, is the new way measure your radon air level. The device not only
impresses with its attractive appearance, but also with its inner values. Thanks to the FTLAB
ionization chamber technology used by Waltec, the Radona radon measuring instrument can
achieve up to 20 times faster measuring times than
other comparable measuring instruments. In
addition, the Radona can also be used for time-
resolved measurements, as the radon concentration
is measured every 10 minutes. The radon measuring
instrument Radona was developed especially for
professional users and interested private users. In
addition to the radon meter itself, the scope of
delivery includes a power supply unit and a USB-C
cable (for reading the data with the PC and for
charging). With the graphical display you have
different views on the measured data even without
transferring the data to a personal computer.

2
Technical details
●Pulsed Ionization Chamber type from FTLAB RD200M
●Meaningful measured values in less than 1 hour
●Measuring and storage interval: 60-minutes
●Sensitivity : 0.5cpm/pCi/l at 10pCi/l (30cph/pCi/l)
●Operating range : 10~40℃, RH < 90%
●Measuring range: 1 ~ 3700 Bq/m3 (0,1 ~ 99,99 pCI/l )
●Precision : < 10% at 10pCi/l
●Accuracy : < ±10% (min. error <±0.5pCi/l )
●power supply: DC 5 Volt (± 0,1 Volt), 155 mA (USB-C cabel)
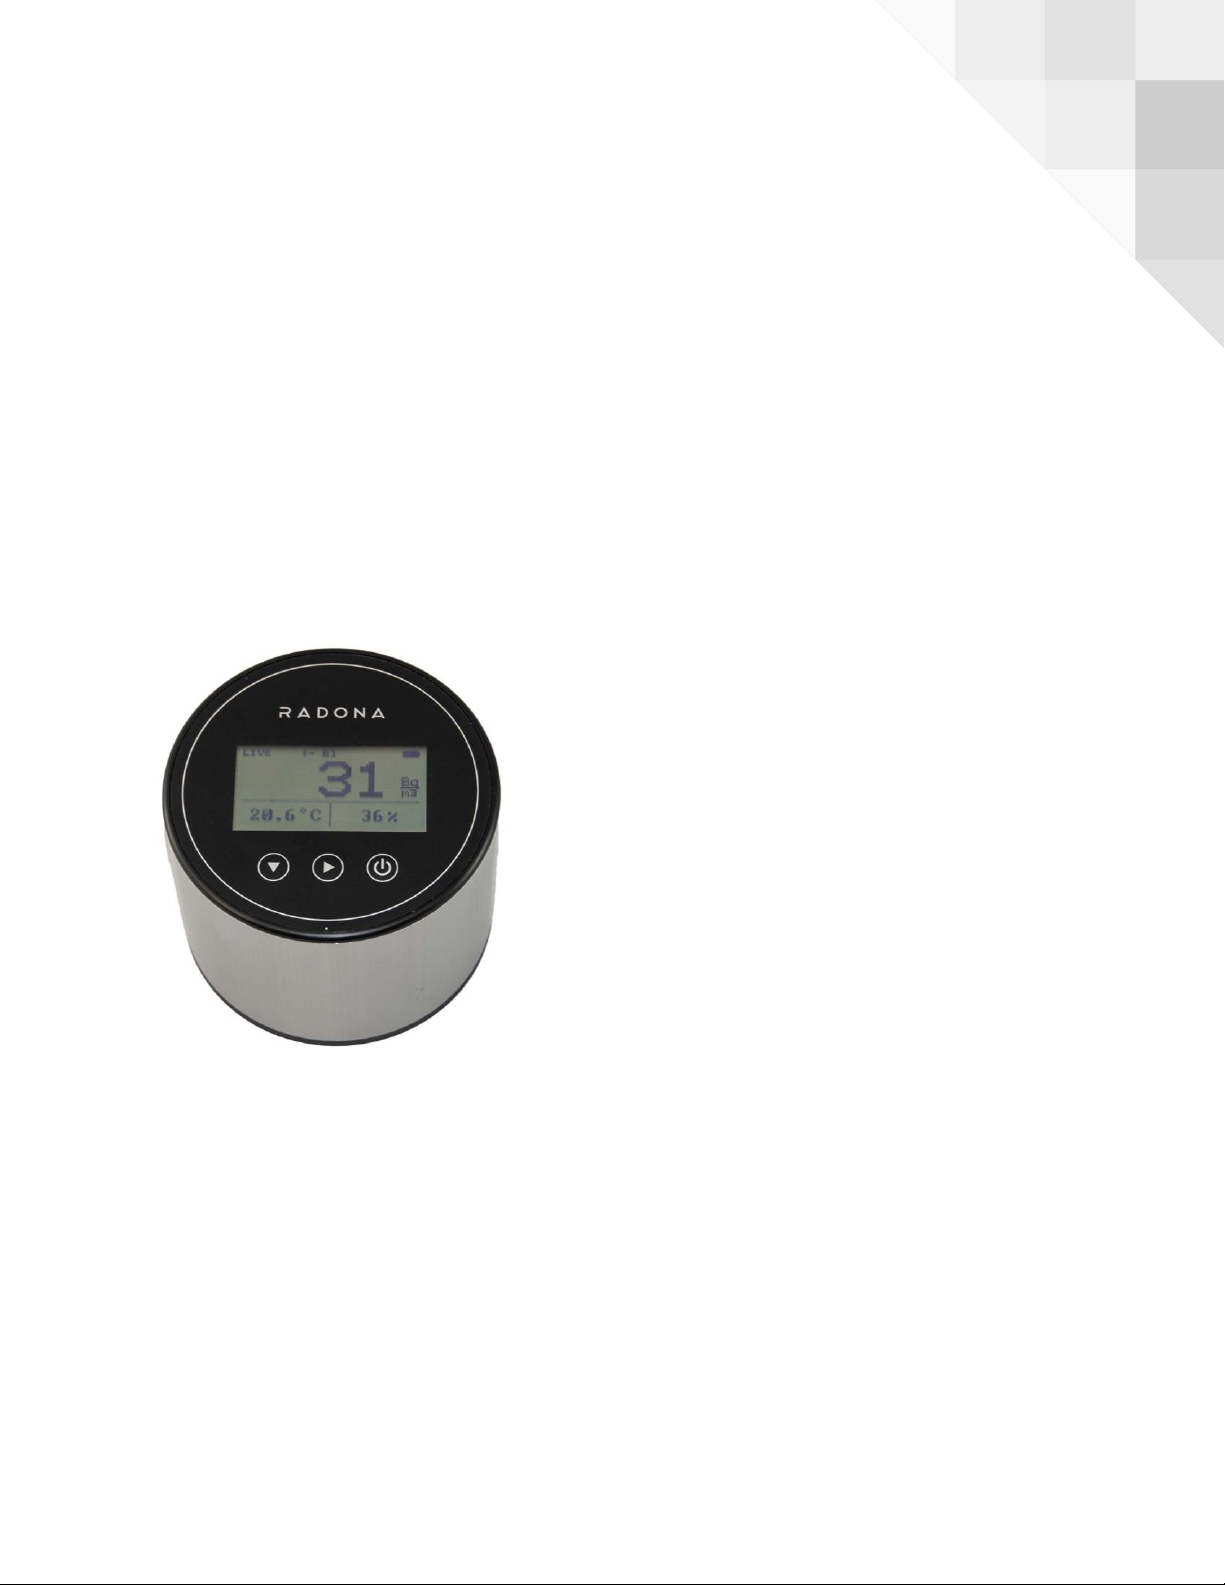
●Dimensions: Diameter: 13 cm, heigh: 12 cm, weight: 840 g
●connectivity: USB (USB-C)
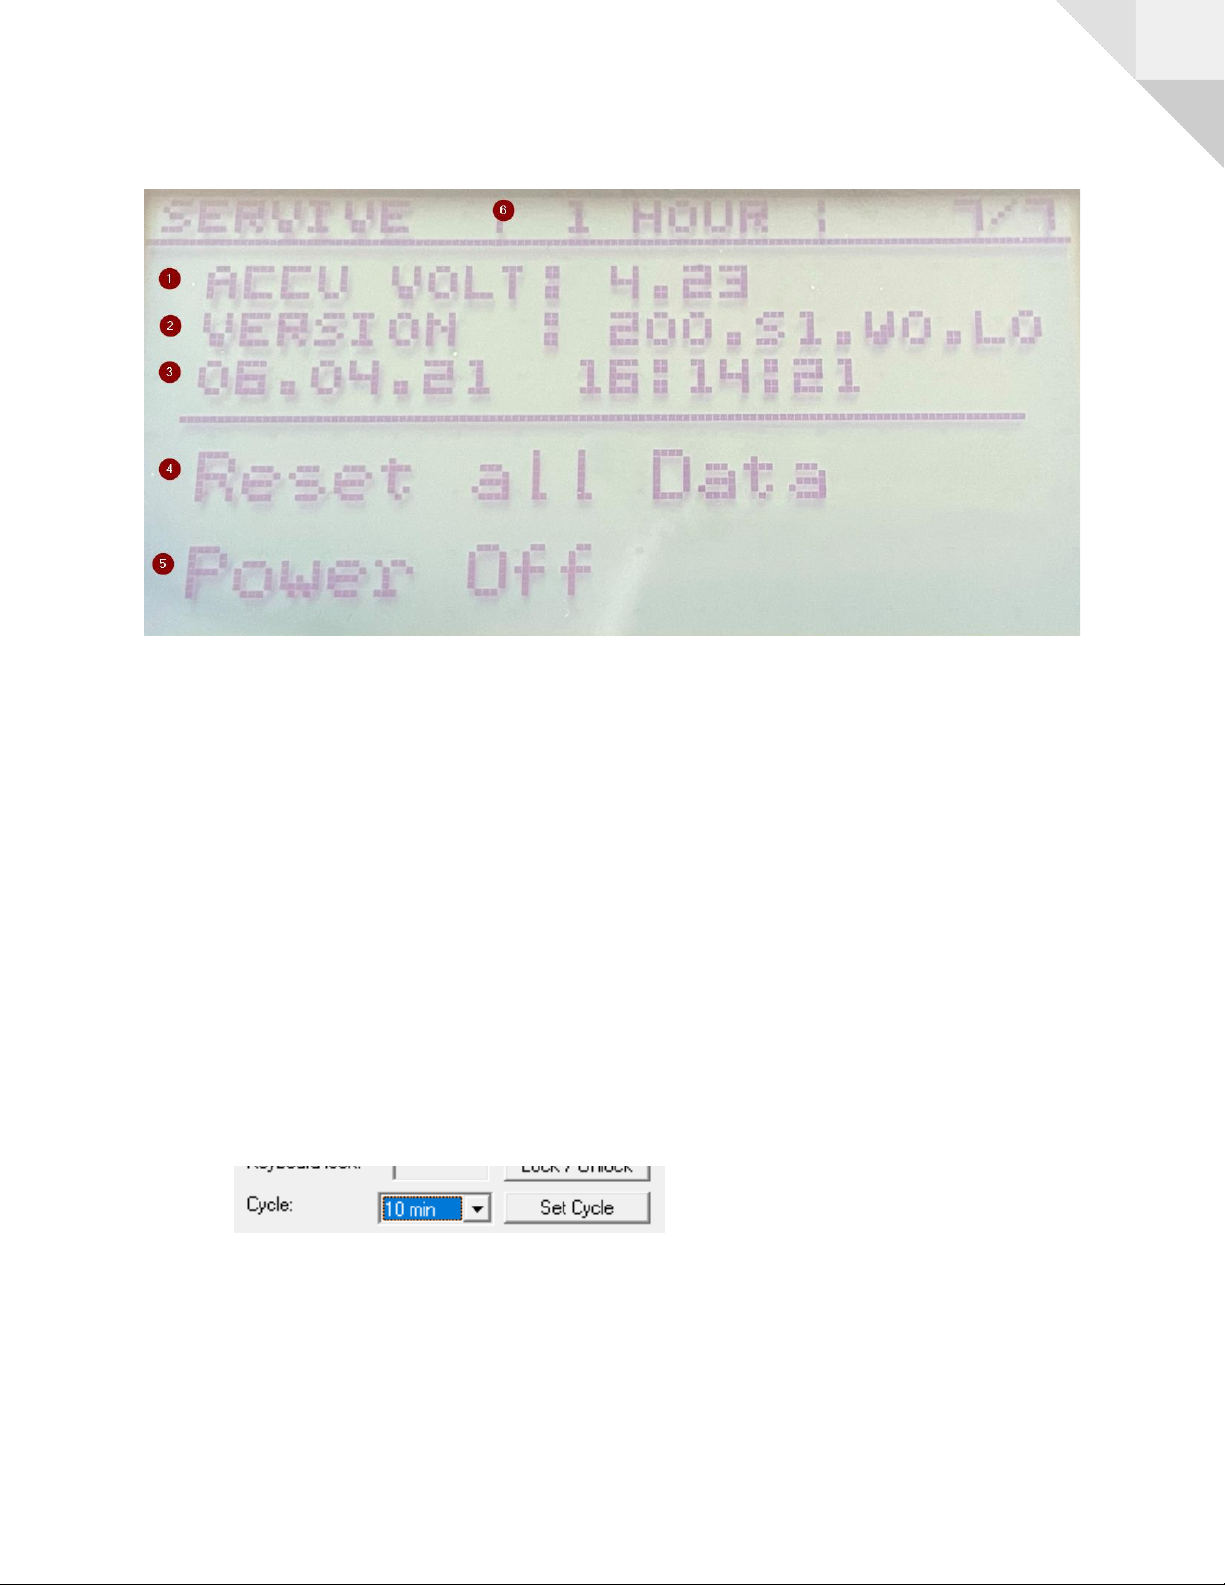
●Data storage (10 minutes or 60 minutes interval
adjustable): of radon, date, time, air pressure, temperature
& humidity), ring memory (older data are overwritten by the
new ones).
●Data storage: 2 months at 10 minute intervals
12 months in 60 minutes interval
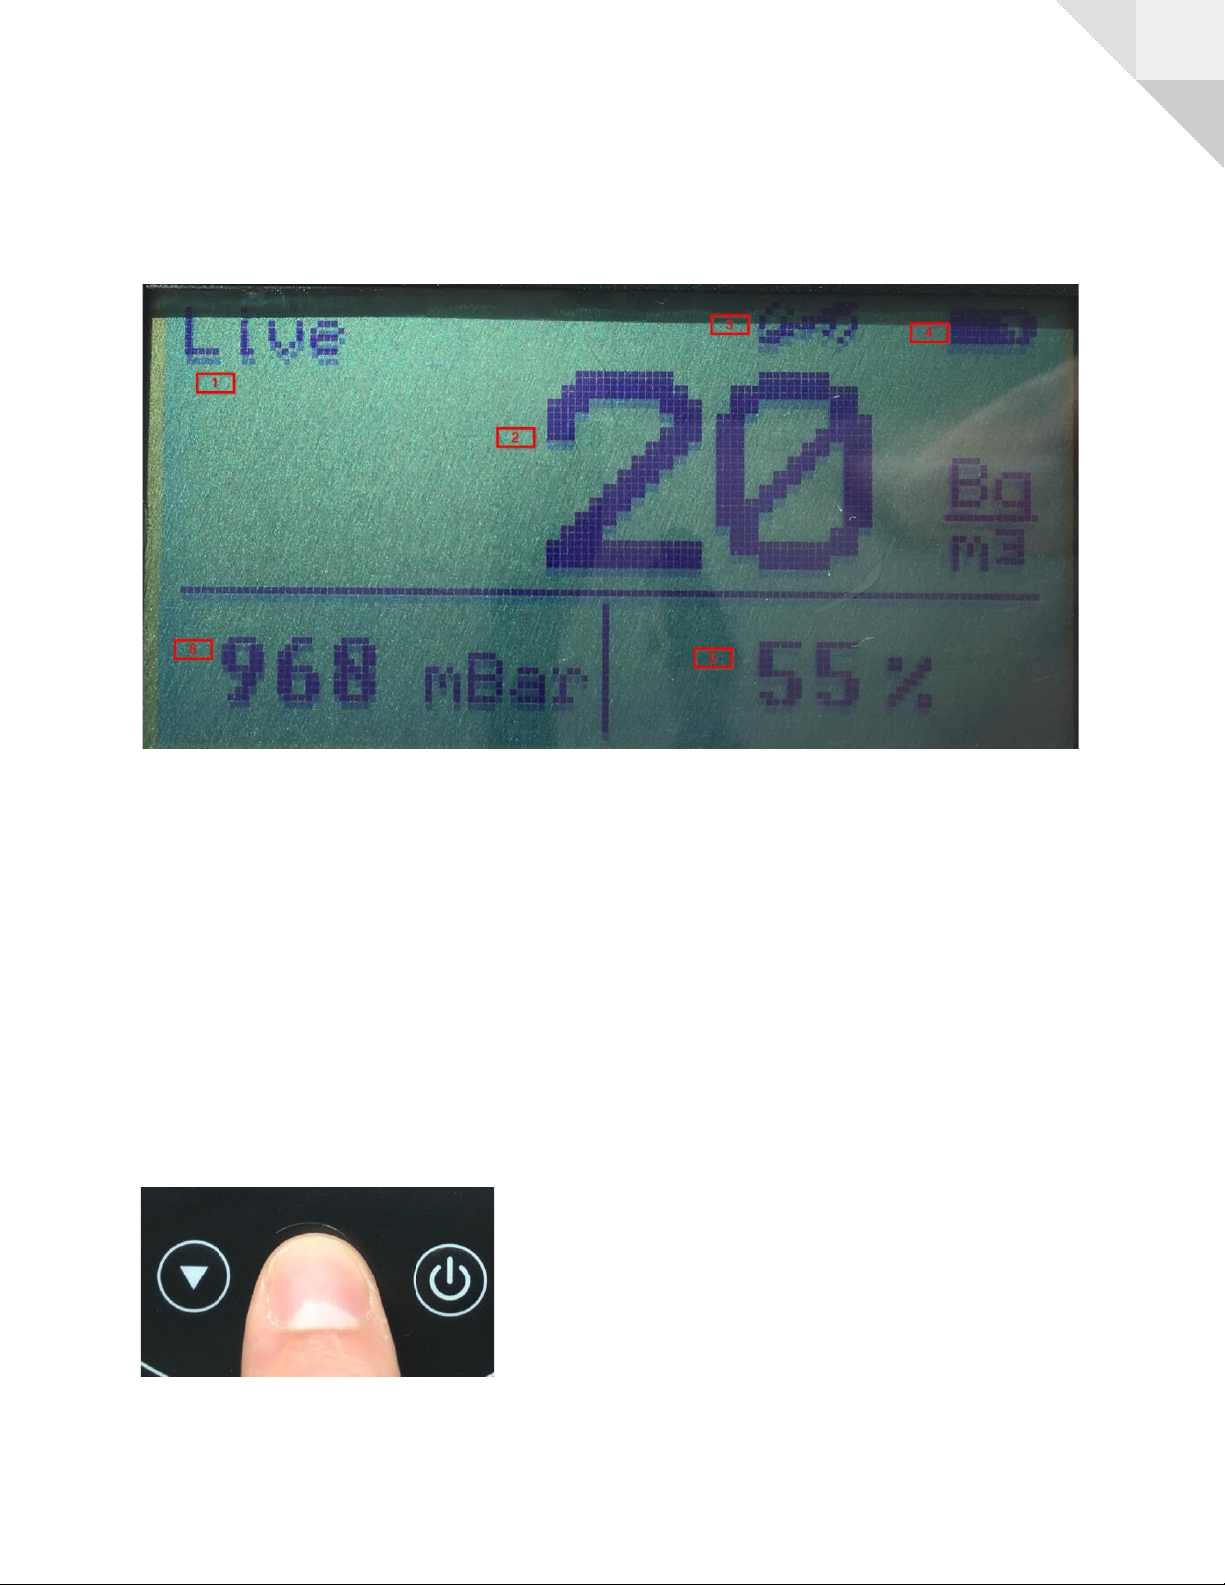
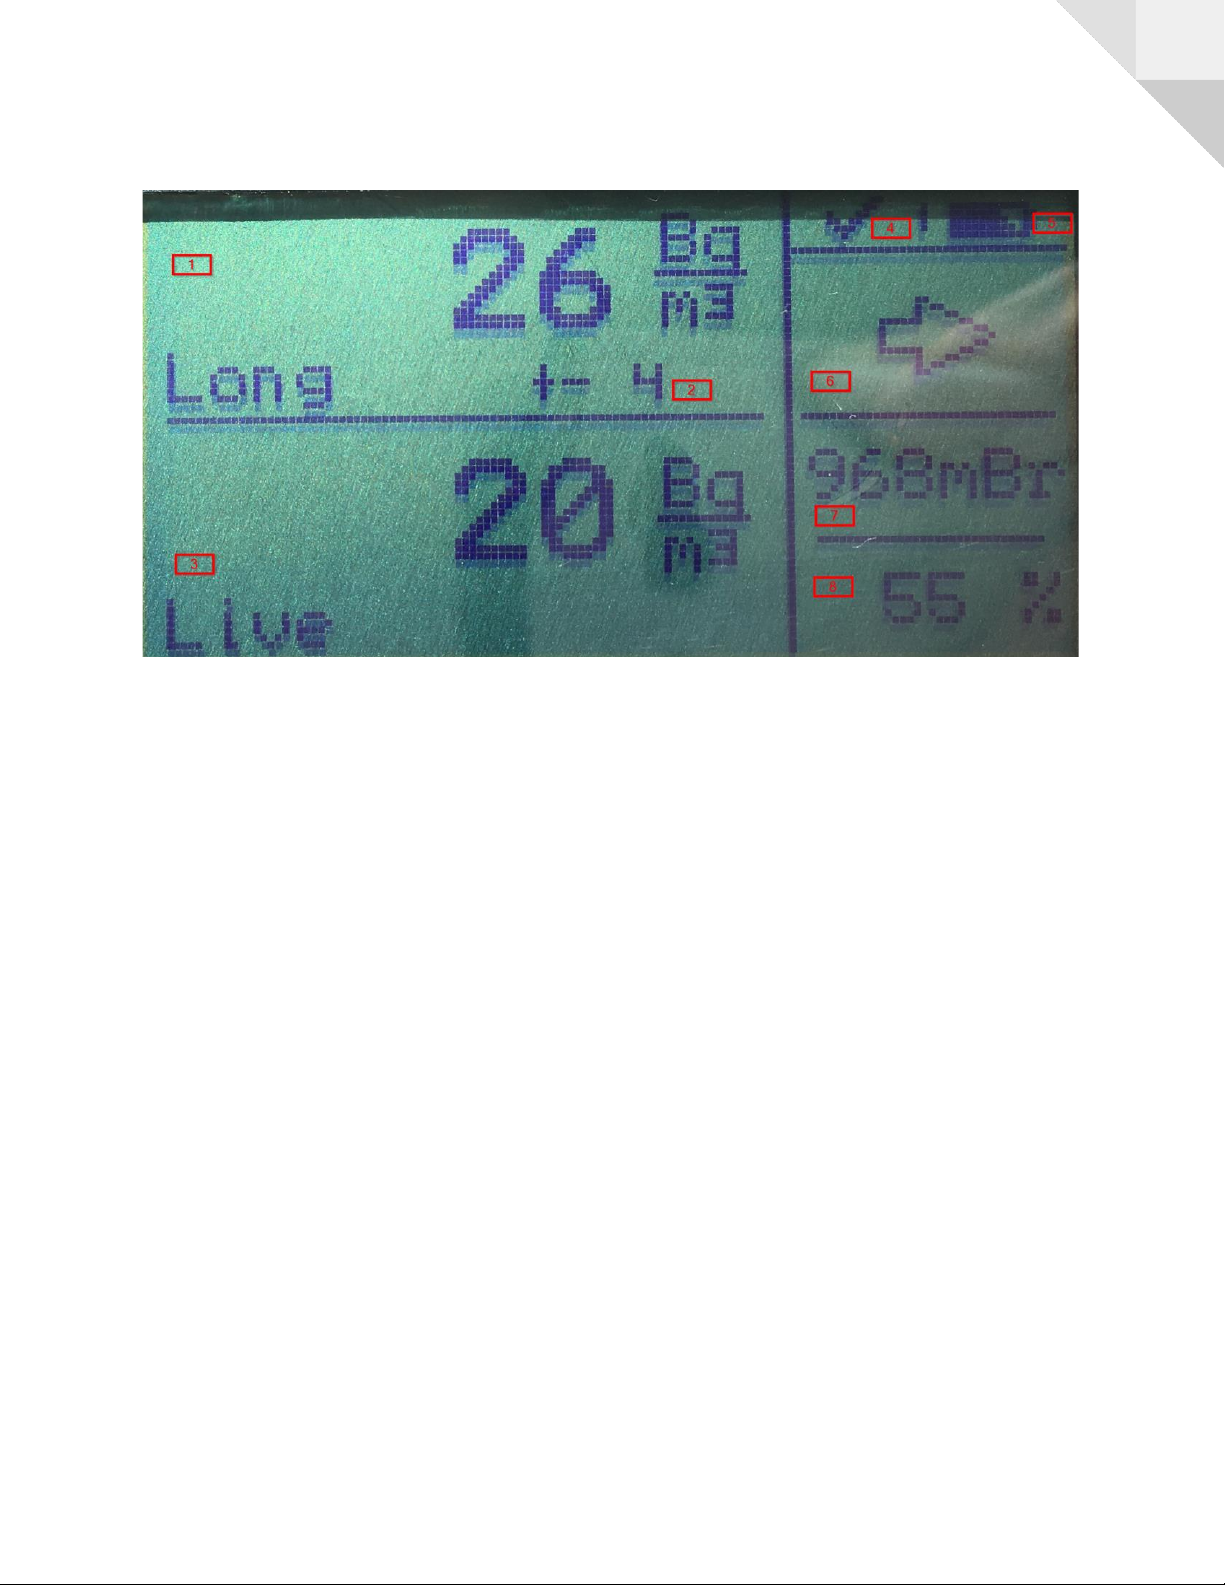
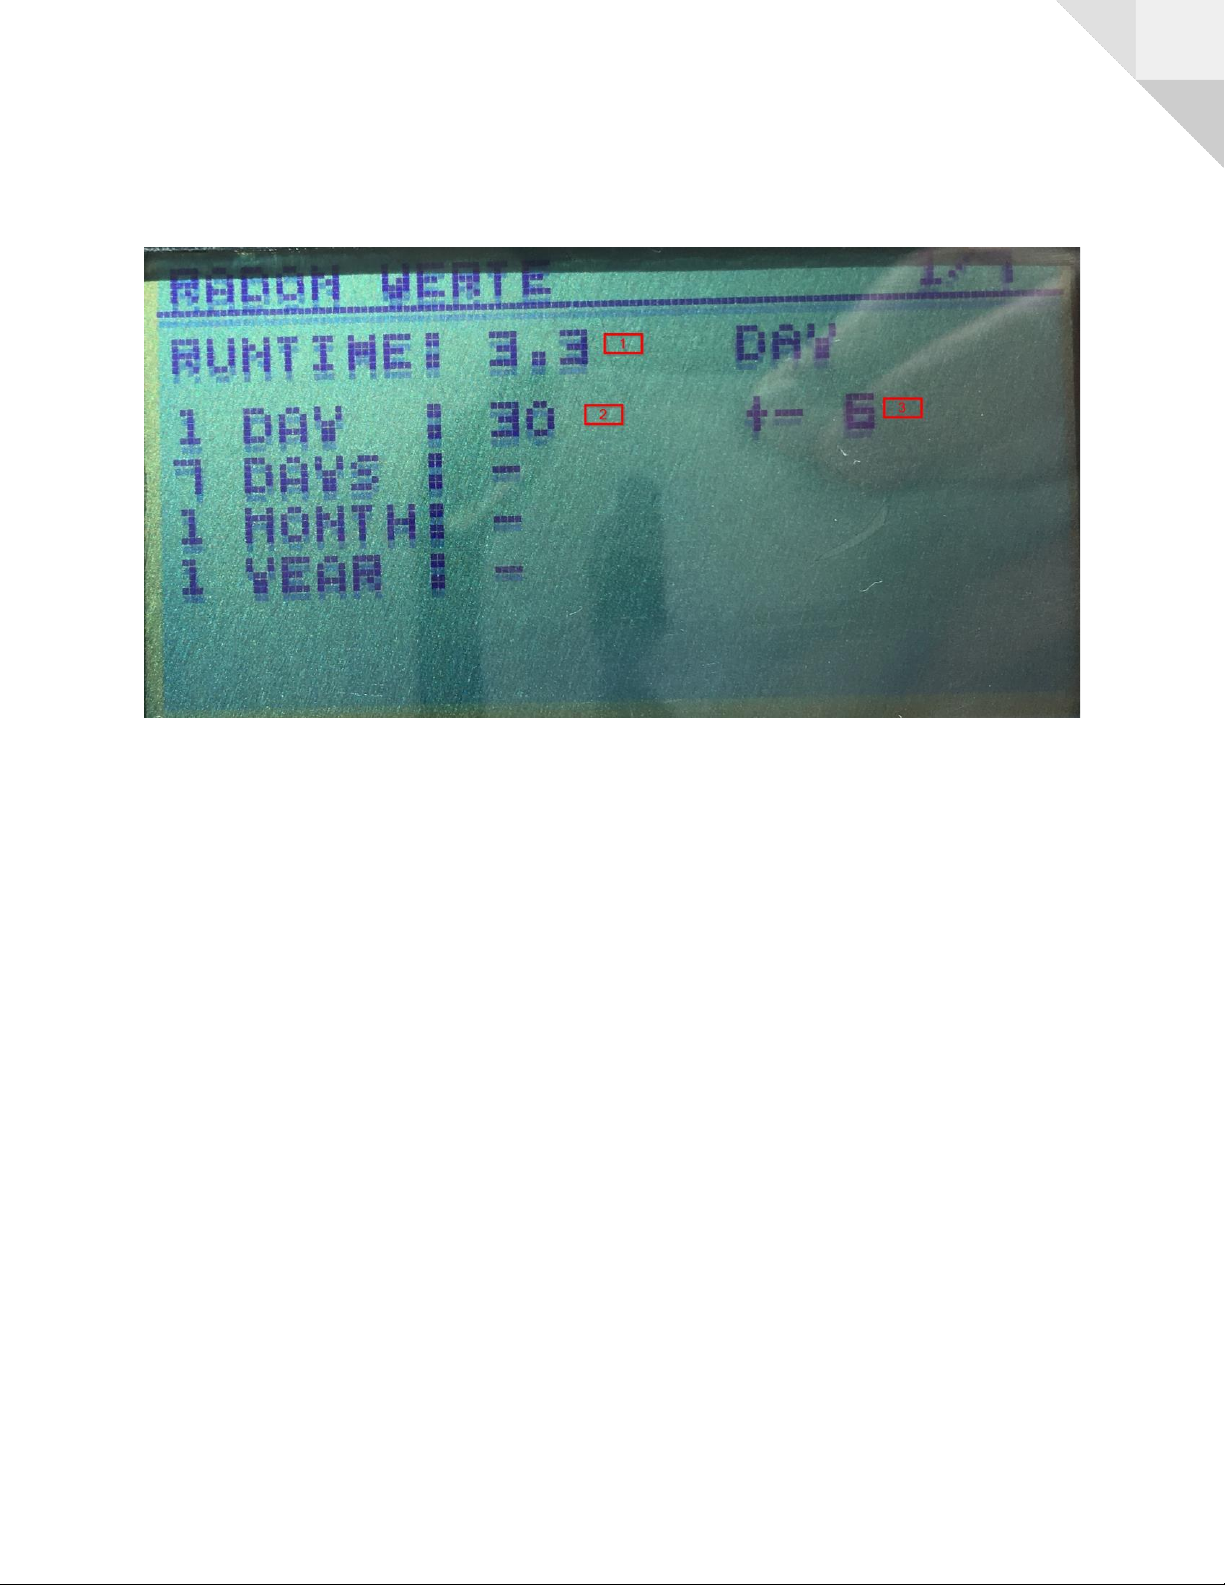
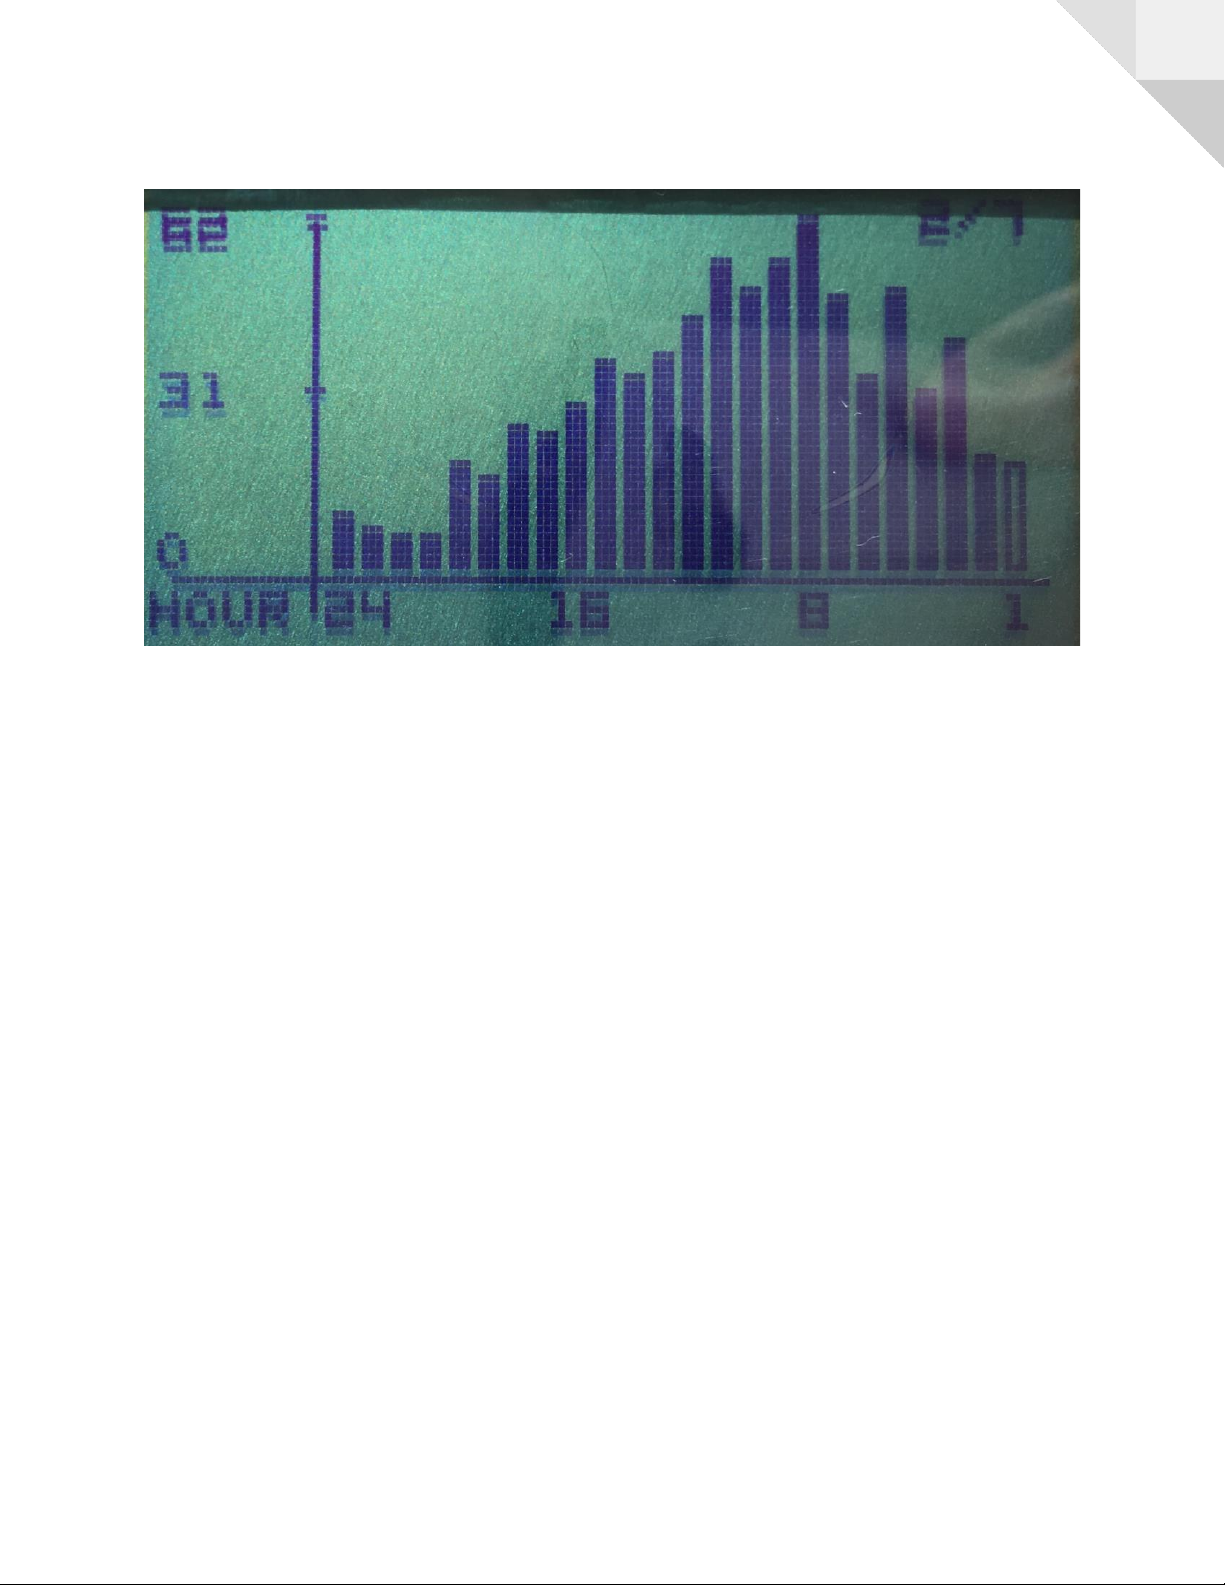
●Display: LCD full graphic (with different views)
●Battery lasts for approx. 24 hours (device can be
charged/continuously operated with USB cable)
●Does not use radio standards and emit very little
electromagnetic radiation (aluminium housing and no
active radio chips installed)
●Real time clock (each measured value receives a time
stamp)
●Made in Germany

3
Display and menu navigation
1] Allows scrolling down (function exists only
in some views)
2] Use this key to navigate through the
individual views.
3] To switch on, press the button briefly. To
switch off, press and hold for approx. 3
seconds until Off appears on the screen.

4
Mainview
The unit can be switched on for approx. 2 seconds by pressing the 3] key. The first screen is the
main screen.
1) Indicates that the displayed value is the real-time radon value (value is updated between
5-10 minutes)
2) Current / Live radon value
3) WLAN symbol, crossed out (as here in the picture) means that the device does not have
a WLAN module.
4) Indicates the battery level. When the device is being charged, a charging symbol
appears.
5) current humidity (sensor is queried every 10 minutes)
6) current air pressure (sensor is queried every 10 minutes)
You can access the different views by pressing this button

5
Second view
1) Indicates the Radon mean value (over all measured values stored in the instrument)
2) Specifies the statistical inaccuracy/deviation for this value
3) The current radon value
4) The hook means that the measuring chamber is functioning correctly. 049 would
indicate a problem with the measuring chamber.
5) battery level
6) Indicates the tendency of radon development. Arrow up means that the radon value
tends to rise, arrow horizontal (as in the figure) indicates a stable radon value. Arrow
down predicts a decreasing radon value.
7) current air pressure
8) current humidity

6
Further views
The other views (sub-views) are divided into seven different views.
1) Indicates the running time of the measuring device (since the last reset).
2) Displays the Radon averages of the last day, the last 7 days, the last month and the last
year.
3) The statistically calculated inaccuracy is always displayed behind the mean values.

7
Display of the radon value within the last 24 hours (x-axis is the hours, Y-axis is the height of the
radon value). The Y-axis adapts to the highest radon value. On the far right there is always the
bar which shows the current value (marked by an unfilled bar). An unfilled bar can still change in
height until it becomes a filled bar.

8
Graphical representation of the radon value. The current value is always rightmost. The graph
builds up from right to left and is continuous after 90 hours. With this view you always have the
radon concentration of the last 2 days at a glance.
Graphical bar display of the radon value of the last 31 days. On the right is the current day.

9
Graphical bar display of the radon value at month level. On the right is the current month, this
bar changes until the month measurement is completed and another bar is displayed.

10
The last view in the meter
1) Indicates the voltage of the battery. The device switches off automatically when the
voltage falls below 3.05V.
2) Specifies the status of the software version.
3) Displays the time and date used in the meter. This time is also used when saving the
measured values.
4) With this menu item, all data in the meter can be deleted/reset. To do this, press the
middle button for approx. 5 seconds.
5) This menu item can be used to switch off the meter (alternatively by pressing the On/Off
button on the meter for about 4 seconds).
6) Interval 1 hour or 10 minutes (The setting can be adjusted in the Radona Data Download
Tool) under the Cylce menu item.

11
Menu items 4 and 5 can be selected with this key:
This action can then be performed by pressing the center button. However, to reset all data, the
center button must be held down for approx. 5 seconds.

12
PC Radona download tool
The Radona Expert+ comes with the Radona Data Download Tool free of charge.
The current version is enclosed with the measuring device on a USB stick.
The above package already includes the USB driver, which can also be downloaded directly
from the manufacturer if required:
https://www.silabs.com/products/development-tools/software/usb-to-uart-bridge-vcp-drivers

13
1) COM port selection, is automatically selected when the program is opened before plugging
in the Radona Expert+ using the USB cable.
2) Download the data from the device
3) Export the data to a CSV file
4) Sending the current computer time to the device
5) All measurement data on the meter are deleted and the current time is set.
6) The measuring instruments can be numbered (this appears in the export file and when
downloading the data in the measuring instrument).
7) Contrast of the screen can be adjusted
8) With this key the screen and the keys of the measuring instrument are locked (for
measurements at the customer). Charging and measuring continue as usual.
9) Keys on the meter are disabled
10) This bar can be moved with the left mouse button to select the zoom area.
11) have a look at 10)
12) Radon, humidity, temperature and air pressure can be faded in/out.
13) Log window
Table of contents