Smart Fibres SmartScan SBI User manual

D01816562 Rev A
30/04/2020
SmartScan SBI Interrogator
Product Manual

Page 2
Introduction.........................................................................................................................3
Product Description......................................................................................................... 3
OEM Options................................................................................................................... 3
Packing List..................................................................................................................... 5
Safety Information............................................................................................................... 5
Safety Symbols ............................................................................................................... 5
Laser Safety.................................................................................................................... 5
CE Compliance...............................................................................................................5
Specifications......................................................................................................................6
Installation...........................................................................................................................7
Mounting Details ............................................................................................................. 7
Electrical and Optical Connections..................................................................................7
Heat Sinking.................................................................................................................... 7
Jumpers .......................................................................................................................... 8
DIP switch....................................................................................................................... 8
Developer Files................................................................................................................... 8
Processing Module .............................................................................................................8
SmartSoft for SmartScan Software Installation ............................................................... 9
Switching on the Interrogator .......................................................................................... 9
Switching off the Interrogator ..........................................................................................9
Maintenance....................................................................................................................... 9
Appendix A - SmartSoft for SmartScan SBI User Manual................................................. 10
Installation..................................................................................................................... 10
Preparing For Use......................................................................................................... 10
Basic Acquisition........................................................................................................... 12
Instrument Set-Up......................................................................................................... 15
Enhanced Acquisition.................................................................................................... 21
Appendix B - IP Address Settings of Host PC................................................................... 32
Appendix C –SmartScan HTTP Interface ........................................................................ 33
http interface ................................................................................................................. 33
Network......................................................................................................................... 34
Transferring data from On-board Storage to PC ........................................................... 39
Appendix D - Optical Connector Cleaning ........................................................................ 43
Appendix E –CE Compliance Information........................................................................ 47

Page 3
Introduction
Product Description
SmartScan Single Board Interrogator (SBI) is designed to interrogate FBG gratings and determine their peak
wavelengths. It is intended for Original Equipment Manufacturer (OEM) use for integration into a client’s
equipment or system. It requires a Processing Module with compatible PC-104 connection to set up its
hardware registers and read spectrum and peak location data from its buffers. Usually the SBI is supplied
with a TS-7200 Processing Module for this purpose, a PC-104 compatible Single Board Computer (SBC) with
an ARM processor but the OEM is free to use any suitable off-the-shelf SBC or design their own interface
electronics.
The SBI together with the Processing Module operates as a complete interrogator for dynamic
measurement of Fibre Bragg Grating (FBG) sensors, it is particularly suited to industrial environments. This
Wavelength Division Multiplexing (WDM) instrument is based on an agile, tunable laser source that enables
high-resolution interrogation at multi-kHz frequencies.
SmartScan SBI is available with up to 4 optical channels; multiple sensors can be multiplexed on each fibre
without reducing acquisition speed or performance.
OEM Options
When purchasing an SBI the OEM has a number of options on how to integrate it into their own
equipment, each option requires progressively more development by the OEM:
Option 1 –Purchase an SBI and TS-7200 Processing Module, design your own housing and qualify to the
relevant CE or equivalent regional standards for your market sector and operating environment. With this
option the equipment operates as a fully functioning interrogator out of the box and is compatible with the
SmartSoft PC application which can be used for configuration and data presentation.
Option 2 –Purchase an SBI and TS-7200 Processing Module, design your own housing and qualify to the
relevant CE or equivalent regional standards for your market sector and operating environment. Instead of
using SmartSoft Develop your own customised PC or PLC application for configuration and data
presentation.
Option 3 - Purchase an SBI and TS-7200 Processing Module, design your own housing and qualify to the
relevant CE or equivalent regional standards for your market sector and operating environment. Develop
your own bespoke embedded application to run on the TS-7200, a C library, cross-compiler and
documentation is available to download from our website.
Option 4 –Purchase an SBI only and develop your own PC-104 interface and processing electronics or
integrate with your existing processing electronics, a C library, cross-compiler and documentation is
available to download from our website and may be used to provide an example framework. The whole
equipment design will need to be qualified to the relevant CE or equivalent regional standards for your
market sector and operating environment.

Page 4
Figure 1 - SmartScan SBI + PM System Diagram
Laser
Laser
Drive
Detection
Circuits
Peak
Processing
PC-104 Interface
High-level
processing
Comms
FBG1
FBG2
FBGn
FBG1
FBG2
FBGn
FBG1
FBG2
FBGn
FBG1
FBG2
FBGn
SBI
PM
RJ45
DC In
+9 to +32 VDC,
15 W Supply
Host PC
Page 5
Packing List
The SmartScan package should contain the following items as standard:
- SmartScan Single Board Interrogator
- OPTIONALLY: TS-7200 Processing Module
- Rugged carry case
- Quick start guide
- Ethernet Cross-over cable assembly
- Cletop-S Fibre Optic Connector Cleaner
If any items are missing please contact Smart Fibres or your local representative immediately.
Safety Information
Safety Symbols
The following symbols may be present on the unit:
Symbol
Description
Laser Safety. Refer to user manual for safety instructions for use.
Refer to user manual for safety instructions for use and handling.
Laser Safety
Applicable Standard:
EN60825-1 (Safety of Laser Products)
Laser Type:
CW
Laser Class:
1M
Max power:
2.5 mW
Wavelength:
1528-1568 nm
The optical outputs for the interrogator are safe to view with the naked eye but should not be
viewed through optical instruments such as microscopes and telescopes. If viewing optical connector
faces using optical instruments the interrogator must first be powered off.
Refer servicing only to qualified and authorised personnel.
WARNING: Use of controls or adjustment of performance or procedures other than those specified
for the laser source may result in hazardous radiation exposure.
CE Compliance
When housed in a suitable metallic enclosure with appropriate I/O filtering the SBI + TS-7200
Processing Module has been demonstrated to meet EN61326-1 (Electrical equipment for
measurement, control and laboratory use. EMC requirements). However, as the SBI and optional
Processing Module are intended for OEM use it is the Original Equipment Manufacturer’s
responsibility to ensure that the relevant CE standards are met for the equipment into which it is
integrated.

Page 6
Specifications
Below are the Performance Specifications of the Instrument at the time of publishing this document.
Specification may be subject to change. The latest specifications are available at
https://www.smartfibres.com/products/smartscan-sbi
Measurement and Processing
Wavelength Range
40 nm (1528 to 1568 nm)
Optical Channels
4
Max. Sensors Per Channel
16
Max. Sensors in Total
64
Scan Frequency (all channels
simultaneously)1
2.5 kHz (Lite Model 250 Hz)
Max. Scan Frequency (individual
FBGs)2
25 kHz (Lite Model 2.5 kHz)
Repeatability3, 5
< 1 pm
Wavelength Stability
± 5 pm over operating temperature range,
± 20 pm over 25 years
Dynamic Range4
27 dB
Gain Control
9 levels, per channel or per sensor,
automatic or user controlled
Suitable FBG Profile (FWHM)
Minimum > 0.2 nm, > 0.5 nm recommended
Mechanical, Environmental and Electrical
Weight kg / lbs
250g / 0.55 lbs
Dimensions H x D6
108 x 160 mm / 4.25 x 6.3″
Operating Temperature
-20 to +65 °C / -4 to 149 °F
EMC
Compliance is the responsibility of Systems Integrator
Comms Interface
PC-104
Power Connector
2-way screw terminal
Optical Connector
FC/APC
Input Voltage
+9 to +32 VDC
Power Consumption
typ. 6 W
1. SmartScan SBI interrogates all 4 channels simultaneously. On each channel, every sensor
is interrogated at a speed of 2.5 kHz.
2. Up to 25 kHz scanning is possible at reduced bandwidth.
3. Measured over 1 minute, standard uncertainty (1 σ distribution).
4. Maximum attenuation of reflected signal before measurement performance is affected.
5. Using recommended FWHM as stated.
6. Dimensions excluding the optional optical connector frame.
The latest specifications for the TS-7200 Processing Module are available at:
https://www.smartfibres.com/products/sbi-processing-module

Page 7
Installation
Mounting Details
SmartScan SBI is fitted with a set of M3 Hexagonal spacers that can be used for mounting. The
mountings are spaced in accordance with the PC-104 standard:
85.7 mm / 3.375
85.7 mm 3.375”
73.7 mm / 2.9”
Figure 2: Mounting Holes (PC-104 standard)
Electrical and Optical Connections
SmartScan SBI has 4 FC/APC optical connectors. Observe the recommended connector cleaning
practice described in Appendix D. Connectors should only be fastened finger tight, take care to
correctly align the key-way when mating the connectors.
Figure 3 –SmartScan SBI and Processing Module Connections
The SBI has a two way screw terminal for connecting 9-32 VDC power. The Positive terminal is closest to
the board corner. The SBI generates all it's required voltages from this input and also outputs 5V on pins B3
and B29 of the PC104 bus connector for powering connected devices such as the processing Module.
Heat Sinking
The SBI's laser is mounted on a heat sink block, this should be fastened to a metallic structure that can
dissipate heat, such as an enclosure body or chassis. The heat sink block has 3 off M2 x 4 mm threaded
holes on a 10 mm pitch for this purpose. The laser case temperature (which can be reported by software)
should be kept below 75 °C under all operating conditions so as not to degrade laser performance.
If the SBI is used 'open frame' at room temperature then the heat sink block alone should be sufficient.
DC Power
Ethernet
Serial
Optical x 4

Page 8
Hardware Configuration
Jumpers
The SBI is delivered with jumpers on J13 and J16 which should not be removed.
DIP switch
The SBI has a 4-way DIP switch which controls the interrupt request line and board ID. SW1 and SW2
should be set to IRQ5. SW3 and SW4 should be set to 0 for a single board system. For a multi LASER system
the SBI with the lowest frequency LASER (the L band LASER) should be set to board ID 0. All other boards
should be set to another unique ID number.
Function
SW1
SW2
Description
IRQ5
OFF
ON
SBI sends interrupts on PC104 bus IRQ5
IRQ6
ON
OFF
SBI sends interrupts on PC104 bus IRQ6
Function
SW3
SW4
ID0
OFF
OFF
ID1
OFF
ON
ID2
ON
OFF
ID3
ON
ON
Developer Files
For the Processing Module the developer can download the following development files from
add CpanelURL:
•libssi.a –static link library
•libssi.so –dynamic link library
•libssi.h –development header
•libssi.pdf –library documentation
•minimal-dev-snapshot-20131024-x86_64-linux-armv4t-linux-gnueabi-toolchain-smartscan.tar.bz2 –
cross-compiler tool-chain for x86-64 PC running 64bit linux OS.
Processing Module
The TS7200 SBC comes pre-loaded with a Linux 2.6.36 kernel and root file-system. It is also preloaded with
the libssi dynamic link library and a kernel driver module for the SBI which is automatically loaded on boot
up.
Log in to the SBC using either a serial console (with 115200,8,N,1 port settings) or using SSH. In both cases
the user name is root with no password. The SBC is configured with an IP address of 10.0.0.150.
The example program from the library documentation is pre-loaded on the SBC's FLASH file-system at
/home/root/sbi. The example program continuously prints the wavelengths of the first 4 gratings of all
channels to the console at 25Hz.
The standard Smart Fibres application is loaded at /usr/bin/smartscansbid. The application is started
automatically by means of an init script at /etc/init.d/smartscansbi.sh. In order to run the example
application or a custom developed application the user must first prevent the standard application from
starting by removing it from the default run-level using the update-rc.d system tool. Alternatively, the init
script looks for a file named /home/root/sbi/inhibit and only starts the smartscansbid application if the file
does not exist. Create the file to temporarily disable application start up.

Page 9
SmartSoft for SmartScan Software Installation
The SmartScan SBI + PM can be configured and controlled using SmartSoft application software. This
software also allows data to be acquired from the interrogator. SmartSoft can be downloaded from the
web, see Appendix A.
An instruction manual for the installation and operation of SmartSoft is provided at Appendix A.
Switching on the Interrogator
Once the equipment has been connected as shown in Figure 2 and SmartSoft has been installed on the
host PC, the Interrogator is ready to be switched on by applying the DC input voltage.
The SmartSoft PC application should now be used to configure and acquire data from the interrogator.
Switching off the Interrogator
The interrogator may be switched off by disconnecting the DC input voltage.
Maintenance
The SmartScan SBI contains no user serviceable parts. Many reported issues are as a result of poor optical
connector cleanliness. You are recommended to refer to Appendix D, where best practices for optical
connector cleaning are provided.
In the event that you are having problems with your instrument, please contact your local representative
or Smart Fibres technical support at +44 1344 484111 or info@smartfibres.com. In the event that technical
support are unable to resolve your issues remotely, you will be given a Return Material Authorisation
(RMA) number under which you can return the instrument for maintenance or repair.
Page 10
Appendix A - SmartSoft for SmartScan SBI User Manual
Installation
SmartSoft can be downloaded from the URL:
http://download.smartfibres.com/SmartSoft-for-SmartScan-SBI.zip and installed on a host PC. The host PC
must run a suitable Operating System, this manual covers installation on a PC running most Windows
operating systems.
After downloading, extract the zip files to a suitable location on the PC. To install the software, run
“setup.exe” and follow the instructions that appear during the install process. The installer will place a
shortcut in the Windows Start Menu under the Smart Fibres program group and on the Desktop.
If not already installed on the host PC, the National Instruments’ LabVIEWTM Run Time Engine (RTE) must
be downloaded and installed. At the time of writing, the RTE is available at www.ni.com/en-
us/support/downloads/software-products/download.labview.html#305508. Make the following selections
on the download page: Supported OS = Windows, Version = 2015, Bitness = 32-bit, Editions = Runtime
Preparing For Use
After installing SmartSoft, connect the supplied Ethernet cross-over cable between the host PC and
SmartScan. The PC’s network connection must be configured to a suitable subnet; by default SmartScan’s
IP address is 10.0.0.150 and its Net mask is 255.255.255.0. The Net mask for the PC must also be set to
255.255.255.0, suitable ranges for the PC’s IP address are 10.0.0.1 to 10.0.0.149 or to 10.0.0.151 to
10.0.0.250. (see Appendix B for further details or contact your network administrator for assistance).
SmartScan can also be connected to a network instead of a direct connection to a host PC. Further details
are given in Appendix B and on the Instrument Setup –Network Tab.
Connect power to the DC input of SmartScan, the DC supply must be in the range +9 to +32V and capable
of supplying 15W of power.
SmartScan is now ready to be powered. Switch on the supply and observe the lights on the Ethernet RJ45
connector, indicate the presence of supply voltage it will take 30 seconds or so for the interrogator to
complet its boot up sequence. FBG sensors can be connected to the SmartScan at any time.
On the host PC Navigate to the Smart Fibres > SmartSoft short-cut on the Windows Start Menu and start
the program. Note that the first time SmartSoft is run a message from the PC’s firewall may be displayed
requesting permission to allow SmartSoft through the firewall, it is important to check the tick boxes for all
domains that appear.
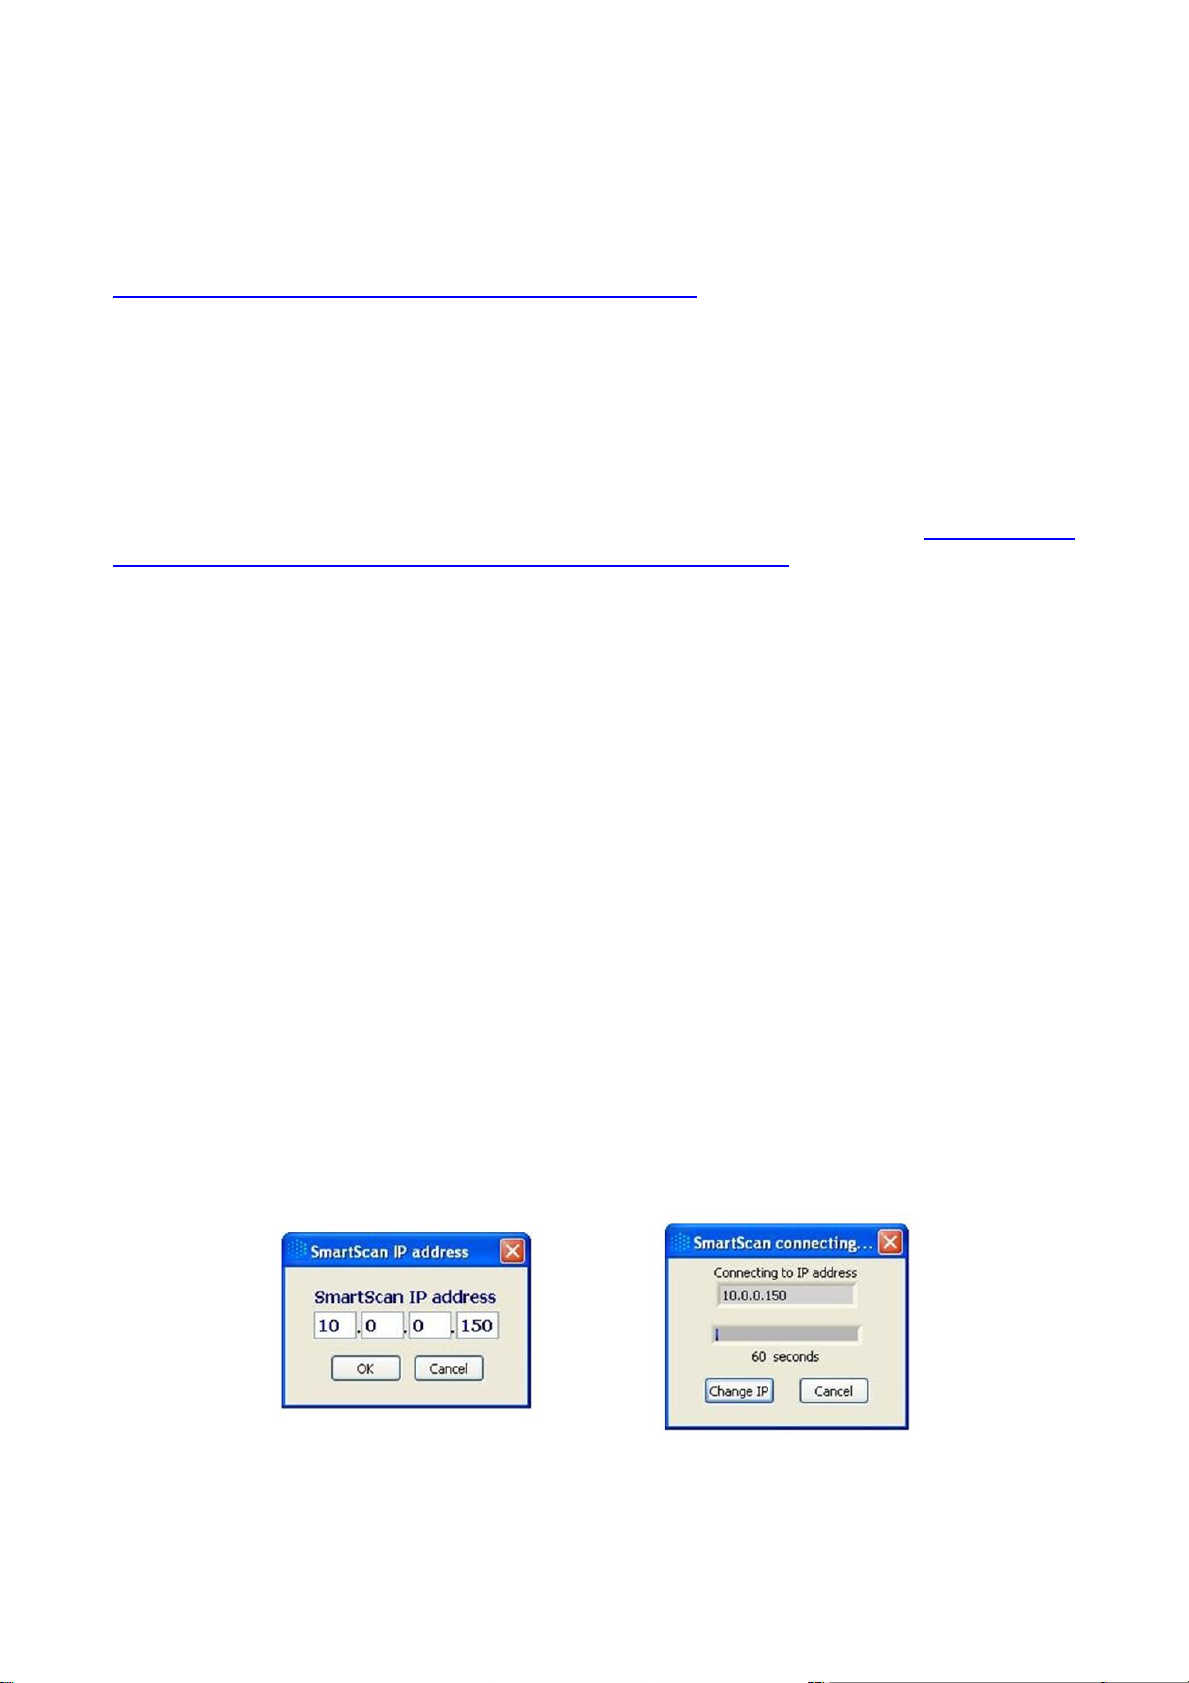
Figure 4 - Connecting SmartScan to Network
The program requests the IP address of the SmartScan. As shipped from the factory this will be 10.0.0.150.
An Ethernet connection is attempted and the dialogue box changes to indicate progress. If a connection

Page 11
can be made successfully the dialogue box will close after a few seconds and the SmartSoft main screen
appears.
Figure 5 - SmartSoft for SmartScan Main Screen
A number of function buttons are shown top right. Inactive functions are greyed out.
Basic Acquisition is recommended for first time users and is designed to enable basic measurements to be
taken with simplified settings. Wavelength measurements are reported for all detected sensors at the rate
determined by the instrument's stored settings.
Enhanced Acquisition is recommended for advanced users and is rich in features but requires more
detailed settings. Attempting to use enhanced mode without first reading this manual is not
recommended.
Instrument Set-up is used to set the acquisition rate of the instrument as well as other advanced features
such as per-grating auto-gain and peak detection thresholds.
Plug-ins allows the user to run custom LabVIEW source code modules. Contact Smart Fibres technical
support for details.
Quit is used to close the entire application. Always use the Quit button to exit the SmartSoft application;
using other methods to close the application may cause unexpected behaviour.
Page 12
Basic Acquisition
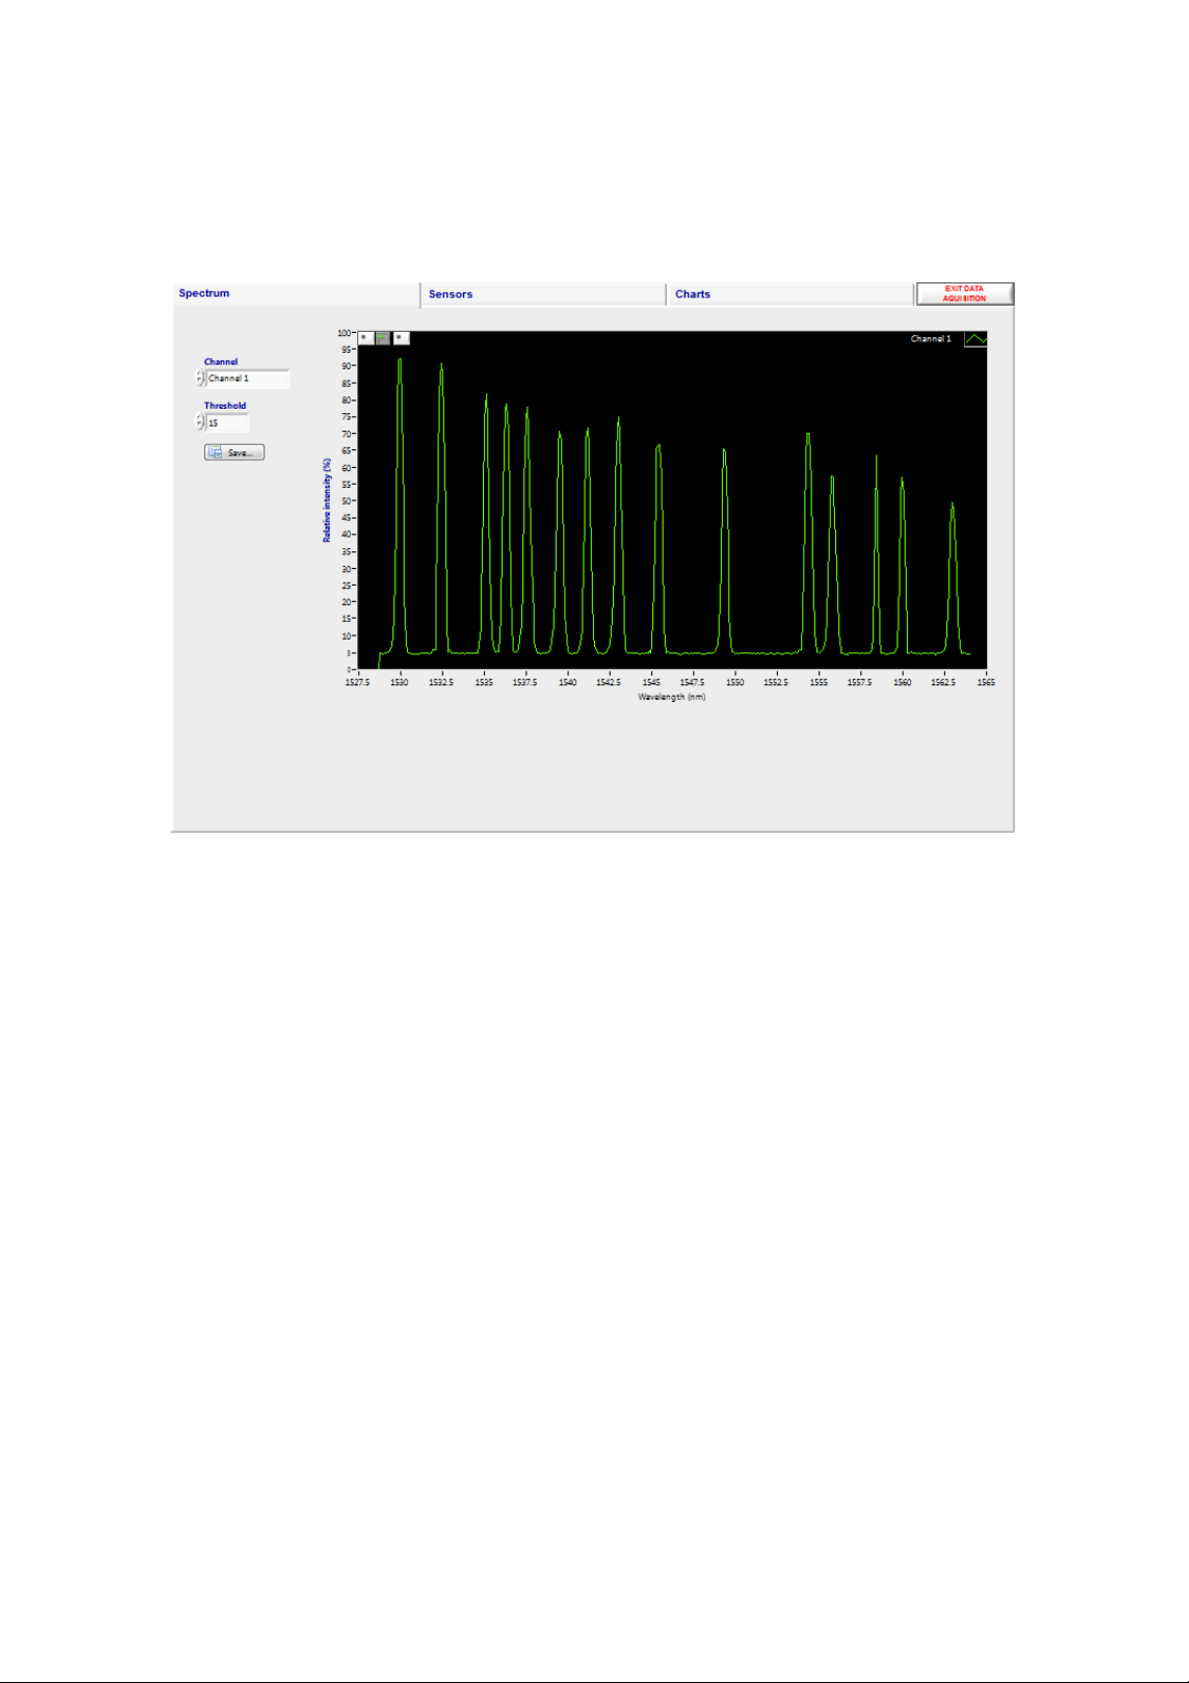
Press the Basic Acquisition Button and then select the Spectrum Tab.
Basic acquisition –spectrum tab
Figure 6 - Basic acquisition –Spectrum tab
The spectrum tab is intended as a tool to aid setting up of sensors and/or SmartScan parameters. The
sensors on one channel at a time can be viewed with the reflected signal intensity displayed over the
wavelength range. Each peak represents the reflected light from one FBG. In basic Acquisition mode the
gain is applied on a per channel basis. Automatic gain control ensures that the largest signal is not
saturated.
If there are large differences in the signal intensity of FBGs on the same channel then per-FBG gain can be
used with the enhanced acquisition panel, see the Instrument Set Up section for more details. Step through
all the channels that have FBGs connected and ensure that the background noise is below 10% and that the
FBG signal peaks are above 25%.
If desired, the instantaneous spectrum can be saved to file, press the save button whilst the channel of
interest is being viewed. A file of 400 points is generated, with relative intensity of reflection vs wavelength
at 100 pm intervals.
Next move to the Sensors tab.

Page 13
Basic acquisition –sensors tab
Figure 7 - Basic acquisition –Spectrum tab
All FBG locations are shown in the table on the left of the screen. The number of FBGs per channel can be
programmed using Instrument Set Up.
The SmartScan calculates the centre wavelength of each FBG peak and these are displayed in the table.
The user may record the table wavelengths to a log file. First set the target location and name of the log file
by typing it in the box, or by clicking the folder icon. Then set the duration of the logging period (log time)
and then press the log button. The button lights up and the elapsed time is indicated by a progress bar and
a numeric indicator. The recording will automatically stop when the Log time is reached or the user may
stop the recording by pressing the Log button again.
A log file can be scheduled to take place at regular intervals. The file name will be appended with a
date/time string of the format “YYYYMMDD-HHMM_” where YYYY is the year, MM is the month, DD is the
day, HH is the hour of day and MM is the minutes in the hour. The scheduled log button will only be
enabled when a valid log file name is selected and a log time shorter than the logging period is chosen.
A logging session can be split over many files in order to avoid large log files if logging for long periods at
high rates. The number of lines per log file and the time/date format to append or prepend to the file-
name may be set by clicking the icon next to the “Log FBGs” heading. If both prefix and postfix strings are
empty the log file name will be exactly as selected in the log file control, unless the selected log time would
exceed the selected number of lines per log file. In which case the log file name will be prepended with the
default time-stamp format of %Y%m%d-%H%M%S_. To cancel Log file rotation set the number of lines to 0.
Now move on to the Charts tab.

Page 14
Basic Acquisition –Charts Tab
Figure 8 - Basic acquisition –Charts tab
Two wavelength graphs are displayed simultaneously and any of the available FBGs (16 per channel) can be
selected for display. FBGs can be added to the left or right y-axes and each one is assigned a colour-coded
trace.
To increase the displayed graph area one or both of the y-axes can be hidden by pressing the appropriate <
or > button. Similarly the lower graph can be hidden using the “V” button between the two graphs,
allowing the upper graph to extend to fill the screen.
The Y axes of the graphs are set to auto-scale. If required, they can be locked by right clicking on the
desired scale axis and de-selecting “AutoScale Y”. The upper and lower limits of the locked axis can then be
selected and adjusted.
Page 15
Instrument Set-Up
Instrument Set Up is used to enable Enhanced Acquisition and allows the powerful features of SmartScan
and SmartSoft to be utilised fully.
A number of set up tabs are available, they will be described from left to right.
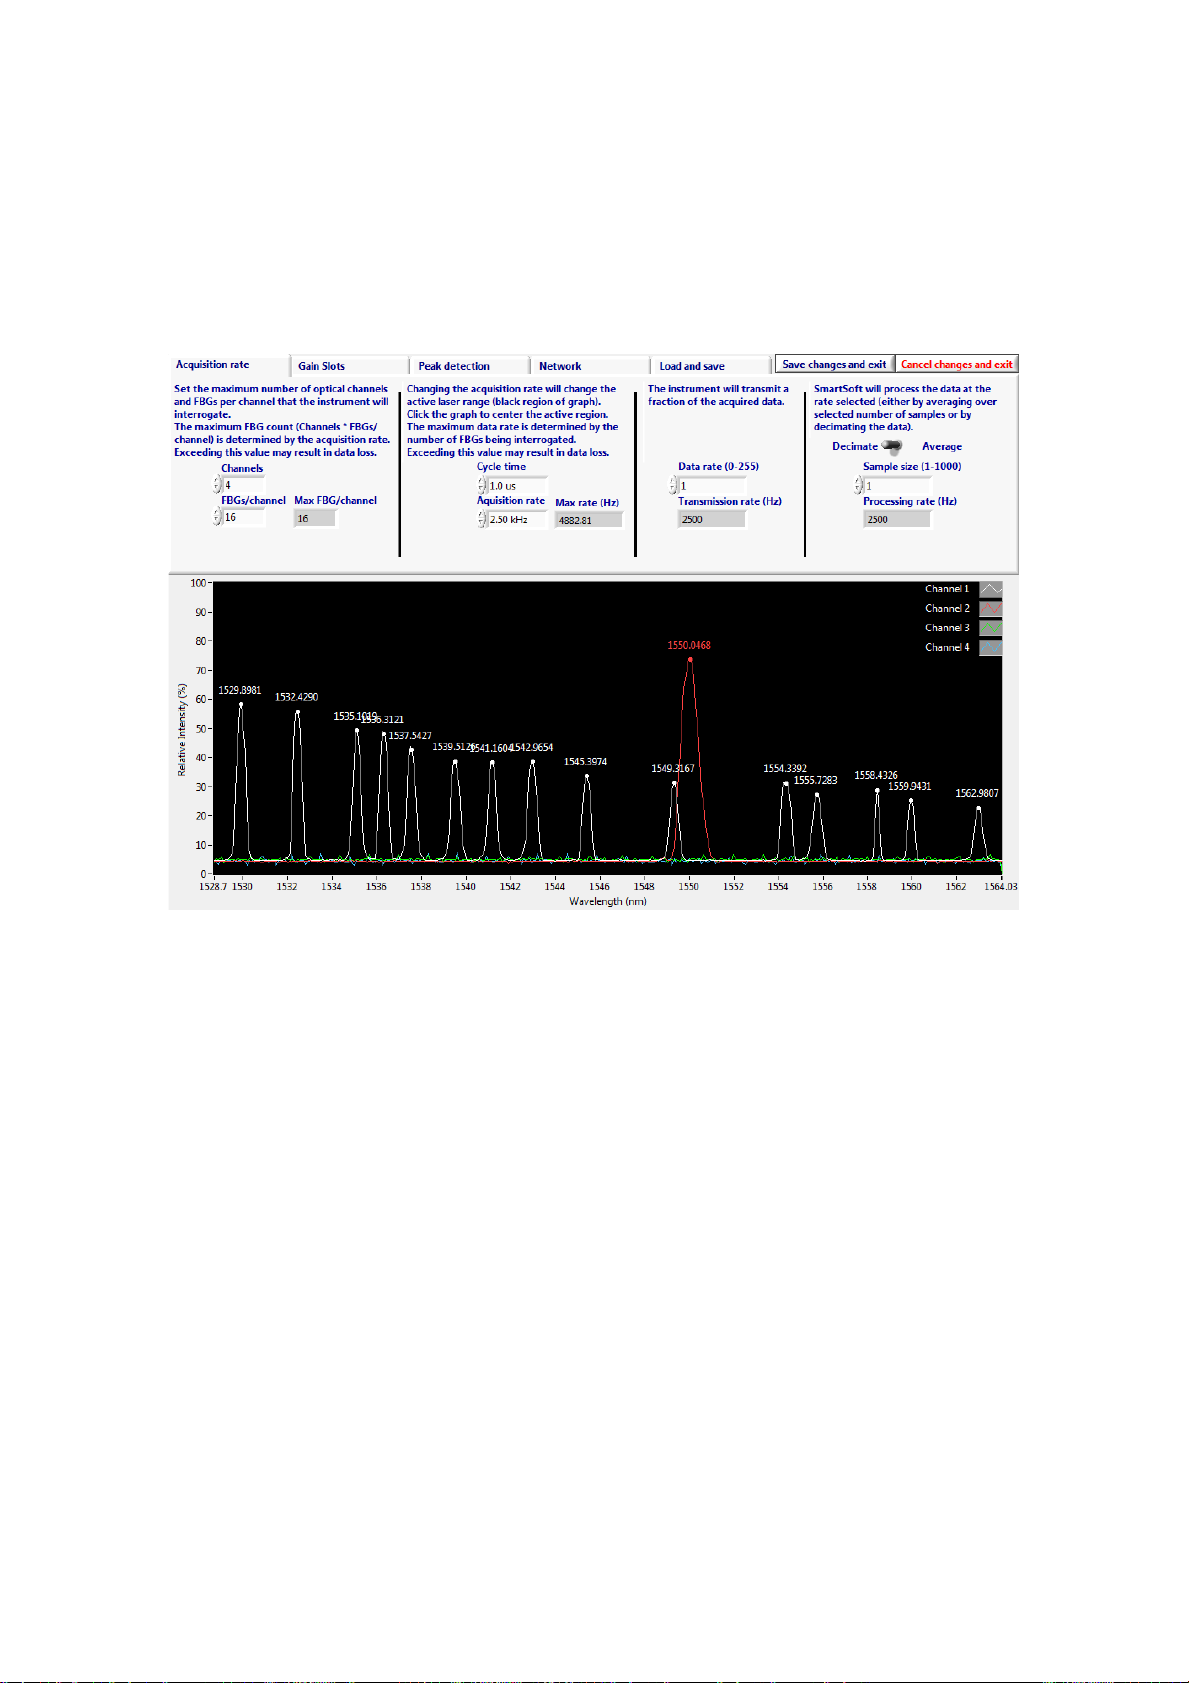
Instrument Set-Up - Acquisition Rate Tab
Figure 9 –Instrument setup - Acquisition rate tab
Here the user can adjust various parameters that affect the acquisition rate of the SmartScan and the data
processing rate of the SmartSoft software.
The lower half of the screen shows spectra from all operational channels, together with the current
wavelengths of any detected FBG peaks.
Starting on the left the user may configure the number of active optical channels. The limit depends on the
maximum number of optical channels the instrument supports.
The user may configure the number of FBGs per channel. Reducing the number of FBGs per channel
enables the faster acquisition rates in the drop down menu to be used.
The SmartScan cycle time in microseconds (s) can be adjusted. The cycle time is defined as the time to
complete one laser tuning step and measure the light received by the detector circuits. This can speed up
or slow down the overall acquisition time. The minimum cycle time is 1 s.
The SmartScan’s acquisition rate is a function of cycle time and wavelength range. The acquisition rate can
be adjusted by choosing a value from the selection box. This trades the instruments wavelength range for
acquisition speed, e.g. 2.5 kHz over 40 nm, 5 kHz over 20 nm, 25 kHz over 4 nm. For some rates it may be
necessary to reduce the number of FBGs per channel as described above.

Page 16
Figure 10- Instrument setup - Acquisition rate selection
The active laser range will be reduced according to the selected acquisition rate. The inactive range will be
greyed out in the graph. Left click on the graph with the mouse to centre the active region in the desired
location. Select the lowest acquisition rate in the list to reset the active region to its full range.
Consideration should be given to the expected wavelength excursions of each FBG peak to ensure that they
will not move outside the laser tuning range.
The rate at which data are transmitted to the host PC can be reduced by sampling the data. Setting the
Data Rate to 1 means that the SmartScan will transmit all available data to the PC and the transmission rate
will be equal to the acquisition rate. Setting the Data Rate to a number N greater than 1 will result in data
from every Nth scan being transmitted. It may be desirable to slow down the transmission rate because, for
example the data are transmitted over a slow network connection or because the host PC cannot process
the data packets fast enough.
Finally, the user may further reduce the amount of data stored in a log file by applying averaging or
decimating the data. This is applied by the SmartSoft application so will not reduce the Ethernet traffic but
will reduce the data presented by SmartSoft and optionally saved to file. The extent of data reduction is
controlled by the Sample size box. Setting this to a number N will result in every Nth transmitted data point
being presented or stored, either by averaging N points together or by keeping every Nth point and
discarding the rest. Averaging N data points together will also improve the signal to noise ratio by up to a
factor of √N.
The data processing rate is displayed at the top of the screen when acquisition is in progress. The
acquisition and transmission rates are shown as a tool tip when hovering the mouse over the data
processing rate indicator.

Page 17
Instrument Setup - Gain Slots Tab
Figure 11 - Instrument setup - Gain slots tab
An advantage of Enhanced Acquisition is that it enables the use of Wavelength Gain slots, whereby each
FBG operates within its own wavelength window that is assigned its own set of properties. Each slot can
use a different gain level so large variations in signal intensity can be accommodated on one channel
without loss of measurement resolution.
The Gain slots are set up on a channel-by-channel basis. The spectrum for the Channel in question is
displayed. The wavelength limits on the graph's x-axis have already been determined according to the laser
tuning range that was set up on the Acquisition Rate tab. The user then clicks between the spectral peaks
to add slot boundaries. Only one FBG peak should be present in each slot. The start and end points of the
wavelength tuning range are slot boundaries, so be sure not to add slot boundaries before the first FBG or
after the last FBG. Care should be taken that during operation the FBG peak will not cross a slot boundary
and that FBG peaks remain separated by at least 1.6 nm from each other and 0.8 nm from the end of the
active laser range. Do not set up more slots than the number of sensors per channel that was configured
on the Acquisition Rate tab. Slot boundaries can be adjusted by dragging them to their desired position
using the mouse. Right click on a boundary to delete it.
Once the slots are established the Gain Mode can be set. There are two modes, in auto mode the gain for
each slot adjusts automatically so that the intensity of each FBG peak is maximised but does not saturate.
The peak intensity will be maintained between 50 and 100% and will only reduce below 50% on the highest
gain level if the signal is still too small.
In Manual gain mode a fixed gain is applied to each slot. To set the gain, right click on the graph between
the slot boundaries and set the gain level between 0 and 8, repeating this process for each slot on all
channels. The optimum gain level is above 50% but without saturating; a saturated FBG peak will have a
flat top at around 100% intensity. The gain applied to each slot is displayed on the graph. Selecting a
manual gain for a slot will automatically change the gain setting from auto to manual. It is recommended
that in manual mode the gain be set as high as possible without risk of the FBG peak saturating. Peaks
below 25% relative intensity may suffer reduced measurement performance.
Page 18
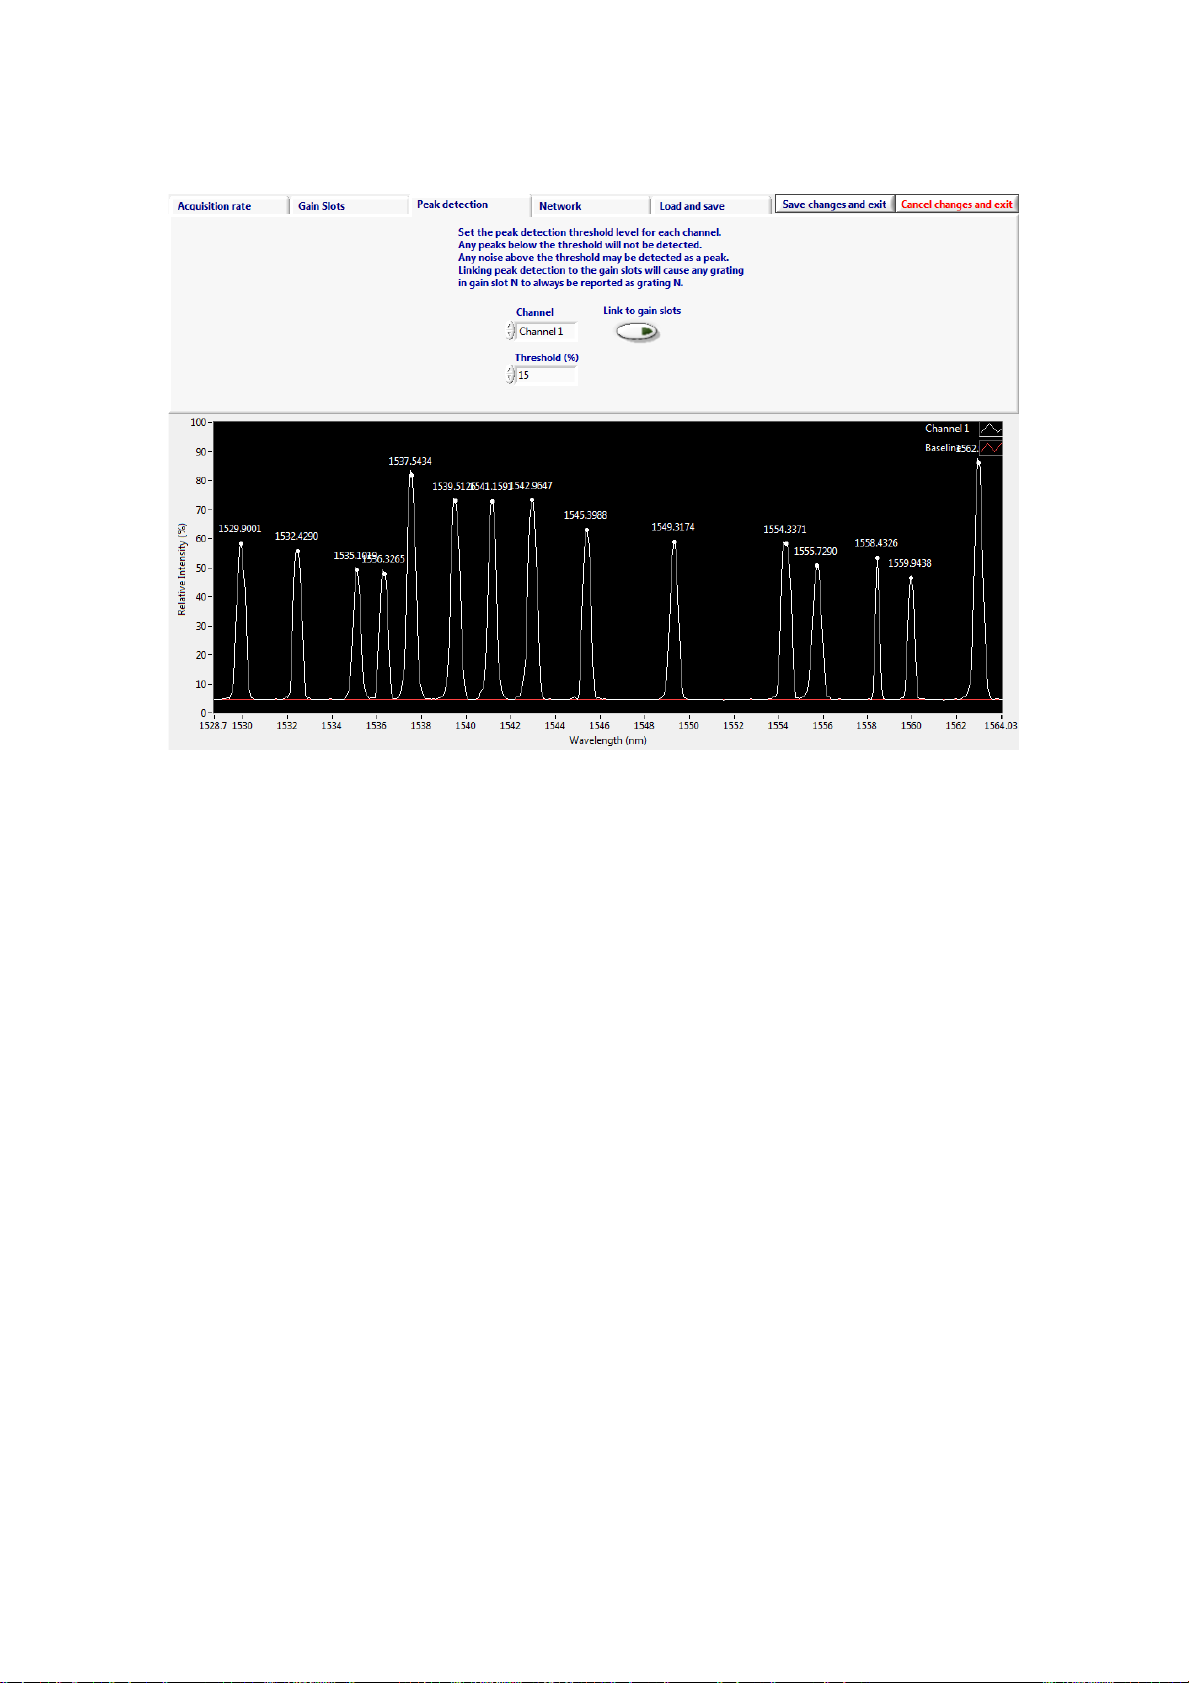
Instrument Setup - Peak Detection Tab
Figure 12 - Instrument setup - Peak detection tab
SmartScan performs a baseline calibration of the photo-detectors during power up. This compensates for
any back-reflection in the fibres. The calibrated baseline value is shown as a red trace on the graph. If the
fibres are changed or disturbed and the baseline changes, calibration can be performed by either power-
cycling the instrument or pressing the “Calibrate baseline” button.
The peak detection threshold may be adjusted for each channel on this tab. Ensure the threshold level is
above the background reflection level but not above any true FBG peaks. In most cases a value of around
15% is optimal. The threshold is relative to the signal baseline, the red trace on the graph, not zero relative
intensity.
The location of detected peaks can be linked to the auto-gain slots by selecting the ‘link to gain slots
button’. This way, a peak at wavelength X will always be reported as grating N, where N is the slot number
containing wavelength X. This feature avoids the software becoming confused if, for instance, one FBG
within an array drops below its threshold.

Page 19
Instrument Setup –Network Tab
Figure 13 - Instrument Setup –Network Tab
On the Network tab the user can change the IP settings of the SmartScan. This is usually only necessary
when a SmartScan is to be used on a Local Area Network. Be aware that the IP settings of the host PC may
need to change in order to maintain connectivity.
If you are connecting the SmartScan to a network instead of a direct connection to a host PC, make sure to
set the gateway address to match the network router or gateway PC's LAN address and that the
SmartScan's IP address is unique on the network and not in the pool of addresses assigned to any DHCP
servers on the network.
If there is a firewall or NAT router between the SmartScan and the host PC you may need to open TCP port
80 and UDP ports 30001 to 30003, 30070 to 30072 and 30075 to allow SmartSoft to communicate with the
interrogator.
See Preparing for Use section and Appendix B for further details and if necessary consult your Network
Administrator.

Page 20
Instrument Setup - Load and Save Tab
Figure 14 - Instrument Setup - Load and Save Tab
The user can use this tab to save all the Instrument Setup parameters to a file. The file can be recalled later
using the Load button. This is particularly useful when SmartScan is used to interrogate multiple sensor
systems, as a configuration for each system can be saved.
Instrument Setup - Exiting Instrument Set-Up
There are three options for exiting Instrument Set Up, pressing “Save changes and exit” will transfer all
parameters to SmartScan and the instrument is ready to begin an Acquisition session. Alternatively,
pressing “Cancel changes and Exit” will discard any changes and SmartScan will revert to its previous
configuration. You can also just select a new panel from the main controls, if any settings have been
changed SmartSoft will ask if you want to save them.
Table of contents
Popular Industrial Equipment manuals by other brands
 instruction manual")


ComCo Systems
ComCo Systems 522A Series Installation and operator's manual

Charnwood
Charnwood PT250 owner's manual

R.V.R. Elettronica
R.V.R. Elettronica TLC300 user manual

SCHUNK
SCHUNK MPG Series Assembly and operating manual

SEW-Eurodrive
SEW-Eurodrive MOVIMOT MM D Series manual

Newgrind
Newgrind RHINO RM350 Operator's manual