Solar-Log 200 User manual

�
Solar-Log

Contents
2 of 104 Solar-Log200User Manual
Contents
1General information 5
2Operation using the web browser in your own network 6
2.1 Requirements 6
2.2 Overview 7
2.2.1 Navigation overview 7
2.2.2 Homepage 8
2.3 Calling up yield data 9
2.3.1 How to navigate within the overviews 9
2.3.2 What the values in the overviews mean 10
2.3.3 Day overview 11
2.3.4 Month overview 13
2.3.5 Year overview 14
2.3.6 Total overview 15
2.4 Calling up yield data on a mobile computer 17
2.4.1 Day 18
2.4.2 Month 18
2.4.3 Year 19
2.5 Calling up the diagnosis function 20
2.5.1 Calling up and filtering the event log 21
2.5.2 Displaying the decrease in output for your plant 23
2.5.3 Pac Correction Factor 25
2.5.4 Calculating the PAC correction factor 25
2.5.5 Example calculation 26
2.6 Changing settings in the configuration menu 27
3Using Solar-Log WEB 28
3.1 Register with Solar-Log™ WEB "Classic 2nd Edition" 28
3.2 Calling up plant data 31
3.3 Calling up yield data 35
3.3.1 How to navigate within the overviews 35
3.3.2 What the values in the overviews mean 35
3.3.3 Day overview 35
3.3.4 Month overview 37
3.3.5 Year overview 38

Contents
Solar-Log200 User Manual 3 of 104
3.3.6 Overview of all years 40
3.3.7 Calling up and filtering the event log 41
4E-mail Notification 43
4.1 Yield E-mail 43
4.2 Performance Monitoring 47
5Using the Solar-Log™ APP iPhone V3 for iPhones 53
5.1 Installing the App 54
5.2 Add plants 55
5.3 Retrieving Yield Data 56
5.3.1 How to navigate between different time periods 57
5.4 The top menu bar 58
5.5 The bottom menu bar 60
5.5.1 Day 60
5.5.2 Monthly Overview 61
5.5.3 Annual Overview 62
5.5.4 Total Overview 63
5.6 Viewing CO2Savings 64
5.7 Retrieving Plant Data 65
5.8 The Yield Data as a Slide Show 67
5.8.1 Start the Slide Show 69
6Using the Solar-Log™ Android App 70
6.1 Installing the App 70
6.2 Add plants 71
6.3 Plant Settings 73
6.3.1 S0 meter 73
6.3.2 Management 74
6.4 The Toolbar 75
6.5 Retrieving Yield Values 77
6.5.1 Daily Overview 78
6.5.2 Monthly Overview 79
6.5.3 Annual Overview 80
6.5.4 Total Overview 81

Contents
4 of 104 Solar-Log200User Manual
6.6 Viewing CO2Savings 81
6.7 App Settings 82
6.7.1 Periodical data update 84
6.7.2 Reset 85
6.7.3 Slide show 86
6.7.4 Legal Disclaimer 87
6.8 The Yield Data as a Slide Show 88
6.9 Using the Android App with a Smartphone 89
6.9.1 Smartphone vertical format 90
6.9.2 Smartphone - horizontal format 91
6.9.3 Solar-Log™ Widget for Smartphones 92
7Cleaning and care 94
7.1 Cleaning tips 94
7.2 Care tips 94
8Malfunctions 95
8.1 Status display for the LEDs 95
8.2 Remedying faults yourself 96
8.2.1 Obtaining information from the internet 98
8.2.2 Informing a specialist technician 98
9Disposal 99
10 Technical data 100
Glossary 101
103
104

General information
Solar-Log200 User Manual 5 of 104
1 General information
This user manual is intended to assist you in the operation of the Solar-
Log200. The yield data for the Solar-Log200 can be displayed in several
ways:
via a web browser in a local network (page 6) or
via the internet (page 28) or
via the Solar-Log™ APP for iPhone (page 53).

Operation using the web browser in your own network
6 of 104 Solar-Log200User Manual
2 Operation using the web browser in your own
network
2.1 Requirements
Information
For faster access, enter "solar-log" in the address line of the
browser and create a bookmark.
In the local network
To operate the Solar-Log200 using a web browser you will need to be on
a computer that is connected to the same local network as the Solar-
Log200 . This computer will also need to have a modern web browser
installed on it.
You are also able to operate the Solar-Log200 on a mobile device such
as a tablet, smartphone. This device must also be connected to the
same local network as the Solar-Log200. It must also have a modern web
browser installed on it.
Via the internet
In addition to the computer or mobile computer with a web browser you
need an active internet connection as well as a user account on a
server.
To set up a user account please contact your solar technician or find
out more on our homepage under
http://www.solar-log.com/en/products-solutions/solar-log-web.html

Operation using the web browser in your own network
Solar-Log200 User Manual 7 of 104
2.2 Overview
2.2.1 Navigation overview
Ertragsdaten
Diagnose
Konfiguration
Visualisierung
PC
Tagesübersicht
Monatsübersicht
Jahresübersicht
Gesamt–
übersicht
PDA/Pocket PC
Ereignisprotokoll
Degradation
Tag
Monat
Jahr
Yield data
Diagnosis
Configuration
Visualisation on PC
PDA/pocket PC
Event log
Degradation
Day overview
Month overview
Year overview
Total overview
Day
Month
Year

Operation using the web browser in your own network
8 of 104 Solar-Log200User Manual
2.2.2 Homepage
The homepage contains the following areas:
Main navigation menu (A)
Navigation bar (B)
Information field (C)
Main navigation menu
The main navigation menu contains three main operating groups:
Yield data: Here you will find the yield information within certain
periods of time such as day, month, year and the total yield to date
of your plant.
A
C
B

Operation using the web browser in your own network
Solar-Log200 User Manual 9 of 104
Diagnosis: Here you can call up the fault and process reports as
well as filter according to desired criteria.
Configuration: Here you can change the settings of your device as
required.
Left navigation bar
Depending on the selected field in the main navigation menu you can
access additional functions in the left navigation bar.
Information field
Device configuration will take place in this area. When viewing yield
information an additional window will pop up and yield information can
be found there.
2.3 Calling up yield data
1 Start the web browser and enter "solar-log" in the address line of the
browser or select the bookmark in the browser's navigation bar.
The homepage is displayed.
2 Select Visualization PC in the left navigation bar.
The output details for the current day are displayed in a new
window.
2.3.1 How to navigate within the overviews
Symbol
Meaning
Arrow keys: used to navigate to the previous
or next period of time shown. Magnifying
glass symbol: used to update the modified
parameters.

Operation using the web browser in your own network
10 of 104 Solar-Log200User Manual
Symbol
Meaning
Information on the inverter that is connected.
Hold the cursor over a field to display the
specific values.
Display of additional information on the plant
(page 10).
1 Click inside the colored area of the connected inverter or the desired
yield values.
2 Click on the magnifying glass symbol.
The overview is updated and the yield information for the inverter
or the yield values is shown in the selected overview, as a line.
3 Move to the next overview by clicking on the information under the
heading.
4 Close the yield data window.
This allows you to return to the main menu.
2.3.2 What the values in the overviews mean
Description
Unit
Meaning
Power input
Pac
W
The current power input P on the AC
voltage side
Generator output Pdc
W
The current power input P on the DC
voltage side (solar generator)
Inverter efficiency η
%
The current efficiency from the
generator output and the power input.
The manufacturer's specifications
regarding the efficiency of the inverter
can be checked here.

Operation using the web browser in your own network
Solar-Log200 User Manual 11 of 104
Description
Unit
Meaning
Status / Error
Status and error codes for the inverter.
The codes shown are dependent on
the manufacturer and must be looked
up in the manual for the respective
inverter. Status messages that are the
same are collated.
Yield
kWh
The yield for the period of time shown
(day, month, year, total)
Yield, specific
kWh/kWp
The output divided by the plant size.
This value is a good reference value
with respect to other plants.
Maximum value
W
The maximum output value within the
period of time shown.
Target
kWh
The device runs a forecasting statistics
function that specifies a certain target
value for each time period. If the target
value is attained or exceeded the
forecast output has been achieved.
Actual
%
The actual value shows the percentage
share for the actual yield and the target
yield.
2.3.3 Day overview
Select Overview Daily in the left navigation bar.

Operation using the web browser in your own network
12 of 104 Solar-Log200User Manual
The daily yields are shown in a curve chart. The red line shows the
target value for each day.
Buttons for the day overview
Yield: Yield line via which the yield trend can take place. In addition,
a red line is displayed as the total daily target.
Udc: Generator voltage. To display voltage of the individual strings
only one inverter may be selected.
kWp: Converting the scaling from "Output in watts" to "Output in
kWh/kWp". This makes all of the curves comparable in terms of their
specific output. This also makes it easier to identify decreased
outputs from specific inverters/strings.
°C / °F : Display showing the inverter's internal temperature. This
allows you to check that the fans are functioning correctly. Please
note that inverters are designed to have high internal
temperatures.
The temperature display is shown only for inverters that provide the
corresponding measured value.

Operation using the web browser in your own network
Solar-Log200 User Manual 13 of 104
24h: Display showing the output over 24 hours of the day for a
complete visualisation of the power consumption over the course of
one day.
Additional functions using S0 meter reader
The following displays are also available to you by connecting an S0
meter to the Solar-Log™:
S0: Shows the power consumption for your building as a graph, in
watts.
Cons.: Shows the power consumption for your building as a rising
line, in kWh.
Values: Shows various values for your inverter in text form.
Balance: Shows you the ratio of your power consumption to your
power yield. In the lower left text field the ratio is also shown as a
percentage.
Additional functions with the sensor box
Solar: Shows the reference value of an irridation sensor. The daily
output of the plant must be within the measuring range of the sensor.
Mod T: Shows the module temperature. The temperature is detected
by the sensor box.
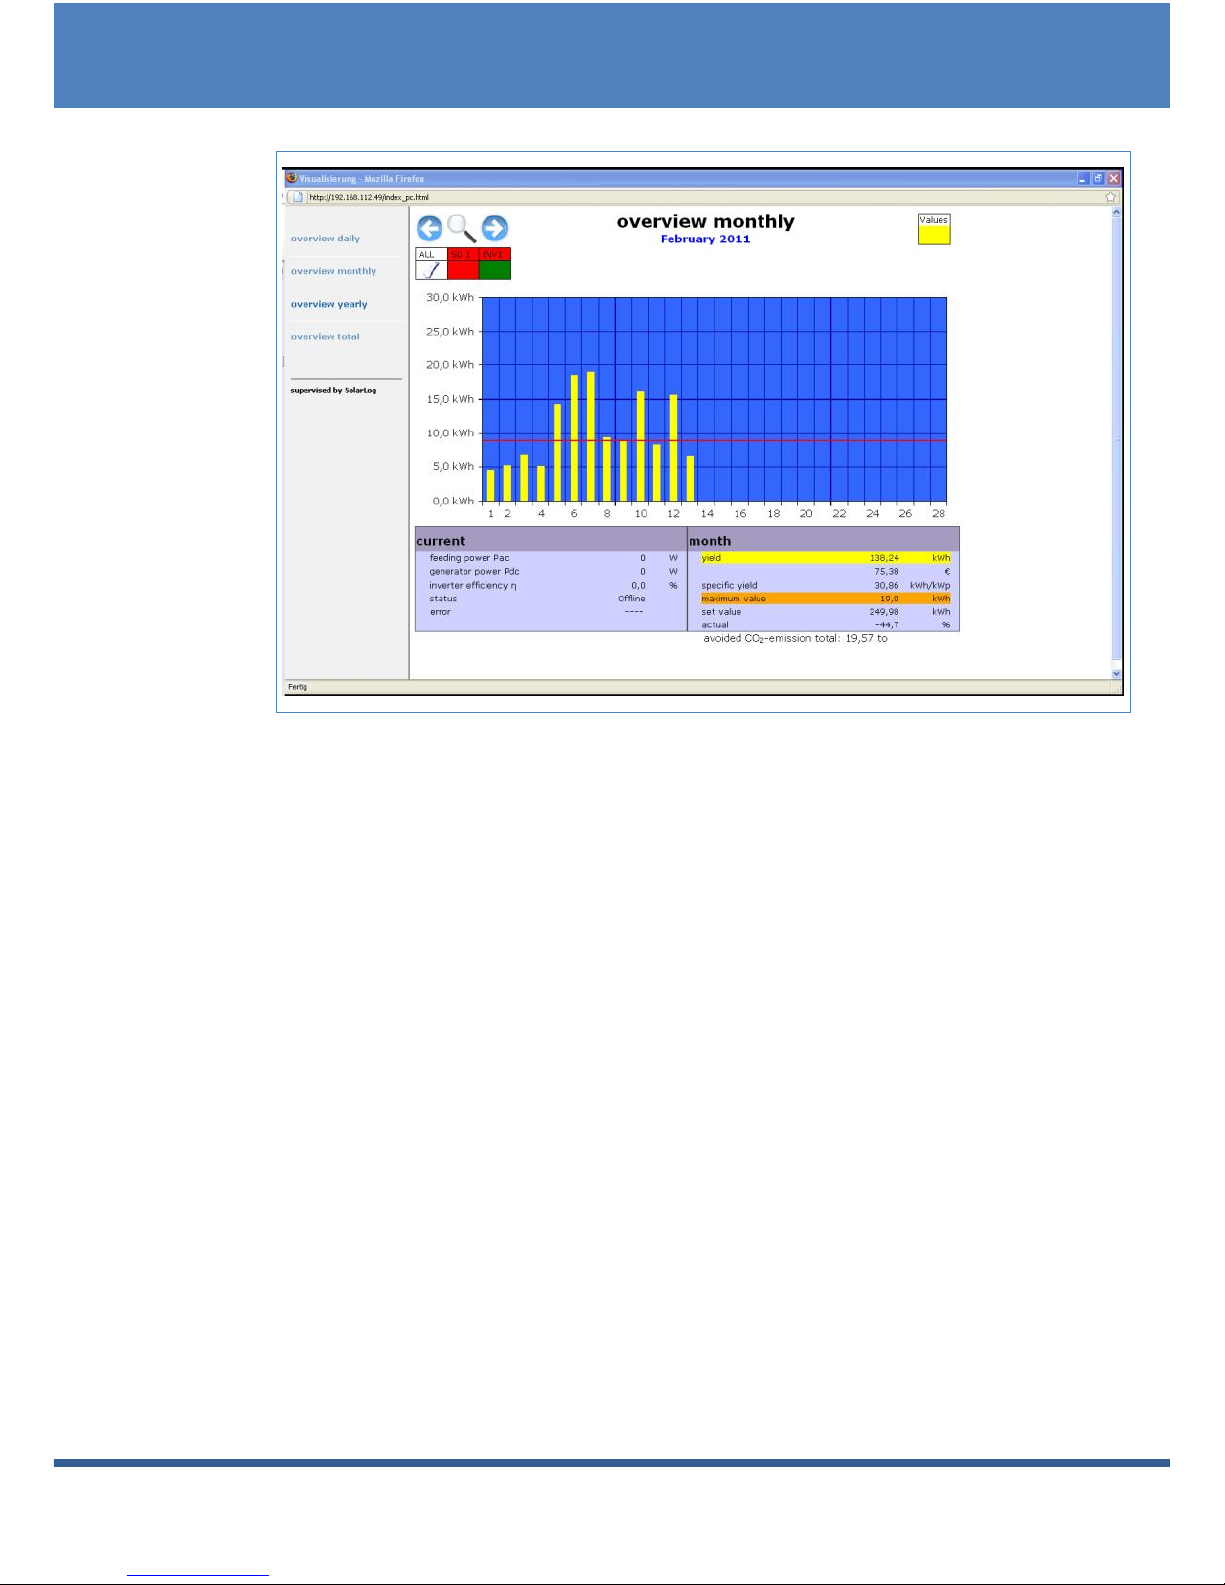
2.3.4 Month overview
Select Overview Monthly in the left navigation bar.
Operation using the web browser in your own network
14 of 104 Solar-Log200User Manual
The daily yields for one month are shown as a total in a bar graph. The
red line shows the target yield for each month.
1 Move the mouse over a day bar.
The corresponding day's yield is shown.
2 Click on an individual bar to switch to the corresponding day
overview.
2.3.5 Year overview
Select Overview Yearly in the left navigation bar.

Operation using the web browser in your own network
Solar-Log200 User Manual 15 of 104
The individual monthly yields are shown as a total in a bar graph. The
red line shows the target yield for each month.
The "Forecast" value is calculated using the yields already achieved for
the year and is then projected using the target yields for the remaining
months of the year.
1 Move the mouse over a month bar.
The corresponding month's yield is shown.
2 Click on an individual bar to switch to the corresponding month
overview.
2.3.6 Total overview
Select Overview Total in the left navigation bar.

Operation using the web browser in your own network
16 of 104 Solar-Log200User Manual
The individual annual yields are shown as a total in a bar graph. The red
line shows the total target yield. For the current year two red lines are
shown:
The top line shows the annual target.
The bottom line shows the annual target accumulated to the present
day.
1 Move the mouse over a year bar.
The corresponding year's yield is shown.
2 Click on an individual bar to switch to the corresponding year
overview.
3 Click on Line overview, years to display a line view for the total
yield.

Operation using the web browser in your own network
Solar-Log200 User Manual 17 of 104
4 Click on Chart overview, years to display a bar view for the total
yield.
2.4 Calling up yield data on a mobile computer
You can also call up the current yield data for your plant via mobile
computer (e.g. smart phone). To do this your smart phone logs onto the
internet or your local server and calls up your data.
Note
This function is only available in the local network or for plants
which run on our "Classic 1 Server".
Please note that additional costs for the internet connection
may be charged by your mobile service provider.

Operation using the web browser in your own network
18 of 104 Solar-Log200User Manual
1 Start the web browser on the mobile computer and enter "solar-log"
or the IP address for the Solar-LogTM in the address line of the
browser or select the bookmark in the browser's navigation bar.
The homepage is displayed.
2 Select PDA/Pocket PC in the left navigation bar.
2.4.1 Day
Select Day in the left navigation bar.
The updated yield data for the day is shown.
2.4.2 Month
Select Month in the left navigation bar.

Operation using the web browser in your own network
Solar-Log200 User Manual 19 of 104
The yield data for the current month is shown.
2.4.3 Year
Select Year in the left navigation bar.
The yield data for the previous year is shown.

Operation using the web browser in your own network
20 of 104 Solar-Log200User Manual
2.5 Calling up the diagnosis function
With the diagnosis function you are accessing the device's event log.
You can display a total overview of all of the errors, malfunctions and
status changes that have occurred for the connected inverters. You can
also filter them according to your desired criteria.
Moreover, the diagnosis menu also shows you the decrease in output
("degradation") of your plant.
1 Start the web browser and enter "solar-log" in the address line of the
browser or select the bookmark in the browser's navigation bar.
The homepage is displayed.
2 Select Diagnosis in the main navigation menu.
The event log is shown.
Other manuals for 200
2
Table of contents
Other Solar-Log Inverter manuals


