Sonic Driver Modbus-UFM User manual

Made in Britain
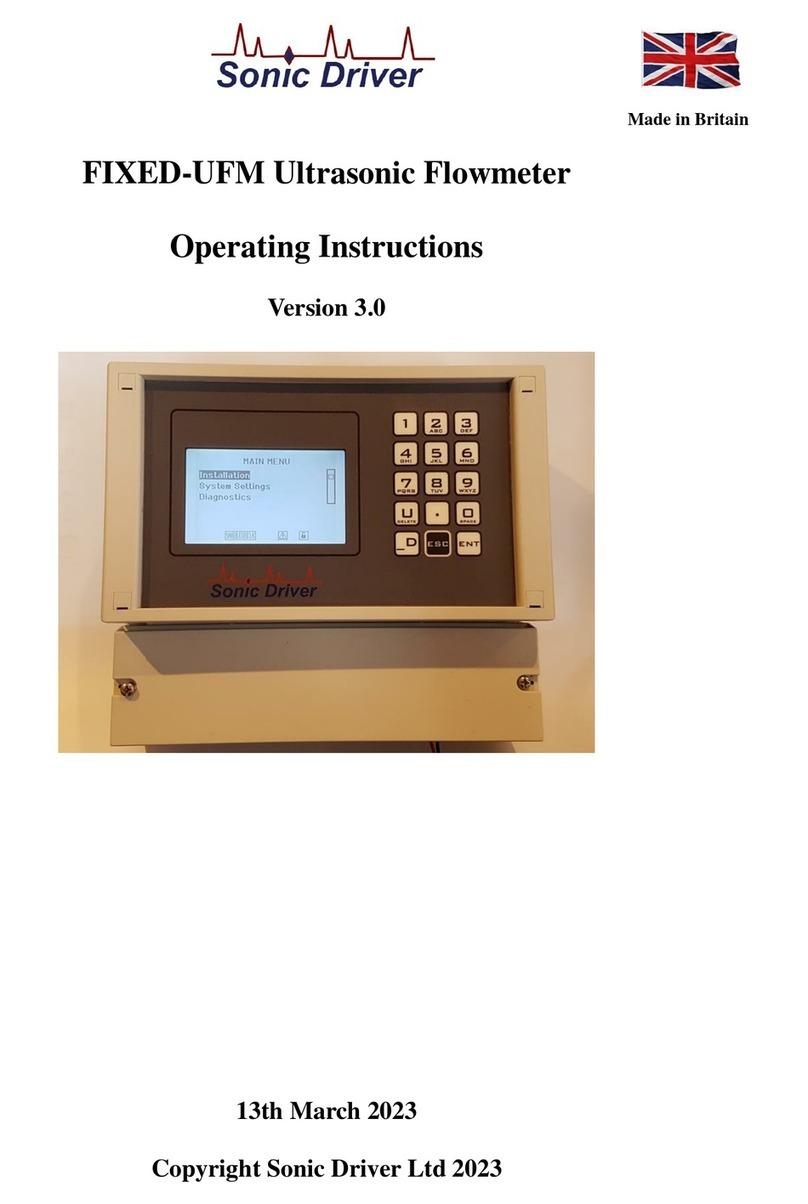
MODBUS WALL-UFM Ultrasonic Flowmeter
Operating Instructions
Version 1.0
5th August 2022
Copyright Sonic Driver Ltd 2022

Contents
1.0 Introduction
1.1 General Precautions
2.0 Configuration Program Functionality
2.1 Quick Start
2.1.1 Transducer Type
2.1.2 Number of Passes (Transducer Mounting)
2.1.3 Pipe Material
2.1.4 Pipe Outer Diameter
2.1.5 Pipe Wall Thickness
2.1.6 Pipe Roughness
2.1.7 Fluid Type
2.1.8 Fluid Temperature
2.1.9 Min Flow Cutoff
2.1.10 Flow Damping
2.2 Display of Ultrasonic Signal, Transducer Positioning
2.3 Display of Measurements
2.4 Display of Diagnostics
2.4.1 Signal Based Diagnostics
2.4.2 Time Based Diagnostics
2.4.3 Profile K
2.4.4 Reynolds
2.4.5 Transducer Spacing
2.4.6ATA/ETA
2.4.7 Error Code
2.5 Display of Internal values
3.0 Zero Tracking and Calibration
3.1 Zero Tracking
3.2 Set Zero Calibration
4.0 Powering On
5.0 Input/Output
5.1 PT100 Input
5.2 Current Output 4-20mA
5.3Alarm Relay Output
6.0 Heat Metering
7.0 Communications Software
Appendix A Error codes

1.0 Introduction
Congratulations on choosing the Sonic DriverTM MODBUS WALL-UFM wall or panel mounted
clamp-on ultrasonic flowmeter, figure(1).
Figure(1) The Sonic Driver MODBUS WALL-UFM.
The ultrasonic flowmeter (UFM) uses advanced Digital Signal Processing (DSP) and transit time
measurement techniques (Sonic Driver TM) to make accurate and reliable clamp-on ultrasonic flow
velocity measurements on liquids flowing in closed pipes
Using information about the installation, entered by the user, using the meter’s PC based
Configuration program (Windows) the UFM can calculate;
•Flow velocity (m/s)
•Volumetric flow rate (l/min)
•Mass flow rate (kg/min)
•Heat quantity flow rate (KJ/s)
When making heat measurements the UFM is designed to comply with EN1434-1 section 8 and its
Appendix A.
In order to make heat measurements it is necessary to fit optional plug-in PT100 modules to
measure inlet and outlet temperatures on heating or chilling systems.
All of the above flow measurements and a complete set of diagnostics are available over Modbus
RTU RS485.
For installation a PC is connected to the UFM via a bidirectional USB/RS485 converter.
All installation parameters are available for editing over Modbus RTU.

Once installed the PC and converter can be disconnected and the UFM connected to a Modbus RTU
RS485 network and back to a control room or Cloud based monitoring applications where a
Modbus Master polls the UFM Slave.
1.1 General Precautions
The content of this manual has been carefully checked and is believed to be accurate.
Sonic Driver Ltd assumes no responsibility for any inaccuracies that may be contained in this
manual.
In no event will Sonic Driver be liable for direct, indirect, special, incidental or consequential
damages resulting from any defect or omission in this manual, even if we are advised of the
possibility of such damages.
Sonic Driver Ltd reserves the right to make improvements to its manuals, instructions and products
at any time, without notice or obligation. The latest revisions may be found on the company web
site, www.sonic-driver.com
The UFM is a precision measuring instrument and should be handled and operated with care;
•Before operating the UFM for the first time read the installation manual and operating
instruction fully.
•Further detail on connecting and using the UFM on a Modus RTU network are available in
Modbus WALL Ultrasonic Flowmeter Modbus RTU Slave Meter, Operating Instructions,
including a full register map.
•Only use the UFM in the way and for the purpose that it is intended.
•Do not subject the UFM to bumps and shocks such as caused by dropping the UFM.
•Keep the UFM and its transducers and probes clean.
•Only use the UFM within its ambient temperature and stated level of Ingress Protection.
•Avoid excessive stress and bending of transducer cables and connectors.

2.0 Configuration Program Functionality
The UFM is installed and commissioned using the Configuration Program installed and running on
a PC (Windows).
Read the Installation manual for instructions on installing the Configuration program.
The Configuration program is basically a dashboard, see figure(2) which includes sections for;
•Quick Start
•Display of Ultrasonic Signal, Transducer Positioning
•Display of Measurements
•Display of Diagnostics
•Display of Internal Values
Figure(2) Configuration Program Dashboard.
2.1 Quick Start
This section, on the left-hand side of the dashboard, takes the user through a sequence of
configuring the basic parameters necessary to get the UFM measuring reliably and accurately, see

figure(3).
Figure(3) Quick Start Section.
Parameters and settings in the UFM can be edited by;
•Selecting an item using a scrolling list
•Ticking a Tick Box
•Direct numerical entry
It is important to note that after direct numerical entry of a parameter value it is important to press
the named button next to the entry for it to be checked against limits, entered and saved.
If the value entered it not within limits, then the entry is rejected
After entering the required Quick Start parameters, the spacing between the transducers is
calculated and displayed. Check the value displayed in the diagnostics section and space the
transducers accordingly, read the Installation manual for instructions on mounting the transducers.

2.1.1 Transducer Type
The user is prompted to select the type of sensors mounted on the pipe from a list;
•DN40
•DM10(Default)
•DM20
DM sensors are Sonic Driver standard PEEK/stainless steel design. DN sensors are Sonic Driver
small pipe design.
2.1.2 Number of Passes (Transducer Mounting)
The user is prompted to select the sound path in the pipe from a list;
•Z
•V
•N
•W
•5
•6
•7
•8
•9
•10
•11
•12
•13
•14
•15
•16
Ideally choose a number of passes that results in a path length in the fluid of 100mm or greater.
•Z is 1 pass, most common on large diameter pipes.
•V is 2 passes, the most commonly used method, simplest to install as both sensors are on
the same side of the pipe.
•N is 3 passes, used on small diameter pipes.
•W is 4 passes, used on the lowest diameter pipes.
•5 to 15 and 16, etc.
It may be that on small diameter pipes then the recommended transducer spacing at 16 passes is not
sufficient to allow the transducers to be coupled on the same side of the pipe, an even number of
passes as they touch. In this case it is unavoidable to couple the transducers on opposite sides of the
pipe using an odd number of passes, for example 13 or 15 passes.

2.1.3 Pipe Material
The user can select the pipe material from a list;
•Carbon Steel (Default)
•Stainless Steel
•Copper
•PVC
The transverse speed of sound in the pipe material is read from a database held in the UFM.
2.1.4 Pipe Outer Diameter
The user is prompted to enter a value for the pipe outer diameter. Allowed values are ranged 10.0 to
115.0mm, default 60.6mm.
2.1.5 Pipe Wall Thickness
The user is prompted to enter a value for the pipe wall thickness.Allowed values are ranged 0.5 to
100.0mm, default 3.2mm.
2.1.6 Pipe Roughness
The user is prompted to enter a value for the peak/trough height of the roughness on the inside
surface of the pipe. Allowed values are ranged 0.001 to 10.000mm, default 0.010mm.
This value is used in flow profile correction calculations.
2.1.7 Fluid Type
The user can select the fluid in the pipe from a list;
•Water (Default)
•Petrol
•Diesel
•Glycol/Water
2.1.8 Fluid Temperature
The user is prompted to enter the temperature of the fluid in the pipe.Allowed values are ranged -20
to +150 degC, default 18 degC.
Changing Fluid Temperature causes Fluid Sound Velocity, Fluid Kinematic Viscosity and Fluid
Density to be recalculated.
2.1.9 Min Flow Cutoff
If the flow velocity falls below the low flow cutoff value, the measured flow velocity and calculated
flow rate indication is driven to zero. This function can prevent the flow meter from reading flow
after a pump is shut down but there is still circulating liquid creating movement in the pipe.

Generally, 0.025m/s is recommended as the low flow cutoff point. The low flow cutoff value has no
relation to the measurement results once the velocity increases over the low flow cutoff value.
The user is prompted to enter a value in m/s below which the meter reports flow as zero.Allowed
values are ranged 0.000 to 1.000m/s, default 0.025m/s.
Note. This absolute value is applied to both positive and negative flow as a +/- band either side
of zero.
2.1.10 Flow Damping
The user is prompted to enter a display damping or averaging time.
Allowed values are ranged 1 to 255 seconds, the default is 10 seconds.
The damping time can be adjusted to stabilise the flow value being displayed. Essentially, it is a
type of signal filter applying an RC time constant.
Increasing the damping increases the stability. However, the measurement displayed can be slightly
delayed due to over damping. Too much damping may also result in no response to real time
fluctuations, especially when flow rate fluctuates wildly.
Therefore, damping should be kept at a minimum and increased just enough to reduce the
fluctuation to an acceptable degree.
Once the installation configuration has been set press the Write Meter Settings button, see figure(4).
Figure(4) Write Meter Settings
To read a previously configured UFM configuration press the Read Meter Settings button.

2.2 Display of Ultrasonic Signal, Transducer Positioning
This section displays the received ultrasonic signal to aid transducer mounting and allows coupling
optimization, see figure(5).
Figure(5) Ultrasonic Signal, Transducer Positioning.
To make a flow measurement and update this display press Read Meter Settings.
The configuration program reads and displays the ultrasonic signal being measured. The first arrival
of the signal should appear in the blue square, the green line indicates where the UFM has
determined the first arrival to be. If the UFM is not confident then this line will be red.
Flow measurement and diagnostics are shown in the relevant sections on the dashboard.
Given the parameter values entered the UFM displays the required spacing for the transducers
clamped on the pipe in the diagnostics listing.
Below the scope trace is a progress bar which shows the progress of data and parameter value
download.
2.3 Display of Measurements
This section, see figure(6) below, displays;
•Flow velocity (m/s)
•Flow rate (l/min)
•Mass flow rate (kg/min)
•Heat flow rate (KJ/s)
•Inlet temperature (degC)
•Outlet temperature (degC)
These values are averaged and have flow profile compensation and minimum flow cut off
applied.

Figure(6) Display of Measurements.
To just make flow measurements press the Read Meter Settings button.
Flow velocity is a rolling average value (see flow damping), which is flow profile compensated,
with zero flow cut off applied (see minimum flow cut-off).
The other measured values are derived from this velocity.
Most importantly, when PT100 plug-in modules are fitted then the inlet and outlet temperatures are
displayed here.
If PT100 are not fitted or Dynamic Temperature, see figure(3) is not enabled then both temperatures
are fixed at 18.0 degC.
The fluid temperature is used for compensation of; speed of sound, density and viscosity.
If inlet and outlet temperatures are known then the fluid temperature should be set to the outlet
temperature for heat metering, see section(6).
2.4 Display of Diagnostics
This section, see figure(7) displays diagnostics to aid transducer mounting and allows coupling
optimization.
Figure(7) Diagnostics Values.
To just make diagnostic measurements press the Read Meter Settings button.

2.4.1 Signal Based Diagnostics
This section displays diagnostics related to the signal strength and SNR of the received sonic signal;
•Gain
•Signal
•Noise
•SNR
Gain indicates the amount of electronic gain being used by the UFM receiver amplifier. Gain is
indicated by numbers from typically 0.0 to 81.0, in dB.
0.0 represents the minimum gain whilst 81.0 represents the maximum.
Old pipes, attenuating pipes, corrosion, attenuating fluids, etc. can require the UFM to automatically
turn up its gain.
The UFM normally operates with a gain typically around 30.0 to 60.0dB.
Signal strength indicates the detected strength of the sonic signal in decibels (dB). Signal strength is
indicated by numbers from typically -25.0 to +55.0.
Normally, the stronger the signal strength detected the better and more reliable the flow
measurement is, as well as the more stable the measurement value obtained.
Adjust the transducer positioning to the best position, within limits and check to ensure that enough
sonic coupling compound is applied during installation in order to obtain the maximum signal
strength.
The UFM normally requires signal strength over 0.0dB to measure reliably. If the signal strength
detected is too low (is zero or negative), the transducer installation position and the transducer
mounting spacing should be adjusted and the pipe should be inspected. If necessary, change the
mounting position and/or method.
Noise indicates the level of extraneous sonic and electrical noise being detected in dB. Noise is
indicated by numbers from typically -25.0 to +55.0.
The UFM normally requires noise strength below +10.0dB to measure reliably.
SNR indicates the quality of the sonic signal detected. SNR is indicated by numbers from typically
1.0 to 99.0, in dB.
represents the minimum SNR whilst 99.0 represents the maximum.
Normally, the transducer position should be adjusted and coupling compound application should be
checked until the SNR detected is as large as possible.
The UFM normally requires SNR over 12.0dB to measure reliably.
2.4.2 Time Based Diagnostics
This section shows diagnostics relating to the timing measurements being made by the UFM.

•Delta Time
•Transit Time Up
•Transit Time Down
•dT Offset
Delta Time is the difference in time between the two absolute transit times through the fluid. Delta
Time is of the order of tens of nanoseconds because the absolute upstream and downstream times
are so close together in value.
The absolute upstream transit time through the fluid in the pipe and the absolute downstream transit
time through the fluid in the pipe are usually of the order of hundreds of microseconds. They are
very nearly identical.
These values can help indicate the accuracy and condition of the installation. The measurement
calculations in the UFM are based upon these values.
Therefore, when transit time difference fluctuates widely, the flow and velocities fluctuate
accordingly. This is usually accompanied by a signal strength and/or signal to noise ratio (SNR) that
is too low and varying. This may be the result of poor pipe installation conditions, inadequate
transducer installation, or incorrect parameter input. Generally, fluctuations should be less than ±
20%.
dT Offset is the offset value currently being used by the zero-tracking function. This is usually in
the range ± 2.5ns.
Diagnostic1 and Diagnostic2 are diagnostic values intended for service personnel.
2.4.3 Profile K
Flow profile compensation factor based on Reynolds number.
2.4.4 Reynolds
The Reynolds number for the flow in the pipe.
2.4.5 Transducer Spacing
Given the values entered during Quick Start then this value is the UFM required transducer spacing,
mount the transducers on the pipe at this spacing.
The Installation Manual that accompanies these Operating Instructions gives more details regarding
mounting, coupling and spacing the transducers correctly.
2.4.6 ATA/ETA
This key gives access to a display of transit time ratio shown as a percentage value. This is a
measure of the ratio of the measured transit time to that which is expected given the parameters
entered by the user during Quick Start. It indicates if the transducer mounting and spacing is
accurate. The normal transit time ratio should be 100 ± 3% if the installation is correct.

It is acceptable to have to move one of the transducers up to ± 5mm to achieve a figure of 100%. If
more movement is necessary then one of the pipe parameters is probably incorrect. This is most
likely to be the value entered for pipe wall thickness as this is often taken from tables or it is an
estimated value.
2.4.7 Error Code
The Error Code should always be zero, seeAppendix B. It can be zeroed using the Clear Error Log
button, see figure (4).
2.5 Display of Internal Values
This section displays a Test Pattern and the Modbus address of the UFM, see figure(8).
Figure(8) Internal Values.
If the UFM is communicating correctly then the Test Pattern should always appear as 1234.
3.0 Zero Tracking and Calibration
Tick boxes exist to allow the user to set zero tracking and zero calibration functions On/Off, see
figure(9).
Figure(9) Turn Zero Tracking and Calibration On/Off.
3.1 Zero Tracking
When the measured delta time falls below a lower limit then the flow being measured is assumed by
the UFM to be zero.
The user can turn a tracking algorithm On/Off so that such a small offset value is tracked/trended to
zero.
By default, zero tracking is always turned On.

At extremely low flows the meter can mistakenly identify a flow from for example a real leak as an
erroneous offset. To avoid the leak being tracked off turn zero tracking Off.
3.2 Set Zero Calibration
The user is prompted to turn zero calibration On/Off. A zero calibration can be made before the
meter proceeds to measurement mode by using this option.
By default, Set Zero calibration is turned Off.
If Set Zero calibration is turned on then a zero flow calibration is made.
It is important that the SNR and other signal diagnostics are within tolerance during this process.
Until the meter is satisfied the display does not update. Only when happy will it start to average up.
NOTE. PIPE MUST BE FULLAND FLOW MUST BE ZERO.
The meter will make averaged measurements and determine any offset values. When the displayed
value stabilises then turn the calibration function off.
If a zero-flow delta time difference of greater then +/-2.5ns is measured then the user is should
check that there is zero flow in the pipe.

4.0 Powering On
To power on the UFM simply apply AC or DC power as appropriate to the model, see the
installation manual for details of mounting and wiring the UFM and important safety information.
As soon as the UFM is switched on a self-diagnostic program will start.
If an error is detected an error message will be logged in the diagnostics section prompting user
action. If the error persists contact customer support. Error codes and their meanings can be found
in Appendix A. Error codes can be cleared using the Clear Error button, see figure(10).
Figure(10) Clear Error Log
See relevant sections on Input/Output below for more detail of what tests are carried out.
During connection the dashboard will display;
•Company Name - Sonic Driver.
•Model Code - Show model code of the UFM.
•Serial No. - Show the unique serial number assigned to the UFM during manufacture.
•HW Issue - Show the HW version for the UFM.
•SW Issue - Show the SW version for the UFM.

5.0 Input/Output
As soon as the UFM is switched on a self-diagnostic program will start.
As part of this diagnostic the UFM polls to determine which if any optional plug-in IO modules are
fitted in its expansion slots.
Plug-in modules are slot number and position specific.
5.1 PT100 Input
If a PT100 module is fitted in slot#3 then its value corresponds to Inlet temperature.
If a PT100 module is fitted in slot#4 then its value corresponds to Outlet temperature.
The Dynamic Temperature tick box enables the PT100’s, otherwise fixed values of 18 degC are
recorded for both inlet and outlet, see figure (11).
Figure(11) Alarm Relay and Current Output Configuration.
5.2 Current Output 4-20mA
If a Current Output module is fitted in slot#5 then it is linked to flow rate. The user can enter Lower
Value and Upper Value for flow rate corresponding to 0/4 and 20mA respectively, see figure(11).
5.3 Alarm Relay Output
If a Relay module is fitted is fitted in slot#6 then it is configured as an Alarm on flow rate, the value
entered is the relay on point, see figure(11).

6.0 Heat Metering
Heat meters measure the energy necessary to provide hot water or cooling to a location such as a
building or room.
The meter measures the energy on the supply or return side of a heating (boiler) or cooling (chiller)
device by measuring the flow rate of heat or cooling fluid and the temperature difference between
the supply and return legs of the system.
The pipe from the source of heat or cooling entering a location is known as the Flow or inlet pipe.
The pipe from the location returning to the source is known as the Return or outlet pipe.
The meter is programmed to be installed on the return pipe. This is the colder pipe for heating
systems and the warmer pipe for cooling systems.
With the addition of PT100 plug-in modules for real-time measurement of inlet and outlet
temperature the UFM can function as a heat meter.
For a boiler heating installation, the flow measurement needs to be made on the cold side of the
system.
For a chiller cooling installation, the flow measurement needs to be made on the warm side of the
system.
If the correct meter installation position is not used and/or the temperature sensing elements are not
placed on the correct flow/return legs then a meter may be up to 10% inaccurate.
When making heat measurements the UFM is designed to comply with EN1434-1 section 8 and its
Appendix A.
The UFM uses Enthalpy, mass flow and temperature difference between inlet and outlet to make the
heat calculations.
7.0 Communications Software
There are several communications programs available for download online.
The UFM has been tested using Modbus Poll (for Windows platform) and Modbus Monitor (for
Android and Windows platforms).

AppendixA Error codes
Error codes are a 16-bit value, where each bit represents an error flag with value 0 when there is no
error and 1 when an error condition is present;
•0 Processor internal address error
•1 Processor internal math error
•2 Processor internal oscillator error
•3 Processor internal stack error
•4 Meter external FRAM memory error
•5 SPI1 bus error
•6 SPI2 bus error
•7 TOFM communications error
•8 UART error
•9 Spare
•10 Spare
•11 Spare
•12 Spare
•13 Spare
•14 Spare
•15 Spare
Spare bits are always 0.
Sonic Driver
Table of contents
Other Sonic Driver Measuring Instrument manuals
Popular Measuring Instrument manuals by other brands
Harris
Harris STM-1 Technical manual

Kusam-meco
Kusam-meco KM 181 Operation manual
Ambient Weather
Ambient Weather WS-228TBH user manual

PCB Piezotronics
PCB Piezotronics 3503A112KG Installation and operating manual

Magnetrol
Magnetrol eclipse 705 Functional safety manual
SIGRIST
SIGRIST AquaScat S instruction manual

Burster
Burster Resistomat 2316 manual

TR-Electronic
TR-Electronic LE-25 Assembly instructions

Industrial Scientific
Industrial Scientific TMX412 instruction manual
Promag
Promag Mifare DESFire DF7 Series user manual

Milwaukee
Milwaukee Mi453 instruction manual
Bosch
Bosch Rexroth BODAS DSA/12 instruction manual
