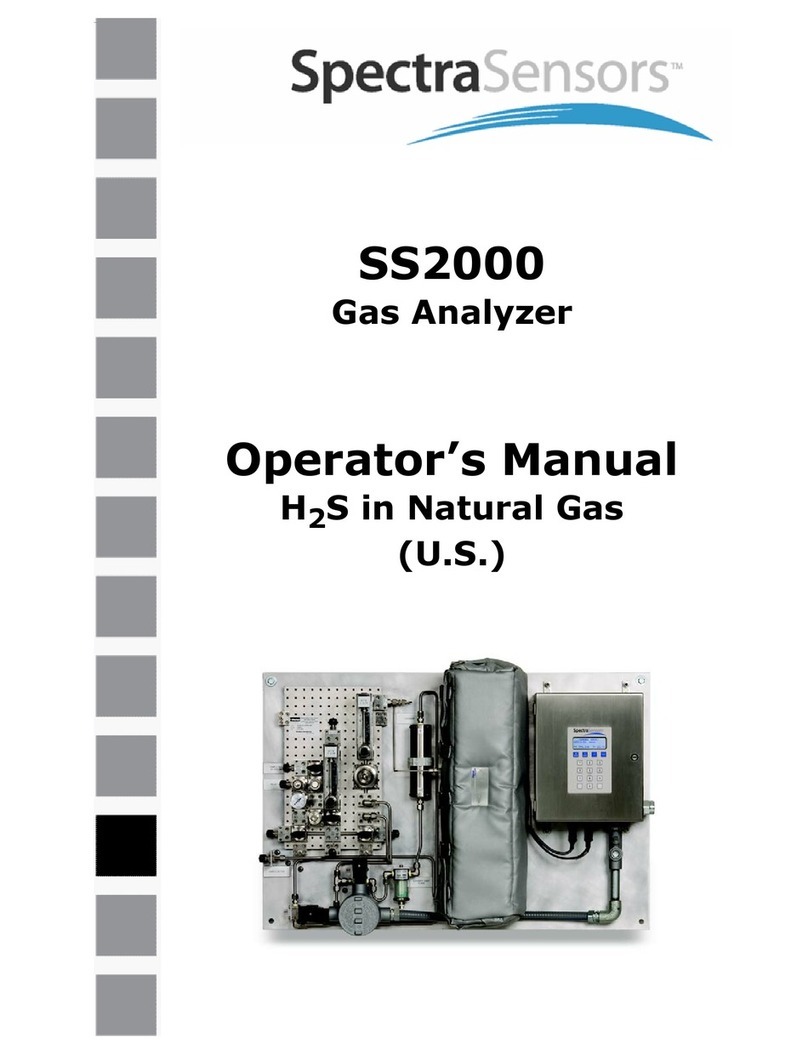
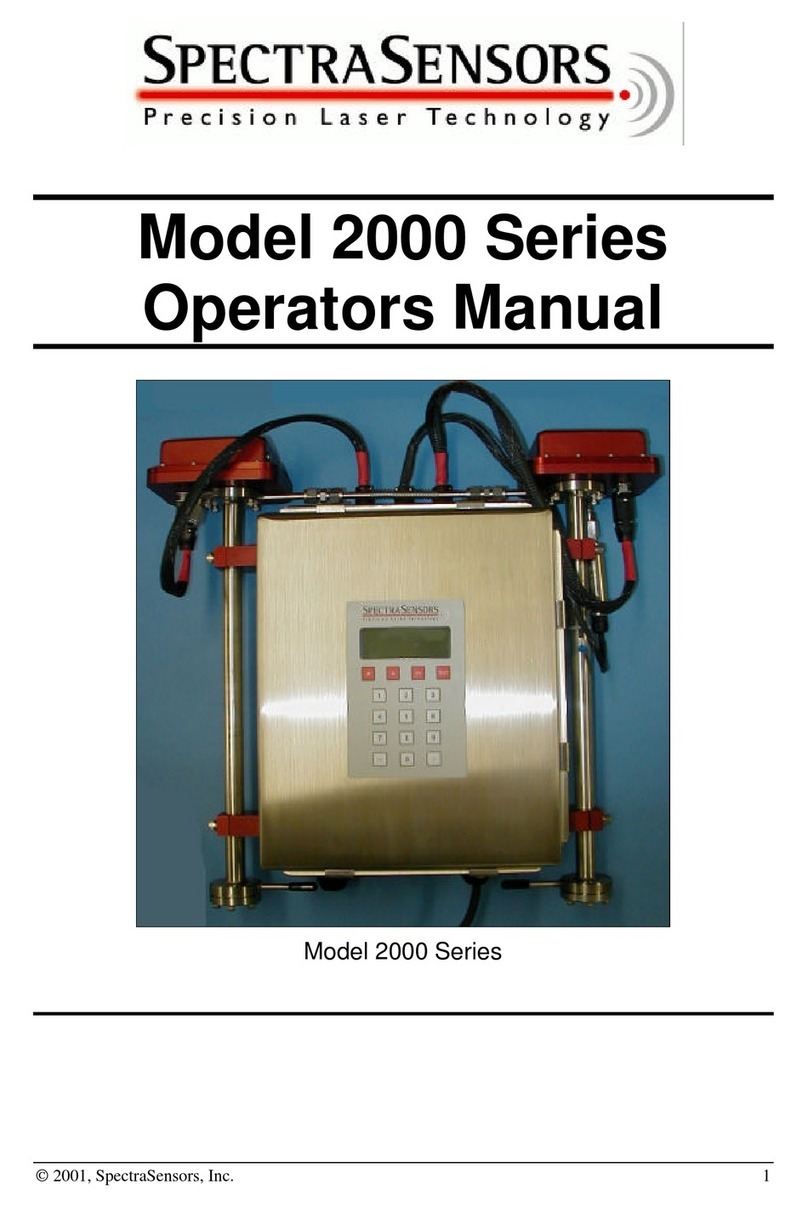
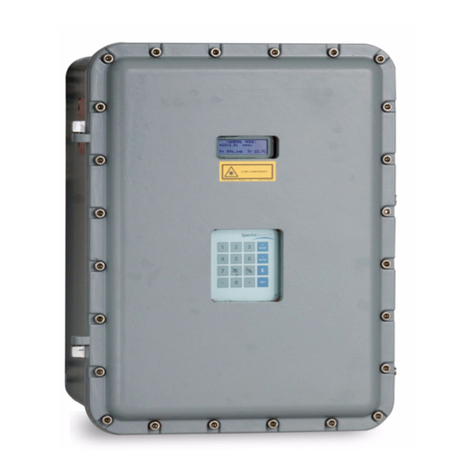
Spectrasensors SS1000 User manual

SS1000
Gas Analyzers
Operator’s Manual

SS1000 Operator’s Manual
vi 49000-02079 rev. A 4-29-10
THIS PAGE INTENTIONALLY LEFT BLANK


Products of
11027 Arrow Route
Rancho Cucamonga, CA 91730
Tel: 800.619.2861
Fax: 909.948.4100
www.spectrasensors.com
Copyright © 2010 SpectraSensors, Inc. No part of this manual may be reproduced in
whole or in part without the express written permission of SpectraSensors, Inc.
SpectraSensors reserves the right to change product design and specifications at any
time without prior notice.
SS1000
Gas Analyzers
Operator’s Manual
This manual applies to firmware version:
v2.41

THIS PAGE INTENTIONALLY LEFT BLANK

SS1000 Operator’s Manual i
TABLE OF CONTENTS
Table of Contents . . . . . . . . . . . . . . . . . . . . . . . . . . . . . . . . . . . . . . . . . . . . i
List of Figures . . . . . . . . . . . . . . . . . . . . . . . . . . . . . . . . . . . . . . . . . . . . . . .v
List of Tables . . .. .. . .. . .. . .. .. . .. . .. . .. .. . .. . .. . .. .. . .. . .. . . vii
1: Introduction
Who Should Read This Manual . . . .. .. . .. . .. . .. .. . .. . .. . .. .. . .. . .. . 1-1
How to Use This Manual. . .. . .. . .. .. . .. . .. . .. .. . .. . .. . .. .. . .. . .. . 1-1
Special Symbols Used in This Manual . . . .. . .. . .. .. . .. . .. . .. .. . .. . .. . 1-2
General Warnings and Cautions. . .. . .. . .. . .. .. . .. . .. . .. .. . .. . .. . 1-2
SpectraSensors Overview . . . . . . . . . . . . . . . . . . . . . . . . . . . . . . . . . . . . . . . 1-4
About the Gas Analyzers . . . . . . . . . . . . . . . . . . . . . . . . . . . . . . . . . . . . . . . . 1-4
How the Analyzer Works . .. . .. . .. .. . .. . .. . .. .. . .. . .. . .. .. . .. . .. . 1-4
2: Installation
What Should be Included in the Shipping Box . . . .. .. . .. . .. . .. .. . .. . .. . 2-1
Inspecting the Analyzer . . . . . . . . . . . . . . . . . . . . . . . . . . . . . . . . . . . . . . . . . 2-1
Hardware and Tools forInstallation. . .. . .. . .. . .. .. . .. . .. . .. .. . .. . .. . 2-1
Hardware . .. . .. .. . .. . .. . .. .. . .. . .. . .. .. . .. . .. . .. .. . .. . ... 2-1
Tools . .. . .. . .. .. . .. . .. . .. .. . .. . .. . .. .. . .. . .. . .. .. . .. . .. . 2-2
Setting up the Analyzer . . .. . .. . .. .. . .. . .. . .. .. . .. . .. . .. .. . .. . .. . 2-2
Connecting the Gas Lines. . . . . . . . . . . . . . . . . . . . . . . . . . . . . . . . . . . . . . . . 2-2
To connect the sample supply line . . . .. . .. . .. .. . .. . .. . .. .. . .. . .. . 2-3
To connect the sample return . .. .. . .. . .. . .. .. . .. . .. . .. .. . .. . .. . 2-4
Conditioning the SCS Tubing . .. . .. .. . .. . .. . .. .. . .. . .. . .. .. . .. . .. . 2-4
Connecting Electrical Power to the Analyzer . . .. . .. .. . .. . .. . .. .. . .. . .. . 2-5
Connecting the Output Signals . . . .. .. . .. . .. . .. .. . .. . .. . .. .. . .. . .. . 2-5
3: Operating the Analyzer
Powering Up the Analyzer . . . .. . .. .. . .. . .. . .. .. . .. . .. . .. .. . .. . .. . 3-1
To power up the analyzer . .. . .. .. . .. . .. . .. .. . .. . .. . .. .. . .. . ... 3-1
Powering Down the Analyzer . . . . . . . . . . . . . . . . . . . . . . . . . . . . . . . . . . . . . 3-2
To power down the analyzer . . .. .. . .. . .. . .. .. . .. . .. . .. .. . .. . .. . 3-2
Operating the Analyzer from the Keypad . .. . .. . .. .. . .. . .. . .. .. . .. . .. . 3-2
Modes Defined . . . .. .. . .. . .. . .. .. . .. . .. . .. .. . .. . .. . .. .. . .. . .. . 3-3
Mode 1: (Normal Mode) . . .. . .. .. . .. . .. . .. .. . .. . .. . .. .. . .. . .. . 3-4
Mode 2: (Set Parameter Mode) . . .. . .. . .. . .. .. . .. . .. . .. .. . .. . .. . 3-4
Mode 3: (Not Used) . . . . . . . . . . . . . . . . . . . . . . . . . . . . . . . . . . . . . . . . . 3-4
Mode 4: (System Diagnostic Parameters) . . . . .. .. . .. . .. . .. .. . .. . .. . 3-4
Mode 5: (Not Used) . . . . . . . . . . . . . . . . . . . . . . . . . . . . . . . . . . . . . . . . . 3-5
Mode 6: (Diagnostic Data Download) . . . . .. . .. .. . .. . .. . .. .. . .. . .. . 3-5
Mode TEST: (System Test) . . . .. .. . .. . .. . .. .. . .. . .. . .. .. . .. . .. . 3-6
Changing Measurement and Control Parameters. . .. .. . .. . .. . .. .. . .. . .. . 3-6
To change parameters in Mode 2. . . . .. . .. . .. .. . .. . .. . .. .. . .. . .. . 3-6
Measurement and Control Parameters Defined . . . .. .. . .. . .. . .. .. . .. . .. . 3-8
S Factor . . . . . . . . . . . . . . . . . . . . . . . . . . . . . . . . . . . . . . . . . . . . . . . . . 3-8
S Factor Offset . . . . . . . . . . . . . . . . . . . . . . . . . . . . . . . . . . . . . . . . . . . . 3-8
# Spectrum Average . .. . .. . .. .. . .. . .. . .. .. . .. . .. . .. .. . .. . .. . 3-8
Logger Rate . . . . . . . . . . . . . . . . . . . . . . . . . . . . . . . . . . . . . . . . . . . . . . 3-9
Peak Tracking . .. .. . .. . .. . .. .. . .. . .. . .. .. . .. . .. . .. .. . .. . .. . 3-9
Temperature Unit . . . ... .. . .. .. . .. . .. . .. .. . .. . .. . .. .. . .. . .. . 3-9
Pressure Unit. . . . . . . . . . . . . . . . . . . . . . . . . . . . . . . . . . . . . . . . . . . . . 3-10
Concentration Unit . . .. . .. . .. .. . .. . .. . .. .. . .. . .. . .. .. . .. . .. 3-10

SS1000 Operator’s Manual
ii 49000-02079 rev. A 4-29-10
Pipeline Pressure (if applicable) . . .. . .. .. . .. . .. . .. .. . .. . .. . .. .. . 3-10
Modbus Address . .. . .. .. . .. . .. . .. .. . .. . .. . .. .. . .. . .. . .. .. . 3-11
Modbus Mode . . . .. . .. .. . .. . .. . .. .. . .. . .. . .. .. . .. . .. . .. .. . 3-11
User Analyzer ID . .. . .. .. . .. . .. . .. .. . .. . .. . .. .. . .. . .. . .. .. . 3-11
User Sample ID . .. . .. .. . .. . .. . .. .. . .. . .. . .. .. . .. . .. . .. .. . 3-12
User Component ID . . . . . . . . . . . . . . . . . . . . . . . . . . . . . . . . . . . . . . . . 3-12
Adjusting Analyzer Reading to Match Specific Standard(s) . . .. . .. . .. . .. .. . 3-12
To adjust the analyzer reading . . .. . .. .. . .. . .. . .. .. . .. . .. . .. .. . 3-13
Changing Measurement Range (for dual-range moisture systems only) . . . . . . . 3-13
To change measurement range . . .. . .. .. . .. . .. . .. .. . .. . .. . .. .. . 3-13
Faults . . . . . . . . . . . . . . . . . . . . . . . . . . . . . . . . . . . . . . . . . . . . . . . . . . . . 3-15
Validating the Analyzer . . .. .. . .. . .. . .. .. . .. . .. . .. .. . .. . .. . .. .. . 3-15
To validate the analyzer . .. . .. . .. . .. .. . .. . .. . .. .. . .. . .. . .. .. . 3-15
Calibrating the Analyzer. . .. .. . .. . .. . .. .. . .. . .. . .. .. . .. . .. . .. .. . 3-16
4: Serial Port Communications
Receiving Serial Data (RS-232 Output) . . . . . . . . . . . . . . . . . . . . . . . . . . . . . . 4-1
To launch HyperTerminal . . . .. . .. . .. .. . .. . .. . .. .. . .. . .. . .. .. . . 4-1
To capture and save data from the serial port . . . .. . .. .. . .. . .. . .. .. . . 4-4
To read diagnostic data with HyperTerminal . .. . .. . .. .. . .. . .. . .. .. . . 4-4
Viewing Diagnostic Data with Microsoft Excel . . . .. . .. . .. .. . .. . .. . .. .. . . 4-5
To import the data file into Excel . . . . .. .. . .. . .. . .. .. . .. . .. . .. .. . . 4-5
Modbus Communications Protocol . . . .. . .. .. . .. . .. . .. ... .. . .. . .. .. . 4-10
Framing/Protocol . .. . .. .. . .. . .. . .. .. . .. . .. . .. .. . .. . .. . .. .. . 4-12
Functions . . . . . . . . . . . . . . . . . . . . . . . . . . . . . . . . . . . . . . . . . . . . . . . 4-12
Addressing . . . . . . . . . . . . . . . . . . . . . . . . . . . . . . . . . . . . . . . . . . . . . . 4-12
Reading/Writing in Daniel Modbus Mode . .. . .. . .. . .. .. . .. . .. . .. .. . 4-12
Reading/Writing in Gould Modbus Mode . ... .. . .. . .. .. . .. . .. . .. .. . 4-13
To enable Modbus communications . . .. .. . .. . .. . .. .. . .. . .. . .. .. . 4-13
Modbus Accessible Parameter Definitions. . . . .. . .. .. . .. . .. . .. .. . 4-16
Appendix A: Troubleshooting
Gas Leaks . . .. . .. . .. . .. .. . .. . .. . .. .. . .. . .. . .. .. . .. . .. . .. .. . .A-1
Membrane Separator Filter. . .. . .. . .. . .. .. . .. . .. . .. .. . .. . .. . .. .. . .A-1
To replace the membrane . . . . . . . . . . . . . . . . . . . . . . . . . . . . . . . . . . . . . A-1
Contamination . . .. . .. . .. .. . .. . .. . .. .. . .. . .. . .. .. . .. . .. . .. .. . .A-2
To keep the sampling lines clean . . . . .. .. . .. . .. . .. .. . .. . .. . .. .. . .A-2
Cleaning the Mirrors . .. . .. .. . .. . .. . .. .. . .. . .. . .. .. . .. . .. . .. .. . .A-3
Tools and Supplies. . . .. .. . .. . .. . .. .. . .. . .. . .. .. . .. . .. . .. .. . .A-3
To clean the mirrors. . .. .. . .. . .. . .. .. . .. . .. . .. .. . .. . .. . .. .. . .A-4
Excessive Sampling Gas Temperatures and Pressures . . . . . . . . . . . . . . . . . . . . A-5
Electrical Noise . . .. . .. . .. .. . .. . .. . .. .. . .. . .. . .. .. . .. . .. . .. .. . .A-5
Peak Tracking Reset Procedure. . .. . .. . .. .. . .. . .. . .. .. . .. . .. . .. .. . .A-5
To check the PkDf and PkD1 values . . .. .. . .. . .. . .. .. . .. . .. . .. .. . .A-6
To reset the Peak Tracking Function. . .. .. . .. . .. . .. .. . .. . .. . .. .. . .A-6
Instrument Problems. . . . . . . . . . . . . . . . . . . . . . . . . . . . . . . . . . . . . . . . . . . A-7
Removing the Cover . . . . . . . . . . . . . . . . . . . . . . . . . . . . . . . . . . . . . . . . . . . A-7
Checking the Fuses . . .. . .. .. . .. . .. . .. .. . .. . .. . .. .. . .. . .. . .. .. . .A-8
Service Contact . .. . .. . .. .. . .. . .. . .. .. . .. . .. . .. .. . .. . .. . .. .. . .A-8
Disclaimers . .. . .. . .. . .. .. . .. . .. . .. .. . .. . .. . .. .. . .. . .. . .. .. . .A-8
Warranty . .. .. . .. . .. . .. .. . .. . .. . .. .. . .. . .. . .. .. . .. . .. . .. .. . .A-8
Appendix B: Specifications
Spare Parts . . . . . . . . . . . . . . . . . . . . . . . . . . . . . . . . . . . . . . . . . . . . . . . . . B-5
Index. . . . . . . . . . . . . . . . . . . . . . . . . . . . . . . . . . . . . . . . . . . . . . . . . Index-1

Table of Contents
49000-02079 rev. A 4-29-10 iii

SS1000 Operator’s Manual
iv 49000-02079 rev. A 4-29-10
THIS PAGE INTENTIONALLY LEFT BLANK

SS1000 Operator’s Manual v
LIST OF FIGURES
Figure 1–1: Schematic of a typical laser diode absorption spectrometer. 1-5
Figure 1–2:Typical raw signal from a laser diode absorption spectrometer with and
without mirror contamination. 1-6
Figure 1–3:Typical normalized absorption signal from a laser diode absorption
spectrometer. 1-6
Figure 1–4: Typical normalized 2fsignal where the species concentration is propor-
tional to the peak height. 1-7
Figure 3–1:SS1000 keypad. 3-3
Figure 4–1:Connection Description window.4-2
Figure 4–2:Connect To window. 4-2
Figure 4–3: COM Properties window.4-3
Figure 4–4: Hyperterminal window with streaming data. 4-3
Figure 4–5:Sample diagnostic data output. 4-6
Figure 4–6:Sample diagnostic data output (continued).4-7
Figure 4–7: a) Opening a data file in Excel. b) Setting data type in Text Import
Wizard. 4-8
Figure 4–8:a) Setting Tab and Space as delimiters. b) Highlighting imported data
for plotting in Excel. 4-9
Figure 4–9: Chart Wizard - Step 1 window. 4-10
Figure 4–10: a) Data file plot in Excel. b) Format Data Series window. 4-11
Figure B–1:SS500/SS2000 analyzer external features. B-3
Figure B–2: Fuse location on DC to DC converter. B-4

SS1000 Operator’s Manual vii
LIST OF TABLES
Table 3–1:Measurement and control parameters. 3-7
Table 4–1:Modbus register map . 4-15
Table A–1: Fuse specifications (refer to Figure B–1 or Figure B–2). A-8
Table A–2: Potential instrument problems and solutions . A-10
Table B–1: SS1000 moisture in natural gas analyzer specifications. B-1
Table B–2: SS1000 carbon dioxide in natural gas analyzer specifications. B-2
Table B–3: Replacement parts for SS1000 SS1000 Operator’s Manual
analyzers. B-5

SS1000 Operator’s Manual
01-92-4A.ver97020-00094iiiv
THIS PAGE INTENTIONALLY LEFT BLANK

SS1000 Operator’s Manual 1–1
1 - INTRODUCTION
SpectraSensors SS1000 products are high-speed, diode-laser based extractive
analyzers designed for extremely reliable monitoring of very low (trace) to
standard concentrations of H2O or CO2in Natural Gas. In order to ensure that
the analyzer performs as specified, it is important to pay close attention to the
details of the installation and operation. This manual contains a comprehensive
overview of the SS1000 analyzer and step-by-step instructions on:
•Inspecting the Analyzer
•Setting up the Analyzer
•Powering Up the Analyzer
•Operating the Analyzer
•Serial Port Communications
•Powering Down the Analyzer
•Troubleshooting
Who Should Read This Manual
This manual should be read and referenced by anyone installing, operating, or
having contact with the analyzer.
How to Use This Manual
Take a moment to familiarize yourself with this Operator’s Manual by reading
the Table of Contents.
There are a number of options and accessories available for the SS1000
analyzers. This manual has been written to address the most common options
and accessories. Read each section in the manual carefully so you can quickly
and easily install and operate the analyzer.
The manual includes images, tables, and charts that provide a visual
understanding of the analyzer and its functions. Special symbols are also used
to make you aware of potential hazards, important information, and valuable
tips. Pay close attention to this information.

SS1000 Operator’s Manual
1–01-92-4A.ver97020-000942
Special Symbols Used in This Manual
This manual uses the following symbols to represent potential hazards, caution
alerts, and important information associated with the analyzer. Every symbol
has significant meaning that should be heeded.
General Warnings and Cautions
Following are general warnings and cautions to observe when servicing the
analyzer.
This icon denotes a warning statement. Warning statements
indicate a potentially hazardous situation which, if not avoided,
may result in serious injury or death.
Failure to follow all directions may result in fire.
Failure to follow all directions or substitution of components may
result in explosion.
Class IIIb radiation product. When open, avoid exposure to beam.
Failure to follow all directions may result in damage or
malfunction of the analyzer.
Important information concerning the installation and operation
of the analyzer.
Process samples maycontain hazardous material in potentially
flammable and/or toxic concentrations. Personnel should have a
thorough knowledge and understanding of the physical properties
of the sampler and prescribed safety precautions before operating
the Sample Conditioning System.

Introduction
101-92-4A.ver97020-00094 –3
Explosion hazard. Substitution of components may impair
suitability for Class I, Div. 2.
Explosion hazard. Do not connect or disconnect equipment unless
power has been switched off or the area is known to be non-
hazardous.
Always disconnect the main power to the instrument before
attempting any repair.
Read and understand all instructions before attempting to operate
the instrument. Observe all caution notes and warning labels.
Class IIIb invisible laser radiation. When open, avoid exposure to
beam. Conforms to provisions of US 21 CFR1040 10. Class I laser
product. Refer servicing to the manufacturer’s qualified
personnel.
Use a damp cloth to clean display and keypad to avoid static
electric discharge.
Do not exceed 10 psig (0.7 barg) in sample cell. Damage to cell
may result.
Do not hold or carry the analyzer by the measurement heads or
sample cells. Doing so may result in optical misalignment
affecting the performance of the sensor.
When selecting an analyzer, the total system design must be
considered to ensure safe, trouble-free performance. Function,
sizing, proper installation, operation, and maintenance are
beyond the control of SpectraSensors and are the responsibilities
of the system designer and user.

SS1000 Operator’s Manual
1–01-92-4A.ver97020-000944
SpectraSensors Overview
SpectraSensors, Inc. (SSI) is a leading manufacturer of state-of-the-art
electro-optic gas analyzers for the industrial process, gas distribution and
environmental monitoring markets. Headquartered in Houston, Texas, SSI was
incorporated in 1999 as a spin-off of the NASA/Caltech Jet Propulsion
Laboratory (JPL) with the purpose of commercializing space-proven
measurement technologies initially developed at JPL.
About the Gas Analyzers
The SS1000 is a tunable diode laser (TDL) absorption spectrometers operating
in the near- (IR-A, 0.75–1.4 µm) to short-wavelength infrared (IR-B, 1.4–3
µm). Each compact sensor consists of a TDL light source, sample cell and
detector specifically configured to enable high sensitivity measurement of a
particular component in the presences of other gas phase constituents in the
stream. The sensor is controlled by microprocessor-based electronics with
embedded software that incorporates advanced operational and data
processing algorithms.
An appropriate sample conditioning system may also be included with the
system that has been specifically designed to deliver an optimum sample
stream that is representative of the process stream at the time of sampling.
Most SS1000 analyzer systems are configured for use at extractive natural gas
sampling stations.
How the Analyzer Works
The SS1000 analyzer employs tunable diode laser absorption spectroscopy
(TDLAS) to detect the presence of trace substances in process gases.
Absorption spectroscopy is a widely used technique for sensitive trace species
detection. Because the measurement is made in the volume of the gas, the
response is much faster, more accurate and significantly more reliable than
traditional surface-based sensors that are subject to surface contamination.
In its simplest form, a diode laser absorption spectrometer typically consists of
a sample cell with a mirror at one end and a mirror or window at the other
through which the laser beam can pass, as shown in Figure 1–1. The laser
beam enters the cell and reflects off the mirror(s) making one or more trips
through the sample gas and eventually exiting the cell where the remaining
beam intensity is measured by a detector. With the SS1000 analyzers, sample
gas flows continuously through the sample cell ensuring that the sample is
always representative of the flow in the main pipe.
If equipment is used in a manner not specified by the
manufacturer, the protection provided by the manufacturer may
be impaired.

Introduction
101-92-4A.ver97020-00094 –5
Due to their inherent structure, the molecules in the sample gas each have
characteristic natural frequencies (or resonances). When the output of the
laser is tuned to one of those natural frequencies, the molecules with that
particular resonance will absorb energy from the incident beam. That is, as the
beam of incident intensity, I0(λ),passes through the sample, attenuation occurs
via absorption by the trace gas with absorption cross section σ(λ). According
to the Beer-Lambert absorption law, the intensityremaining, I(λ), as measured
by the detector at the end of the beam path of length l(cell length ×number
of passes), is given by
)1(,
where Nrepresents the species concentration. Thus, the ratio of the absorption
measured when the laser is tuned on-resonance versus off-resonance is
directly proportional to the number of molecules of that particular species in
the beam path, or
)2(.
Figure 1–2 shows typical raw data from a laser absorption spectrometer scan
including the incident laser intensity, I0(λ),and the transmitted intensity, I(λ),
for a clean system and one with contaminated mirrors (shown to illustrate the
systems relative insensitivity to mirror contamination). The positive slope of
the raw data results from ramping the current to tune the laser, which not only
increases the wavelength with current, but also causes the corresponding
output power to increase. By normalizing the signal by the incident intensity,
any laser output fluctuations are cancelled, and a typical, yet more
pronounced, absorption profile results, as shown in Figure 1–3. Note that
contamination of the mirrors results solely in lower overall signal. However, by
tuning the laser off-resonance as well as on-resonance and normalizing the
L
D
DETECTOR
LASER
RORRIMRORRIM
I0(λ)
I(λ)
TRACE GAS ABSORPTION
α(λ)
GAS IN
GAS OUT
Figure 1–1 Schematic of a typical laser diode
absorption spectrometer.
Iλ( ) I
0
λ( )exp σ λ( )lN–[ ]=
N
1–
σ λ( )l
--------------
Iλ( )
I0λ( )
-------------
ln=

SS1000 Operator’s Manual
1–01-92-4A.ver97020-000946
Figure 1–2 Typical raw signal from a laser diode
absorption spectrometer with and without mirror
contamination.
Figure 1–3 Typical normalized absorption signal
from a laser diode absorption spectrometer.

Introduction
101-92-4A.ver97020-00094 –7
data, the technique self calibrates every scan resulting in measurements that
are unaffected by mirror contamination.
SpectraSensors takes the fundamental absorption spectroscopy concept a step
further by using a sophisticated signal detection technique called wavelength
modulation spectroscopy (WMS). When employing WMS, the laser drive
current is modulated with a kHz sine wave as the laser is rapidly tuned. A lock-
in amplifier is then used to detect the harmonic component of the signal that
is at twice the modulation frequency (2f), as shown in Figure 1–4. This phase-
sensitive detection enables the filtering of low-frequency noise caused by
turbulence in the sample gas, temperature and/or pressure fluctuations, low-
frequency noise in the laser beam or thermal noise in the detector.
With the resulting low-noise signal and use of fast post-processing algorithms
combined with careful calibration to correct for secondary effects caused by
temperature and pressure variations and occasional spectral overlap with
background species, reliable parts per million (ppm) or even parts per billion
(ppb) detection levels are possible (depending on target and background
species) at real-time response rates (on the order of 1 second).
All SpectraSensors TDL gas analyzers employ the same design and hardware
platform. Measuring different trace gases such as H2O, HCl, H2S, NH3, CO2, CO
and O2in various mixed hydrocarbon background streams, including natural
gas (alkanes), ethylene, propylene, refinery fuel gas, hydrogen reformer gas,
syngas and others, is accomplished by simply choosing a different optimum
diode laser wavelength between 700 nm and 3000 nm which provides the least
amount of sensitivity to background stream variations. Use of ultra-high
Figure 1–4 Typical normalized 2fsignal where the
species concentration is proportional to the peak
height.

SS1000 Operator’s Manual
1–01-92-4A.ver97020-000948
reliability optical telecommunications diode lasers (manufactured to stringent
Telcordia GR 468 specifications), 316L stainless steel, coated optical reflectors,
absence of any moving parts, tolerance to condensation of process liquids and
accumulation of particulates from gas streams eliminates requirements for
field calibration and frequent maintenance making SpectraSensors TDL
analyzers the most reliable gas analyzer platform with the lowest total cost of
ownership.
Table of contents
Other Spectrasensors Measuring Instrument manuals
Popular Measuring Instrument manuals by other brands
Maxtec
Maxtec R217P65 Operating manual & instructions for use

Reiss
Reiss TARAsys MT10-CL operating instructions
Wohler
Wohler TA 420 Operation manual

PCB Piezotronics
PCB Piezotronics Modally Tuned TLD086D05 Installation and operating manual

METER
METER AQUALAB PAWKIT manual
Geokon
Geokon 4300 Series instruction manual
