Sper scientific 800013 User manual

1
Datalogging
RH / Temperature Pen
800013
Instruction Manual

2
Datalogging RH / Temperature Pen 800013
Copyright ©2014 by
Sper Scientic
ALL RIGHTS RESERVED
Printed in the USA
The contents of this manual may not be reproduced
or transmitted in any form or by any means electronic,
mechanical, or other means that do not yet exist or may
be developed, including photocopying, recording, or
any information storage and retrieval system without the
express permission from Sper Scientic.

3
TABLE OF CONTENTS
1. INTRODUCTION . . . . . . . . . . . . . . . . . 4
2. MATERIALS SUPPLIED . . . . . . . . . . . . . 4
3. FEATURES . . . . . . . . . . . . . . . . . . . . 5
4. METER COMPONENTS . . . . . . . . . . . . . 6
5. WRIST STRAP INSTALLATION . . . . . . . . . 7
6. SOFTWARE INSTALLATION . . . . . . . . . . 8
7. RUNNING THE SOFTWARE . . . . . . . . . . 9
8. DATALOGGER SETTINGS . . . . . . . . . . .10
Setting Options . . . . . . . . . . . . . . . . . . 10
Comm Port Setting . . . . . . . . . . . . . . . . 10
Basic Logger Setting . . . . . . . . . . . . . . . 12
Logger Alarm & Sensor Setting . . . . . . . . . . 12
Logger Sampling Setting . . . . . . . . . . . . . 13
Setting Start Modes . . . . . . . . . . . . . . . . 14
9. DATA SAMPLING AND RECORDING. . . . . . 17
10. DOWNLOADING DATA. . . . . . . . . . . . . 20
11. BATTERY REPLACEMENT . . . . . . . . . .22
12. SPECIFICATIONS . . . . . . . . . . . . . . .23
13. WARRANTY . . . . . . . . . . . . . . . . . . . 24

4
INTRODUCTION
This Sper Scientic RH/Temperature Datalogger Pen
800013 is an extremely fast and accurate meter with
multiple functions. The meter reads and records relative
humidity, air temperature, dew point, and wet bulb.
The datalogger records up to 32,000 data points which can
be downloaded by plugging the pen directly into a USB
port. No cradle or cable is necessary. Green and red LED
lights indicate datalogging and alarms.
MATERIALS SUPPLIED
• Datalogging RH/Temperature Pen with
USB Cap and Sensor Cap
• Go to www.sperdirect.com/software.htm and nd
800013 - Datalogging RH/Temperature Pen or search
for 800013 and download from product page.
• One 3.6v ½ AA Lithium Battery
• Wrist Strap
• Instruction Manual

5
FEATURES
• Displays current readings of RH & Temperature,
can be programmed to log date, time, humidity,
air temperature, dew point, and wet bulb readings.
• Highly accurate microcomputer circuit
• Direct upload of data to Excel
• Manual datalogger option
• LEDs indicate datalogging and alarms
• Tripod mounting screw

6
METER COMPONENTS
1. Sensor
2. LCD Display
3. LED Indicators
a. Green LED ashing:
Logging is in progress
b. Red LED ashing:
Reading exceeds Hi/Lo alarm threshold
4. Power Button / Key Start
5. Battery Compartment
6. USB Drive
7. Sensor Cap (not shown)
8. Tripod Mounting Screw (on back, not shown)
1. 2. 5. 6.3a. 3b. 4.

7
WRIST STRAP INSTALLATION
1. Grasp the thinner thread loop attached to the wrist
strap so that your thumb and forenger press the
end of the loop at.
2. Guide the closed loop
into the small receptacle
on the underside of
the datalogger pen
near the USB. Pull the
loop through until it is
stopped by the
plastic fastener.
3. Hold the loop open and
guide the thicker end of
the wrist strap through
the open loop.
4. Pull the wrist strap
all the way through
the loop.

8
SOFTWARE INSTALLATION
Software Download
You can download the software that came with your
meter directly. Go to the www.sperdirect.com/software.
htm and nd your meter or search for you meter
(800013) and download from product page.
Installing the Software Package
1. Open the Downloaded software le.
2. Open the Volume File.
3. Open the Setup Application.
4. When the dialog box appears, Click Run.
5. Click YES to allow setup.exe to make changes to
your computer.
6. Click NEXT.
7. Click FINISH.
8. Restart your computer.

9
RUNNING THE SOFTWARE
1. Insert the USB drive into the USB port.
2. Open the Start Menu and select the “Data Logger”
Icon from the programs list.
3. The USB Data Logger Monitor screen displays.
Note…
If the datalogger is not plugged into the USB port, an
error message will appear. Make sure that the logger is
plugged in correctly.

10
DATALOGGER SETTINGS
To Access Setting Options:
Select “Setting” from the header options on the upper
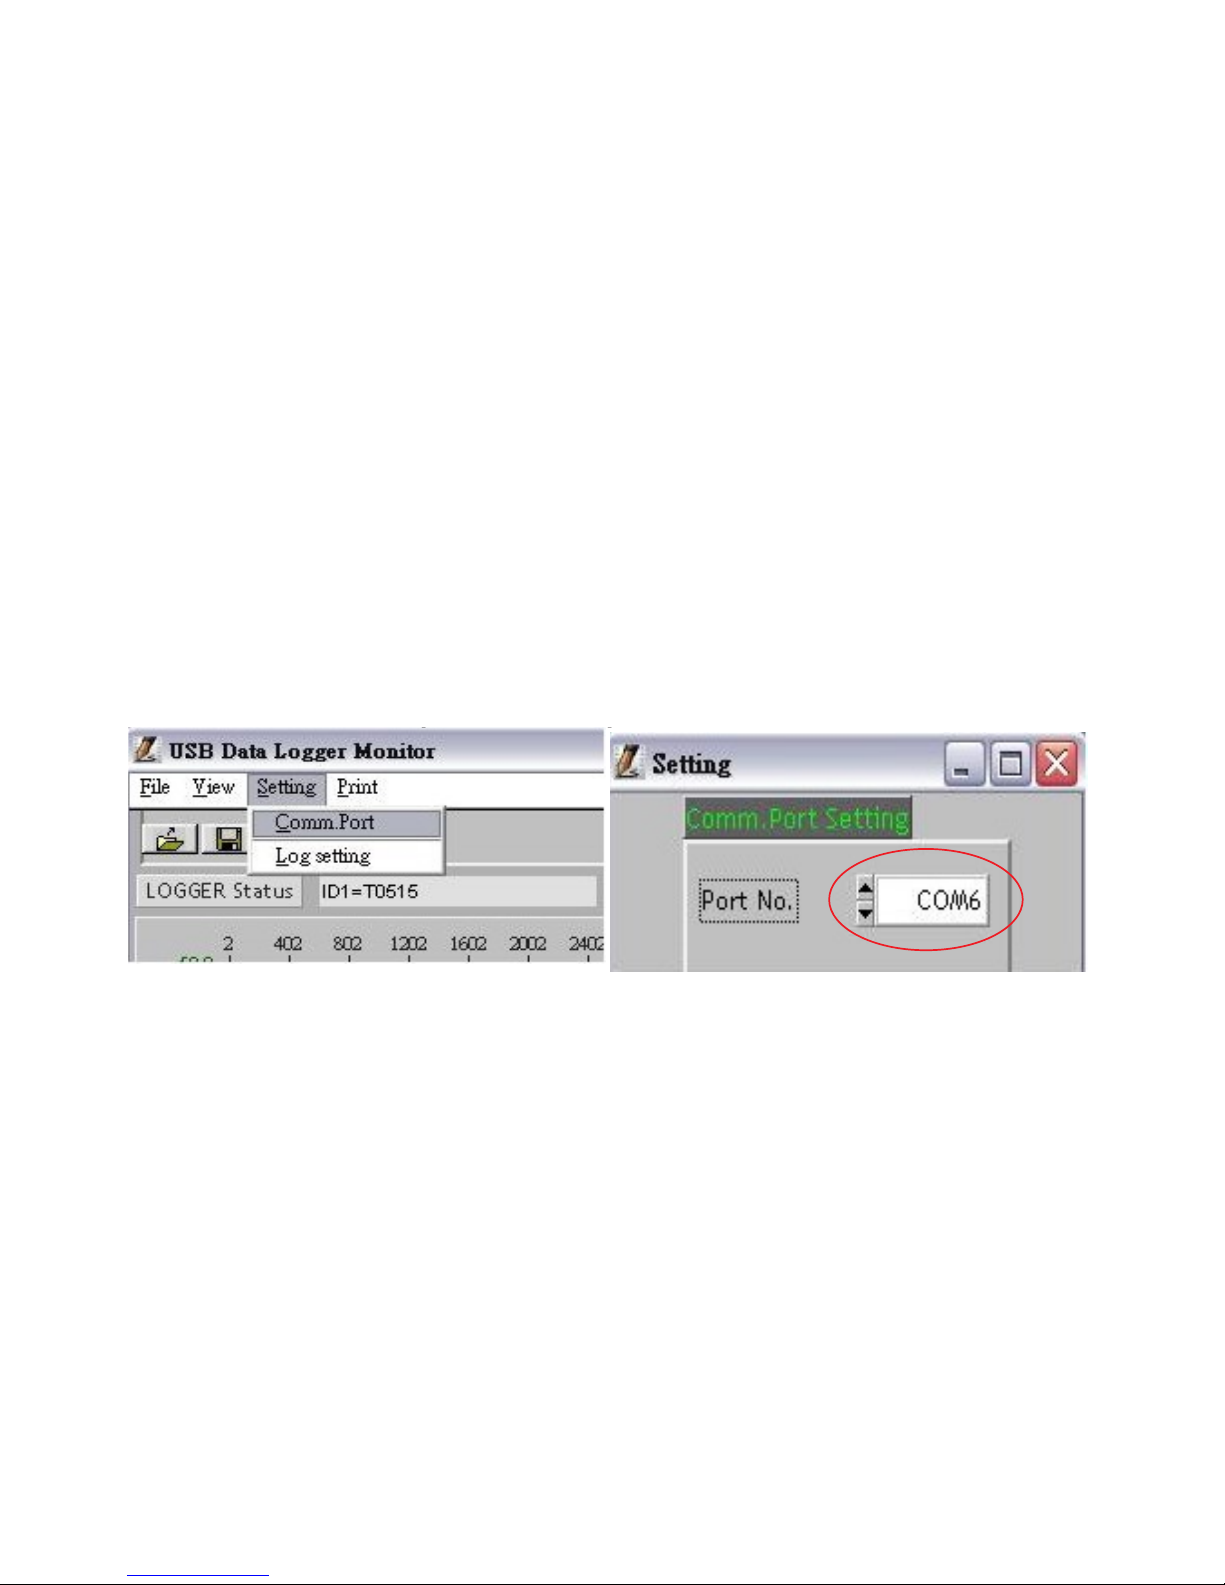
left-hand side of the USB Data Logger Monitor screen.
“Comm. Port” and “Log Setting” options appear in a
drop-down menu.
Communication (Comm.) Port Setting
1. Select “Comm. Port” from the Setting options.
The Comm. Port Setting Menu display opens in
a new window.
2. Select the correct port number. Click “OK” to nish.
Logger Setting:
BASIC:(Pic.3)
1:ID setting
Maximum 20 characters , name your logger press OK button
to confirm.
2:Current Date/Time
Clock setting, the system automatically shows current date and
time of your pc. Press OK to confirm.
(Note :Schedule date & time refer to current pc date and time)
►Please click OK to sync the meter’s date and time every time.
3 LCD display set : (N/A for non-LCD models)
Press ON ( Logger LCD still illuminated after complete
recording ), or OFF( LCD is not illuminated after complete
recording. Press OK after selection.
ALARM&SENSOR:(Pic.4)
1.Select Temp./Humidity alarm, set Hi/Lo Temp. and H/Lo
Humidity values.
(Red LED will flash if the current reading is over the setting.)
2.Select the parameter you want to record.
Example: Total is 16K memory, if choose Temp. and RH sensors
at the same time, memory store will split to 8K for Temp.+8K for
RH.
(Pic.4)
(Pic.3)
2. Remember the Comm port number and go back to software.
3.Click “Setting” ”Comm port “ select the port number as you
see from step 1, then press OK button.
NOTE:
If software message box show as pic2.Follow the next steps.
1.click “My computer””Content” in hardware content,click “Device manager” to
find the listed (COMx) listed under Ports(COM & LPT as below with red line.If
you may Prolific USB-to-Serial Comm. Port , it means the logger is connected to
computer properly.

11
Troubleshooting the Communication Port Setting
If the software does not recognize that the logger is plugged
into the USB port you should verify that the communications
port number is correct.
Note…
The port information is found on the computer under “Device
Manager.” However, depending upon your version of
Windows, the intial steps below to access “Device Manager”
may dier slightly.
1. Open the “Start Menu” on the computer.
2. Select “Control Panel.”
3. Select “Hardware and Sound.”
4. Select “Device Manager.”
5. Double click on the “Ports” option.
6. The correct port will list “Prolic USB-to-Serial
Comm Port” followed by the communication port
number in parentheses. Select this port number in the
Settings Options.

12
Basic Logger Setting
The basic menu allows you to designate a name for your
logger and specify the current date and time.
1. Select “Log Setting” from the
etting options. The Logger
Setting menu appears.
2. Select the “Basic” tab.
3. Enter a name for your logger,
consisting of up to 20 characters.
4. Select “OK” to save your entry.
5. The system will automatically
show the current computer date
and time. Select “OK” to save
your entry and sync the meter’s
current date and time.
Logger Alarm and Sensor Setting
This menu allows you to set minimum and maximum values
for temperature and humidity. If a reading is outside these
parameters, the red LED will ash a warning.
1. Select “Log Setting” from the Setting options.
The Logger Setting menu appears.
2. Select the “Alarm & Sensor” tab.
Logger Setting:
BASIC:(Pic.3)
1:ID setting
Maximum 20 characters , name your logger press OK button
to confirm.
2:Current Date/Time
Clock setting, the system automatically shows current date and
time of your pc. Press OK to confirm.
(Note :Schedule date & time refer to current pc date and time)
►Please click OK to sync the meter’s date and time every time.
3 LCD display set : (N/A for non-LCD models)
Press ON ( Logger LCD still illuminated after complete
recording ), or OFF( LCD is not illuminated after complete
recording. Press OK after selection.
ALARM&SENSOR:(Pic.4)
1.Select Temp./Humidity alarm, set Hi/Lo Temp. and H/Lo
Humidity values.
(Red LED will flash if the current reading is over the setting.)
2.Select the parameter you want to record.
Example: Total is 16K memory, if choose Temp. and RH sensors
at the same time, memory store will split to 8K for Temp.+8K for
RH.
(Pic.4)
(Pic.3)
2. Remember the Comm port number and go back to software.
3.Click “Setting” ”Comm port “ select the port number as you
see from step 1, then press OK button.
NOTE:
If software message box show as pic2.Follow the next steps.
1.click “My computer””Content” in hardware content,click “Device manager” to
find the listed (COMx) listed under Ports(COM & LPT as below with red line.If
you may Prolific USB-to-Serial Comm. Port , it means the logger is connected to
computer properly.

13
3. Use the mouse to select the alarms you want to set.
Once you have selected the desired alarm(s), specify the
desired values using the ▲ or ▼ indicators.
4. Select the parameters you wish to record. The meter can
take readings for temperature, humidity, dew point, and
wet bulb.
Note…
The meter has a 16K memory capacity. If you chose
multiple parameters, the amount of memory will be divided
evenly between each choice. For example, if you select both
temperature and relative humidity, there will be 8K of data
storage available for each parameter.
Logger Sampling Setting
1. Select “Log Setting” from the
Setting options. The Logger
Setting menu appears.
2. Select the “Setting” tab.
3. The meter sampling range is
1 second to 6:59:59. Adjust the
▲ or ▼ indicators to specify the
sampling rate in hours, minutes,
and seconds.
4. Adjust the ▲ or ▼ indicators to
select Immediate, Real-Time, Key
Start, Roll Over, or Schedule start mode.
Logger Setting:
BASIC:(Pic.3)
1:ID setting
Maximum 20 characters , name your logger press OK button
to confirm.
2:Current Date/Time
Clock setting, the system automatically shows current date and
time of your pc. Press OK to confirm.
(Note :Schedule date & time refer to current pc date and time)
►Please click OK to sync the meter’s date and time every time.
3 LCD display set : (N/A for non-LCD models)
Press ON ( Logger LCD still illuminated after complete
recording ), or OFF( LCD is not illuminated after complete
recording. Press OK after selection.
ALARM&SENSOR:(Pic.4)
1.Select Temp./Humidity alarm, set Hi/Lo Temp. and H/Lo
Humidity values.
(Red LED will flash if the current reading is over the setting.)
2.Select the parameter you want to record.
Example: Total is 16K memory, if choose Temp. and RH sensors
at the same time, memory store will split to 8K for Temp.+8K for
RH.
(Pic.4)
(Pic.3)
2. Remember the Comm port number and go back to software.
3.Click “Setting” ”Comm port “ select the port number as you
see from step 1, then press OK button.
NOTE:
If software message box show as pic2.Follow the next steps.
1.click “My computer””Content” in hardware content,click “Device manager” to
find the listed (COMx) listed under Ports(COM & LPT as below with red line.If
you may Prolific USB-to-Serial Comm. Port , it means the logger is connected to
computer properly.

14
Setting Immediate Start Mode
This option will cause the meter to begin taking readings as
soon as the option is conrmed. Reading will continue if the
meter is detached from the USB port.
1. Adjust the ▲ or ▼ indicators
to specify the number of
sample points, in thousands,
from 1000 to 32,000.
2. Adjust the ▲ or ▼ indicators to
toggle between units:
°C or °F.
3. Select “Ok” to save the settings
and exit the menu,
or “Cancel” to exit without
saving the new settings.
Real-time start mode:
Key-start mode:
Press
NOTE:
The button is designed for not easy to touch , users have to use a sharp pin to touch
(If you set up start mode as “BUTTON”) ,to prevent carelessly touch to start or stop
the recording.
After set up “key start” as start mode, remove the logger from USB port.
Use a sharp pin to push the middle of gray button, until you hear a “ click sound “,
the LED will flash to start recording.
1. Select start mode at “Key-start”, remove datalogger from pc.
2. Use a sharp pin to touch the grey button, start logging.
3. Datalogger stop recording after memory is full.
Schedule start mode:
Select the date and time meter will start recording.
Please follow the date and time form (M/D/Y,H:M:S)
SETTING:(Pic.5)
1: Set sample point (K=1,000 multiple basis within total
memory points)
2.Set sample rate, start mode to record:
Select “second(0~59)” time interval.“hour(1~6), “minute(0~59)”,
Select 5 start modes from:
Immediately
Schedule
Real-time (PC is always connected with the logger unit)
Key start (Start recording by pressing button)
(when memory are full, logger covers the Roll-over
earliest memory automatically)
3.Select Unit : Select Temperature unit °C/°F,press
OK to confirm.
(Pic.5)
2.In real-time mode, it shows “STOP” button instead of “DOWNLOAD”
at the right corner. Press “STOP” to stop real-time recording. Then button will
change into “DOWNLOAD”. Press “DOWNLOAD”for downloading data.
►Before exit software data has to be downloaded
1.After set start mode at real-time,datalogger starts login records. When logger
records, the green fan at left corner shows it is under recording.(Meter should
be connected with pc all the time,under this mode.)

15
Setting Real-Time Start Mode
This option is used with the datalogger connected to the
computer, through the USB port.
Note…
The meter may not be disconnected from the computer
during real-time sampling.
1. Adjust the ▲ or ▼ indicators to specify the number
of sample points, in thousands, from 1000 to 32,000.
2. Adjust the ▲ or ▼ indicators to toggle between
units: °C or °F.
3. Select “Ok” to save the settings and exit the menu,
or “Cancel” to exit without saving the new settings.
Setting Key Start Mode
This option allows you to take readings without having the
datalogger connected to a computer. Measurement will
not begin until the grey button is pressed.
1. Adjust the ▲ or ▼ indicators to specify the number
of sample points, in thousands, from 1000 to 32,000.
2. Adjust the ▲ or ▼ indicators to toggle between
units: °C or °F.
3. Select “Ok” to save the settings and exit the menu,
or “Cancel” to exit without saving the new settings.

16
Setting Roll Over Mode
This option allows for continued recording even when
the meter is full. After the data limit has been reached,
new readings will be recorded over the earliest
previous records.
1. Adjust the ▲ or ▼ indicators to specify the number of
sample points, in thousands, from 1000 to 32,000.
2. Adjust the ▲ or ▼ indicators to toggle between units:
°C or °F.
3. Select “Ok” to save the settings and exit the menu, or
“Cancel” to exit without saving the new settings.
Setting Schedule Mode
This option allows you to pre-set the date and time that
the meter will automatically begin recording.
Note…
The date and time formats must be Month/Day/Year
and H:M:S.
1. Adjust the ▲ or ▼ indicators to specify the number
of sample points, in thousands, from 1000 to 32,000.
2. Adjust the ▲ or ▼ indicators to toggle between
units: °C or °F.

17
3. The elds for the start date and time and the stop
date and time will be automatically populated with default
values. Click on any of these elds and use
the computer keyboard to make changes as desired.
4. Select “Ok” to save the settings and exit the menu, or
“Cancel” to exit without saving the new settings.
DATA SAMPLING AND RECORDING
Sampling and Recording in Immediate Mode
1. The green LED will ash to indicate that the logger is
recording data.
2. Remove the datalogger from the computer as desired.
Recording will continue.
3. The datalogger will record up to 32,000 data points. Once
the memory is full, recording will stop.

18
Sampling and Recording in Real-Time Mode
1. Recording will begin automatically as soon as the setting is
conrmed. A green indicator at the lower left of the screen
will ash and the readings will appear on the display.
2. Press “Stop” to nish recording.
3. Click the “Save” button (oppy disc icon) to save the data.
4. Enter a unique name for the le.
5. Select “OK” to conrm. “Save le completed” displays.
Real-time start mode:
Key-start mode:
Press
NOTE:
The button is designed for not easy to touch , users have to use a sharp pin to touch
(If you set up start mode as “BUTTON”) ,to prevent carelessly touch to start or stop
the recording.
After set up “key start” as start mode, remove the logger from USB port.
Use a sharp pin to push the middle of gray button, until you hear a “ click sound “,
the LED will flash to start recording.
1. Select start mode at “Key-start”, remove datalogger from pc.
2. Use a sharp pin to touch the grey button, start logging.
3. Datalogger stop recording after memory is full.
Schedule start mode:
Select the date and time meter will start recording.
Please follow the date and time form (M/D/Y,H:M:S)
SETTING:(Pic.5)
1: Set sample point (K=1,000 multiple basis within total
memory points)
2.Set sample rate, start mode to record:
Select “second(0~59)” time interval.“hour(1~6), “minute(0~59)”,
Select 5 start modes from:
Immediately
Schedule
Real-time (PC is always connected with the logger unit)
Key start (Start recording by pressing button)
(when memory are full, logger covers the Roll-over
earliest memory automatically)
3.Select Unit : Select Temperature unit °C/°F,press
OK to confirm.
(Pic.5)
2.In real-time mode, it shows “STOP” button instead of “DOWNLOAD”
at the right corner. Press “STOP” to stop real-time recording. Then button will
change into “DOWNLOAD”. Press “DOWNLOAD”for downloading data.
►Before exit software data has to be downloaded
1.After set start mode at real-time,datalogger starts login records. When logger
records, the green fan at left corner shows it is under recording.(Meter should
be connected with pc all the time,under this mode.)
STOP
Sampling and Recording in Key Start Mode
1. Remove the datalogger from the computer.
2. Press the grey button to begin logging data. You will hear
a click when the button is pressed and the green LED will
ash to indicate that the logger is recording data.
Note…
The grey on/o button requires a rm touch. This ensures
that it will not accidently stop (or start) recording.
3. The datalogger will record up to 32,000 data points.
Once the memory is full, recording will stop.

19
Sampling and Recording in Roll Over Mode
1. The green LED will ash to indicate that the logger is
recording data.
2. Remove the datalogger from the computer as desired.
Recording will continue.
3. The datalogger will record up to 32,000 data points.
When the memory is full, the meter will continue
recording over the oldest records.
Sampling and Recording in Schedule Mode
1. At the scheduled start date and time, the green LED
will ash to indicate that the logger is recording data.
2. Remove the datalogger from the computer as desired.
Recording will continue.
3. The datalogger will record up to 32,000 data points.
Once the scheduled stop date and time are reached,
recording will stop.

20
DOWNLOADING DATA
1. If the datalogger is not currently connected to the
computer, insert the USB drive into the USB port.
2. Click the “LOGGER Status” button to stop recording.
The datalogger ID, number of records sampled, and
the sampling parameters and rate will display.
Save data:
Press SAVE button to save txt.file.
View Data Table :
Press View button to get data table with details.(pic.6)
(pic.6)
Print graph:
Press PRINT button and print graph. Follow the print setting below to print full
screen graph. Press OK to print pdf file.(pic.7)
Print Table Data:
Press table data, the screen shows the record range, enter the start number
to the end number (For example: 1~500 or 200~1000...or leave it blank for
printing all data ).(pic.8)
Save each pdf. files with different names.
(pic.7)
√
√
(pic.8)
P7
Retrieve file:
Press RETRIEVE FILE button to select file and
show the graph.
Roll-over mode:
Select the mode to record when the data is full, it will cover the earliest memory.
After download the data , long press grey button to record without reset up each
parameter and selection.
LOGGER Status:
Before download data, press to show ID, Records, Sample rate, LOGGER status
Unit.
NOTE: Once button is pressed, recording is inactivated.Download
Logger function:
Download data:
Press DOWNLOAD button, data download in few seconds. Graph shows
automatically
NOTE: Please do not press DOWNLOAD button if you won’t stop record.
You can press LOGGER STATUS button to see record points.
3. Click the “Download” button to download the data.
A graph of the data will appear after the data has
nished downloading.
Viewing the Graph
Note…
To display specic values for any data point, use the
mouse to move the red cursor (located on the red vertical
line) to the desired point on the graph.
• To zoom in: Hold CTRL and click the left mouse button.
• To zoom out: Hold CTRL and click the right mouse button.
• To move the graph: Hold CTRL and Shift and then
click and hold the left mouse button. Use the cursor to
move the graph.
Table of contents
Other Sper scientific Test Equipment manuals
Popular Test Equipment manuals by other brands

multicomp pro
multicomp pro MP720780 quick guide

Keysight Technologies
Keysight Technologies M8000 Series user guide

Sperry instrument
Sperry instrument CT6101 operating instructions

Agilent Technologies
Agilent Technologies E5022B Programming manual

PeakTech
PeakTech 1200 Operation manual

sauter
sauter HN-D instruction manual

Agilent Technologies
Agilent Technologies N9360A Programming manual

JONARD TOOLS
JONARD TOOLS TEP-200 instruction manual

Agilent Technologies
Agilent Technologies Medalist x6000 Operator instructions

Hioki
Hioki 3237 instruction manual

ProsKit
ProsKit NT-309 Operation manual

Hanna Instruments
Hanna Instruments HI719 instruction manual