SSI CS8900 User manual
Surface Systems & Instruments, Inc.
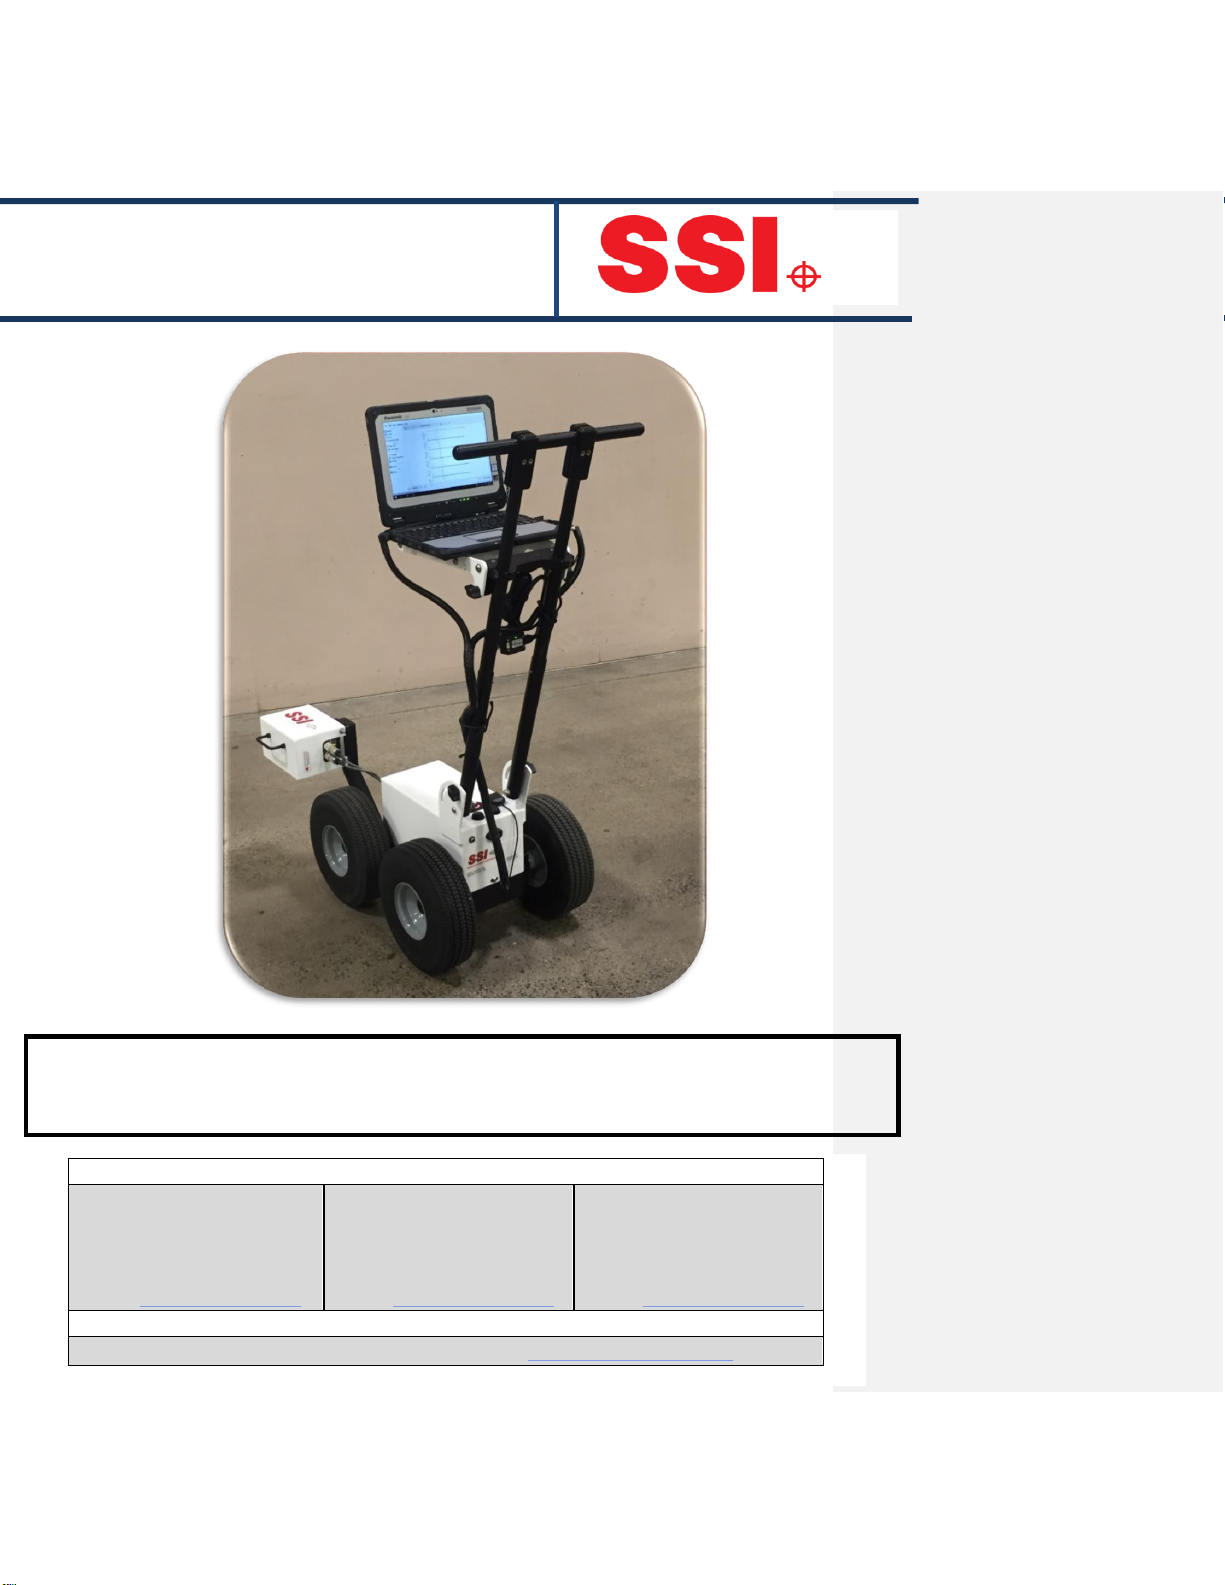
CS8900 Sidewalk Surface Profiler
Version 3.2.0.1.
SSI Locations
Hardware Design & Fabrication
1845 Industrial Drive
Auburn, CA 95603
Tel: (530) 885-1482
Fax: (530) 885-0593
Email: [email protected]om
Sales & Administration
P.O. Box 790
Larkspur, CA 94977
Tel: (415) 383-0570
Fax: (415) 358-4340
Email: [email protected]
Electronics & Software
307 Plymate Lane
Manhattan, Kansas 66502
Tel: (785) 539-6305
Fax: (415) 358-4340
Email: [email protected]om
Customer Support
•Contact any SSI Location (see above) •Email: suppor[email protected]

Table of Contents
Definitions for the SSI Sidewalk Profiler..................................................... 6
Ride Index Number ................................................................................................................................. 6
Bump and Defects................................................................................................................................... 6
Scallop ..................................................................................................................................................... 6
IRI6
IRI Defects ............................................................................................................................................... 6
Profilograph Defects ............................................................................................................................... 6
PRI ........................................................................................................................................................... 6
Point Events ............................................................................................................................................ 7
Segment Events....................................................................................................................................... 7
Odometer................................................................................................................................................ 7
Pause....................................................................................................................................................... 7
Profile Collection..................................................................................................................................... 7
Interval Collection ................................................................................................................................... 7
Sidewalk Profiler Hardware...........................................................……………7
Calibration Procedures............................................................................... 4
Height Calibration ................................................................................................................................... 4
Distance Calibration ................................................................................................................................ 8
Closed Loop Calibration ........................................................................................................................ 10
Collection ................................................................................................. 18
Connecting Device ................................................................................................................................ 18
Hardware Found ................................................................................................................................... 18
Troubleshooting.................................................................................................................................... 18
Collect ...................................................................................................... 21
Collection Information .......................................................................................................................... 22
During Collection ..................................................................................... 23
File Name .............................................................................................................................................. 23
Add Notes (Input After Run) ................................................................................................................. 25
Interval Collections (Input After Run) ................................................................................................... 25
Event Templates ................................................................................................................................... 25

Event Keys ............................................................................................................................................. 26
Editing a Collection .................................................................................. 26
Finalizing a Collection............................................................................... 28
Saving the File ....................................................................................................................................... 28
Default Naming Convention.............................................................................................................. 28
Mapping................................................................................................... 28
Reports and Analysis................................................................................ 30
Sidewalk Parameters............................................................................................................................. 30
Mamimum Running Grade.................................................................................................................... 30
Running Grade Cutoff ........................................................................................................................... 30
Maximum Cross Slope........................................................................................................................... 31
Cross Slope Cutoff ................................................................................................................................. 31
Slope Range Interval ............................................................................................................................. 31
Minimum Length................................................................................................................................... 31
Level Changes........................................................................................................................................ 31
Cracks .................................................................................................................................................... 31
Minimum Length................................................................................................................................... 31
Exclude Interval Types ......................................................................................................................... 31
Minimum Length................................................................................................................................... 31
Texture .................................................................................................................................................. 31
Reports.................................................................................................................................................. 32
Sidewalk Report .............................................................................................................................. 337
Key Press Notes............................................................................................................................... 337
Single Trace ....................................................................................................................................... 34
Summary Report ............................................................................................................................... 34
Cross Slope Report ............................................................................................................................ 34
Print Options ..................................................................................................................................... 35
Trace ........................................................................................................ 35
Choosing Tracks for Plotting ................................................................................................................. 35
Refresh .................................................................................................................................................. 36

Plot Options Icon............................................................................................................................... 41
Profile/Continuous IRI................................................................................................................... 41
Exporting.................................................................................................. 39
Exporting to Sidewalk Format............................................................................................................... 39
Export Location ................................................................................................................................. 40
Exporting to ERD Format .................................................................................................................. 42
Station Extraction......................................................................................................................... 42
Filter Settings—High & low pass length............................................................................................ 47
Export Raw Data........................................................................................................................... 43
Match Tracks................................................................................................................................. 43
Ignore Pauses ................................................................................................................................ 43
Exporting to PPF Format ................................................................................................................... 44
Station Extraction......................................................................................................................... 44
Filter Settings—High & low pass length ...................................................................................... 44
Include Run up-Run out Data....................................................................................................... 45
Export Raw Data........................................................................................................................... 45
Exporting to PRO Format .................................................................................................................. 46
Exporting to Survey Format .............................................................................................................. 48
Station Extraction......................................................................................................................... 48
Filter Settings................................................................................................................................ 54
Profile Data Sampling Interval..................................................................................................... 54
Exporting to Excel Format................................................................................................................. 50
Export to Comma Delimited File.................................................................................................. 50
Export to Template....................................................................................................................... 51
Exporting GPX ................................................................................................................................... 54
Troubleshooting....................................................................................... 54

Table of Figures
FIGURE 1: THE CALIBRATION MENU WHICH APPEARS AFTER THE “CALIBRATE”ICON IS SELECTED. ................................................................4
FIGURE 2: SYSTEM ON A LEVEL SURFACE WITH THE POSITION OF THE WHEELS MARKED.. ..............................ERROR!BOOKMARK NOT DEFINED.
FIGURE 3: WINDOW INSTRUCTING THE OPERATOR TO PLACE PROFILER ON LEVEL GROUND AND SET BRAKE.. ..................................................5
FIGURE 4: BRAKE SET AND PROFILER IN PLACE BEFORE HITTING THE NEXT BUTTON......................................ERROR!BOOKMARK NOT DEFINED.
FIGURE 5: SYSTEM SET IN ITS FIRST PHASE POSITION WITH AXLE OF WHEELS LINED UP WITH MARKS..............................................................6
FIGURE 6: CALIBRATION WINDOW AFTER THE FIRST PHASE OF THE HEIGHT CALIBRATION..........................................................................13
FIGURE 7: POSITIONING FOR THE SECOND PHASE OF THE CALIBRATION...................................................................................................7
FIGURE 8: WINDOW AFTER A SUCCESSFUL CALIBRATION....................................................................................................................10
FIGURE 9: THE INITIAL WINDOW OF THE DISTANCE CALIBRATION FOR SETTING THE TRACK LENGTH. ..............................................................8
FIGURE 10: FRIST INSTRUCTIONS FOR DISTANCE CALIBRATION.. ..........................................................................................................12
FIGURE 11: WINDOW SHOWING THE DISTANCE CALIBRATION SUMMARY AFTER PUSHING PROFILER TO END OF TRACK.. ...................................9
FIGURE 12: WINDOW SHOWING THE TWO OPTIONS UNDER THE CLOSED LOOP CALIBRATION...................................................................24
FIGURE 13: FIRST WINDOW OF THE PROFILE SLOPE CALIBRATION.. .....................................................................................................24
FIGURE 14: CALIBRATION WINDOW WITH SYSTEM AT END OF TRACK....................................................................................................24
FIGURE 15: WINDOW INDICATING OPERATOR TO TURN SYSTEM AROUND AND ALIGN MAIN WHEELS WITH TRACK... ......................................24
FIGURE 16: CALIBRATION WINDOW INDICATING END OF RETURN CLOSE LOOP RUN.................................................................................24
FIGURE 17: CALIBRATION WINDOW CALCULATING RESULTS................................................................................................................24
FIGURE 18: WINDOW INDICATING COMPLETION OF PROFILE SLOPE CALIBRATION..................................................................................24
FIGURE 19: CLOSED LOOP CALIBRATION WINDOW WITH “CROSS SLOPE”SELECTED................................................................................24
FIGURE 20:FIRST WINDOW OF THE CROSS SLOPE CALIBRATION... ......................................................................................................24
FIGURE 21:CALIBRATION WINDOW WITH SYSTEM AT END OF TRACK....................................................................................................24
FIGURE 22: CALIBRATION WINDOW INDICATING OPERATOR TO TURN THE SYSTEM AROUND.. ...................................................................24
FIGURE 23: CALIBRATION WINDOW INDICATING END OF RETURN CLOSE LOOP RUN.................................................................................24
FIGURE 24: WINDOW INDICATING COMPLETION OF CROSS SLOPE CALIBRATION.. ..................................................................................24
FIGURE 25: THE COLLECT WINDOW..............................................................................................................................................24
FIGURE 26:THE ODOMETER OF PROFILER V3. ................................................................................................................................24
FIGURE 27:ODOMETER IN EVENT EDITING.....................................................................................................................................20
FIGURE 28:THE DIAGNOSTIC WINDOW ABOVE SHOWS A HEALTHY PROFILER SYSTEM.............................................................................20
FIGURE 29:THE GPS DETAILS .....................................................................................................................................................21
FIGURE 30:COLLECTION INFORMATION.........................................................................................................................................21
FIGURE 31:THE INITIAL VIEW OF A NEW COLLECTION. ......................................................................................................................23
FIGURE 32:ACOLLECTION WITHOUT EVENTS SELECT YET...................................................................................................................24
FIGURE 33:ACOLLECTION WITH A POINT EVENT AT 0+14.3 FEET. ......................................................................................................24
FIGURE 34:ACOLLECTION WITH A SEGMENT INTERVAL BEING PROFILED...............................................................................................25
FIGURE 35:EXAMPLE OF EVENT KEY CONFIGURATION......................................................................................................................26
FIGURE 36:THE DROP DOWN MENU FOR MAPPING SHOWN...............................................................................................................29
FIGURE 37:ABUMP IS SELECTED ABOUT TO BE NAVIGATED TO. ..........................................................................................................34
FIGURE 38:NAVIGATION IS STARTED.TO REACH THE POINT THE MACHINE MUST MOVE 429 FEET WEST. ...................................................30
FIGURE 39:THE SIDEWALK SETTINGS WINDOW ...............................................................................................................................32
FIGURE 40:THE TOP OF A SIDEWALK REPORT ..................................................................................................................................38
FIGURE 41: THE COLLECTION DATA INCLUDED IN A SIDEWALK REPORT..................................................................................................38
FIGURE 42: THE CROSS SLOPE REPORT DISPLAYING THE TRANSVERSE SLOPE DATA...................................................................................39
FIGURE 43: THE REPORT TOOLS....................................................................................................................................................39
FIGURE 44: AN EXAMPLE OF THE PROFILE TRACE WITHIN THE TRACE WINDOW.......................................................................................40
FIGURE 45: THE PLOT OPTIONS WINDOW.......................................................................................................................................41
FIGURE 46: THE DROP DOWN MENU OPTIONS OF PROFILE AND CONTINUOUS IRI ARE SHOWN ABOVE........................................................37
FIGURE 47: THE CONTINUOUS IRI PLOT OPTIONS WINDOW...............................................................................................................42
FIGURE 48: THE PLOT OF THE CONTINUOUS IRI TRACE......................................................................................................................39
FIGURE 49: THE PLOT OF THE PROFILE TRACE. ................................................................................................................................43
FIGURE 50:THE SIDEWALK EXPORT WINDOW..................................................................................................................................39
FIGURE 51: THE EXPORT WINDOW FOR EXPORTING THE DATA INTO ERD FORMAT..................................................................................40

FIGURE 52: THE EXPORT TYPE......................................................................................................................................................45
FIGURE 53:SELECTING A LOCATION TO SAVE THE EXPORTED FILE. .......................................................................................................41
FIGURE 54:THE EXPORT TYPE DROP DOWN MENU. ..........................................................................................................................46
FIGURE 55:THE ERD FORMAT EXPORT WINDOW WITH MATCH TRACKS SELECTED. .................................................................................42
FIGURE 56:AN ENLARGED VIEW OF THE ERD EXPORT WINDOW SETTINGS. ...........................................................................................43
FIGURE 57:THE PPF EXPORT WINDOW.THIS WINDOW HAS THE SAME SETTINGS AS THE ERD AND SURVEY FORMAT....................................44
FIGURE 58:AN ENLARGED VIEW OF THE OPTIONAL SETTINGS WHEN EXPORTING IN PPF FORMAT. .............................................................45
FIGURE 59:THE EXPORT WINDOW WHEN PRO FORMAT IS SELECTED...................................................................................................46
FIGURE 60:AN ENLARGED VIEW OF THE ENTIRE PRO EXPORT WINDOW...............................................................................................47
FIGURE 61:THE DETAILS TAB CONTAINS INFORMATION ABOUT THE PROJECT.........................................................................................48
FIGURE 62: EXPORTING IN SURVEY FORMAT WINDOW......................................................................................................................54
FIGURE 63:THE ENHANCED VIEW OF THE SURVEY FORMAT EXPORT WINDOW .......................................................................................54
FIGURE 64:EXPORTING THE DATA INTO MICROSOFT EXCEL FORMAT. ..................................................................................................50
FIGURE 65: AN EXAMPLE OF EXPORTING THE DATA INTO EXCEL...........................................................................................................51
FIGURE 66: THE TYPES OF EXCEL FORMATS ARE LISTED IN THE TEMPLATE DROP DOWN MENU. ..................................................................51
FIGURE 67: AN EXAMPLE OF THE IRI EXCEL TEMPLATE ......................................................................................................................52
FIGURE 68: AN EXAMPLE OF THE EXCEL PRI TEMPLATE ....................................................................................................................53

6
Definitions for the SSI Sidewalk Profiler
Ride Index Number
A ride index number is the result of an equation to generalize and relate all surfaces based on their
specific ride quality. Ride numbers can be in the form of Profile Ride Index (PRI) and the International
Roughness Index (IRI).
Bump and Defects
A bump or defect is a deviation over a standardized length, such as 25 feet. Bump detection simulates
the response of a straight edge on the physical surface. Bump height is the limit of this deviation.
Bump heights and lengths should be specified in the contract of the project.
Scallop
Scallops are the deviation of the profile from the center line of the profile’s moving average. The
scallops have a minimum height and width (longitudinal length), so that rapid increases of profile
height will not be counted towards the ride number. If an event does not meet the minimum
requirements to be a scallop, it can still be localized roughness.
IRI
The International Roughness Index was created by The World Bank to standardize the smoothness of
roads. IRI is based off of the quarter car simulation which replicates the ride quality of the road felt
by the user. The value of IRI is filtered through the quarter car simulation but the equation for IRI is
essentially:
IRI Defects (Localized Roughness)
Defects on the surface, sometimes referred to as “areas of localized roughness,” can be determined
through IRI. By changing the threshold of the IRI (in/mi, m/km) and the base length of the defect, the
Profiler software is able to find the locations of the defects. A defect location occurs when the
threshold is exceeded for the specified base length.
Profilograph Defects
Defects, bumps and dips can be found through the Profilograph defects option. This option is
dependent on the height and width of the bump or dip. With the two parameters of height and width
entered, a Profilograph straightedge simulation will determine the 25 foot sections of the profile that
exceed these parameters.
PRI
Profile Ride Index is the measure of the profile deviations from the centerline. By inputting
information such as the blanking band, minimum scallop height and width, and the scallop resolution
the PRI is calculated. The scallops are the individual deviations from the profile. If an event in the
profile does not exceed the minimum height or width for scallops, the event is not counted toward
the final PRI number. The PRI is dependent on the segment width for its calculations when a full

7
segment is collected. In this case the segment length will be the distance traveled in feet. The equation
for PRI is:
Point Events
Point events, also known as notes, are items or features at specific locations that the user wants to
store and identify within the data. Point notes can also be used to identify sections of the sidewalk
that do not meet specifications through the height or width requirements.
Segment Events
Segment events, also known as intervals, are interruptions or important structures that occupy
intervals of the sidewalk. Segment events include crosswalks, driveways, sections without sidewalks,
curb ramps, bus stops, and pauses which are related to the profile.
Odometer
The odometer can be found in two places within the SSI Profiler program, both under the collection
window. The initial odometer is on the home screen of the collection window. This odometer will be
in the form of a separate window. The second odometer aids the user in adding and editing events
after a collection is ended.
Pause
A pause is a section of the profile that can be excluded from the report or specifically viewed to
determine its profile ride number (IRI, PRI, etc.)
Profile Collection
When a data collection begins, the profiler will collect the profile of the sidewalk. Once the profile
collection is started, events can be entered in the form of point or segment events.
Interval Collection
An interval collection is the process of adding a segment event to the collection. To add a segment
event, select the ‘Start Interval’ icon during a collection. After the collection the user will be able to
apply a type of segment event and edit the stationing before saving the collection.
Sidewalk Profiler Hardware
Switches
The profiler has two switches located on the top of the electronics housing. One switch is for the
power of the profiler while the second switch is used to turn on the lights. When the profiler is turned
on, the battery meter will illuminate. The lights will only work if the profiler is turned on or charging.
Laser
The laser mounts to the front of the profiler body and is connected to the electronics via two cables.
Ensure there are no obstructions between the laser and the ground. When powered on and
connected to the electronics the “POWER” and “LASER” LEDs will illuminate though the “RANGE” LED
and beam on the ground will only be visible when collecting data.

8
Lights
The lights on the profiler are located at the front and rear of the electronics housing. To turn on the
lights, the profiler must be powered on or connected to the charger and the switch for the lights must
be on.
Battery Meter
The battery meter not only illustrates the amount of power left in the battery, but it also indicates
that the profiler is turned on.
Charging
To charge the profiler, connect the color coded charging terminals to the corresponding terminal color
on the back of the profiler, or if equipped, simply mate the charging plug to it’s receptacle. The LED
on the charger will turn red when there is a load on the circuit due to charging. The LED will become
green when charging is complete. In some cases the charger may need to be plugged into to 120v AC
before connecting to the profiler.
Adjusting the Right Wheel
The right wheel is adjusted by loosening the set screw at the top of the dovetail assembly. It is
important to not over-tighten the set screw because it may damage the nylon insert. The position of
the right wheel is crucial to the profiler’s stability. For optimum performance position the center of
the dovetail 5 inches from the rear of the electronics housing.
Tires and Pressure
Prior to collection inspect the tires to make sure they are aligned with each other. Most units are
equipped with foam tires. For pneumatic tires, the ideal tire pressure is listed on the side. For the 4-
ply tires the maximum pressure is 60 pound per square inch (psi).

9
Calibration Procedures
Height Calibration
To perform a height calibration, the walking profiler needs to be placed on a level surface. Mark the
locations of the fixed left side wheels on the ground and begin the calibration process.
Figure 1: The calibration menu which appears after the “Calibrate” icon is selected.
Figure 2: System on a level surface with the position of the wheels marked.

10
Proceed to press the Height Calibration button on the initial “Calibration” Menu.
Figure 3: The first window of the height calibration instructing the operator to place the
walking profiler on level ground and set the brake.
Figure 4: Brake set and profiler in place before hitting the next button.
11
With the brake set, line up the main wheel axels with the marks on the ground.
Press “Next” in the current calibration window.
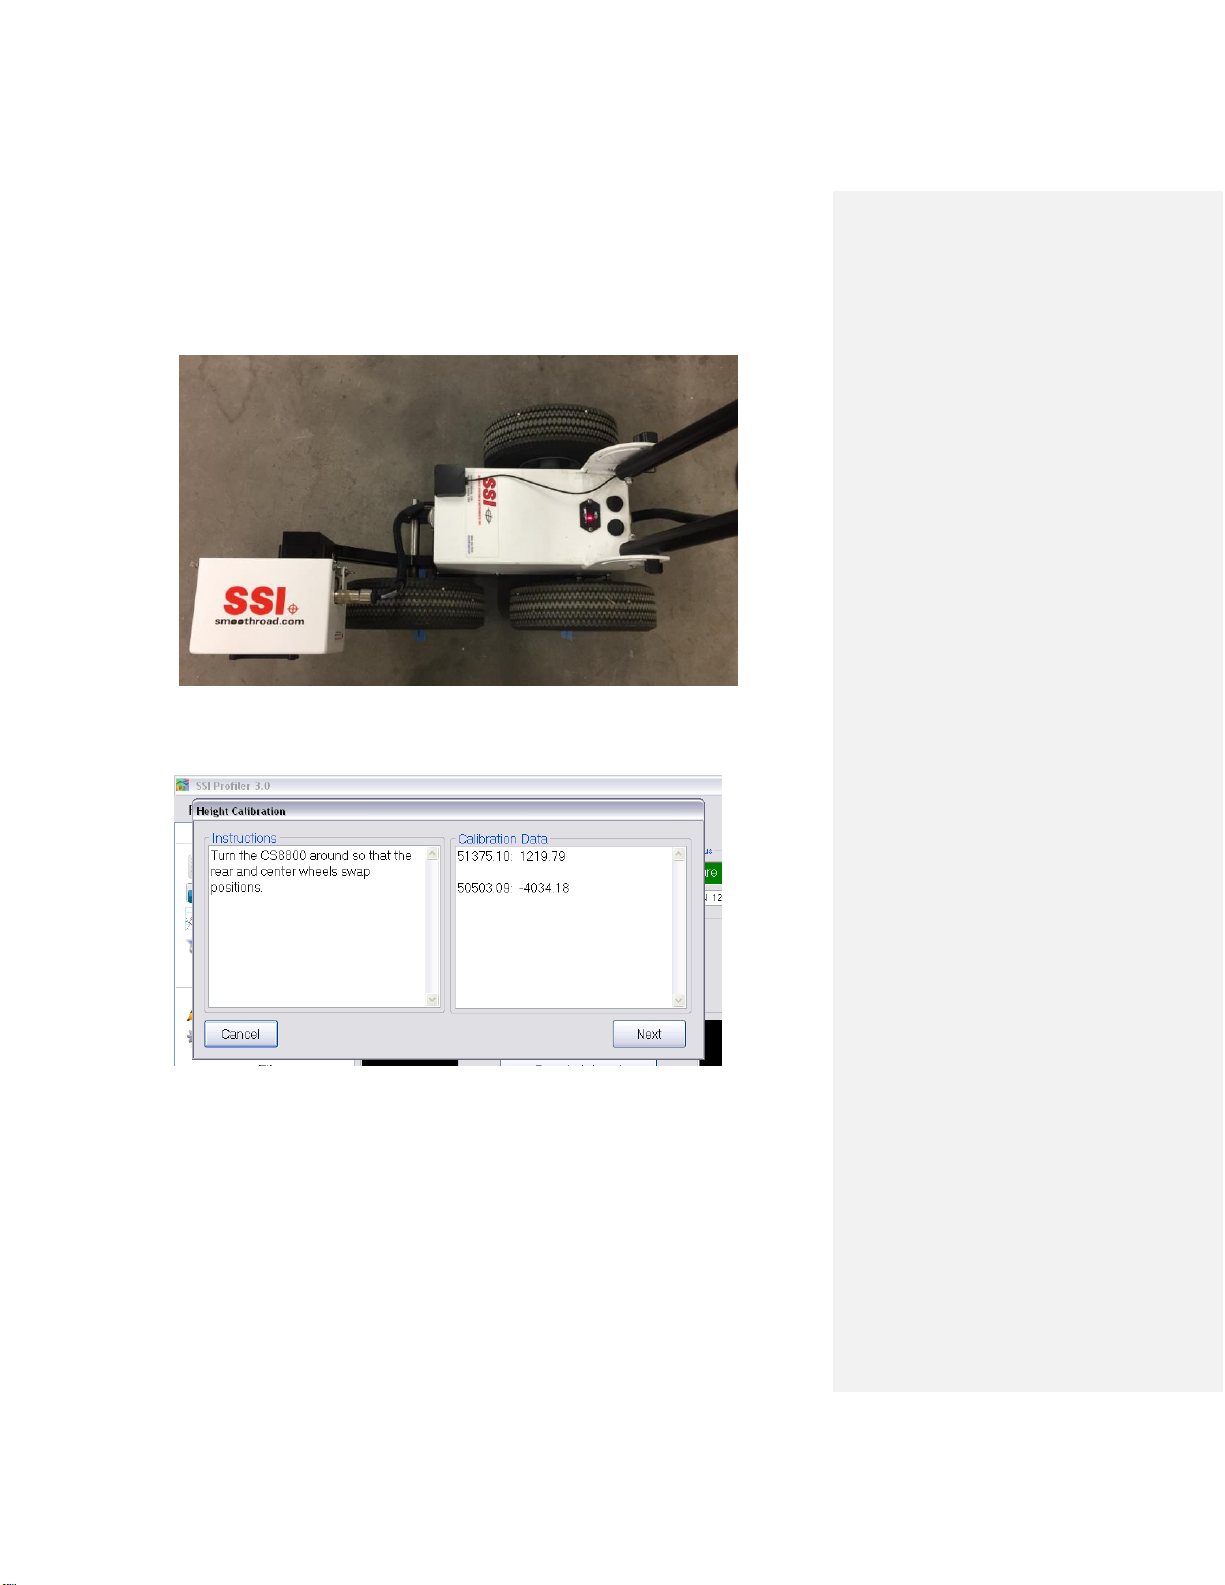
After the first phase of the height calibration the walking profiler must be turned around 180
degrees and have its left-side wheels swap positions. Each wheel should be over the exact spot
the other wheel was over in phase one. When the walking profiler is in position, select next.
Figure 6: Calibration window after the first phase of the height calibration.
Figure 5: System set in its first phase position with axle of wheels lined up with marks
12
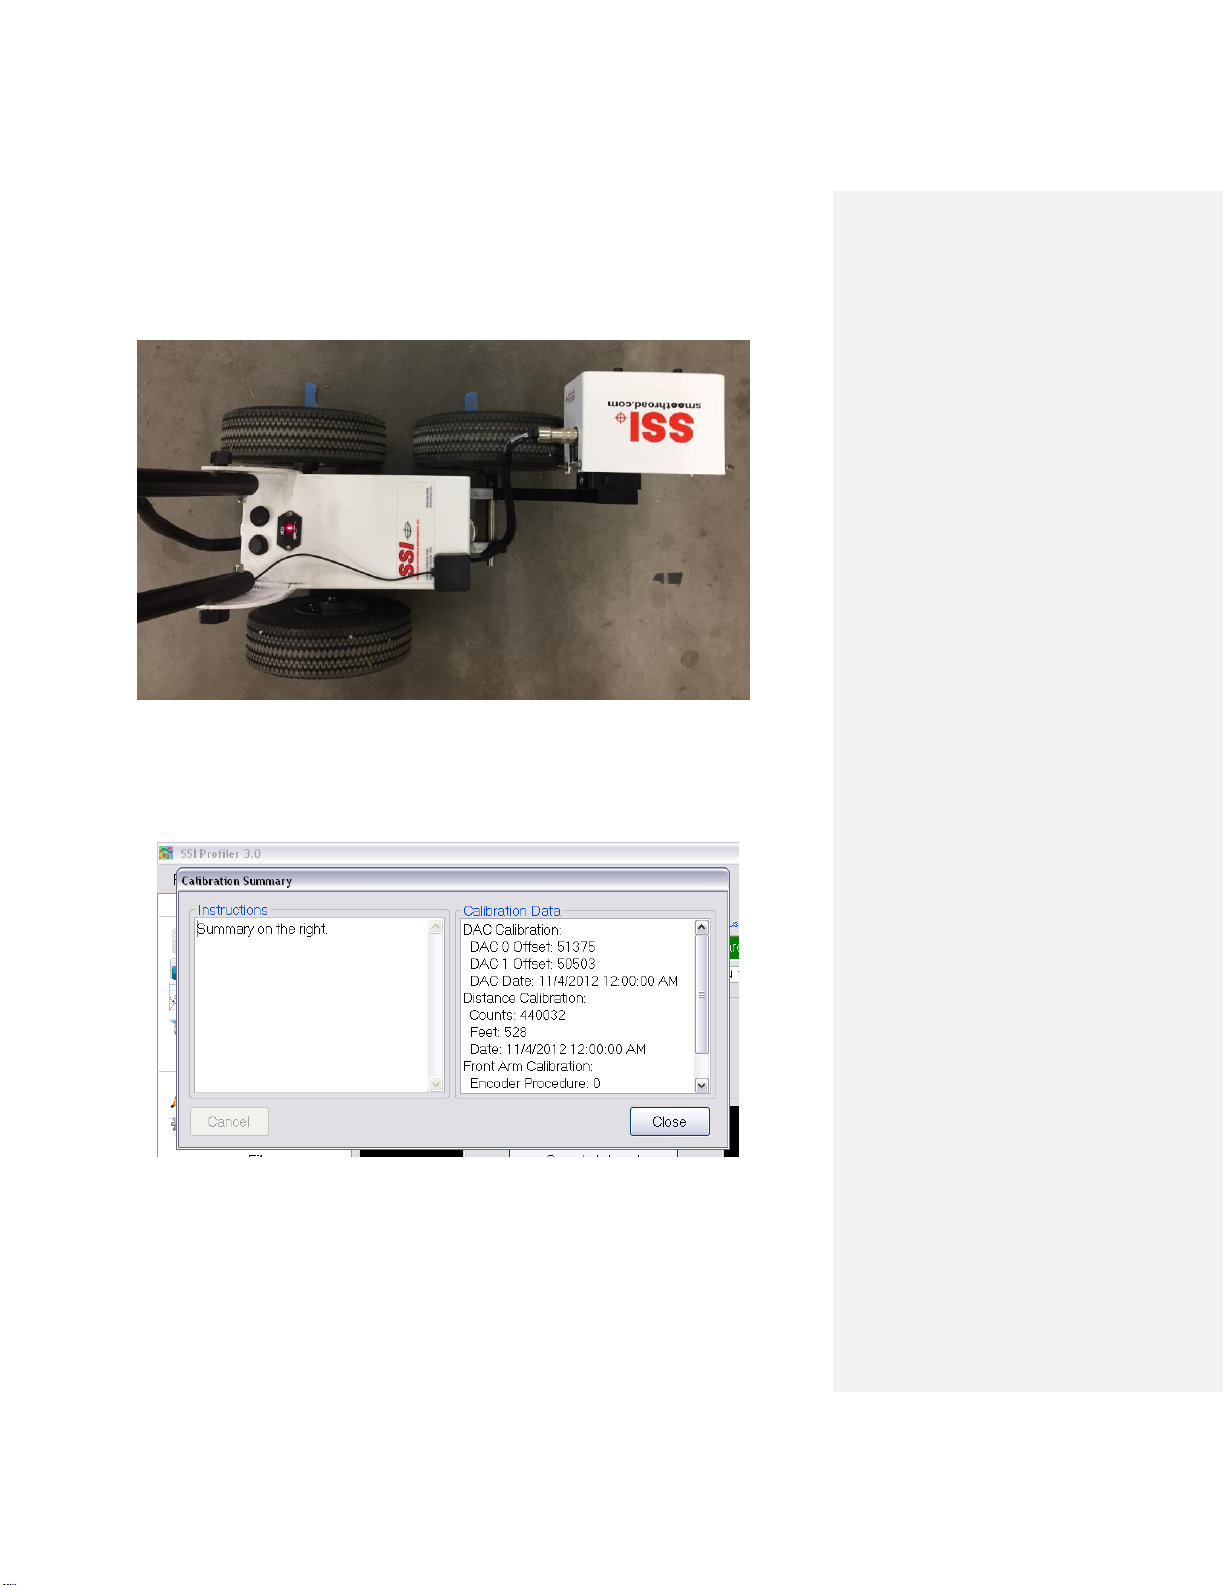
Press “Next” in the current calibration window.
Figure 8: Window after a successful calibration.
Figure 7: Positioning for the second phase of the calibration.
Figure 2: The device position for initial height calibration procedure.

13
Distance Calibration
Calibrate the distance readings of the walking profiler by measuring out 528 ft (160 meters) with a
rolling wheel measuring device. The calibration track should be as straight and level as possible. Once
the test track is prepared, start the calibration procedures through the Calibrate icon in the Collect
window. Select Distance Calibration and follow the steps precisely to complete a successful
calibration.
Set the length of the calibration track. The units can be changed by clicking on the feet (ft) symbol and
choosing the appropriate units. After the length of the track has been entered, select accept.
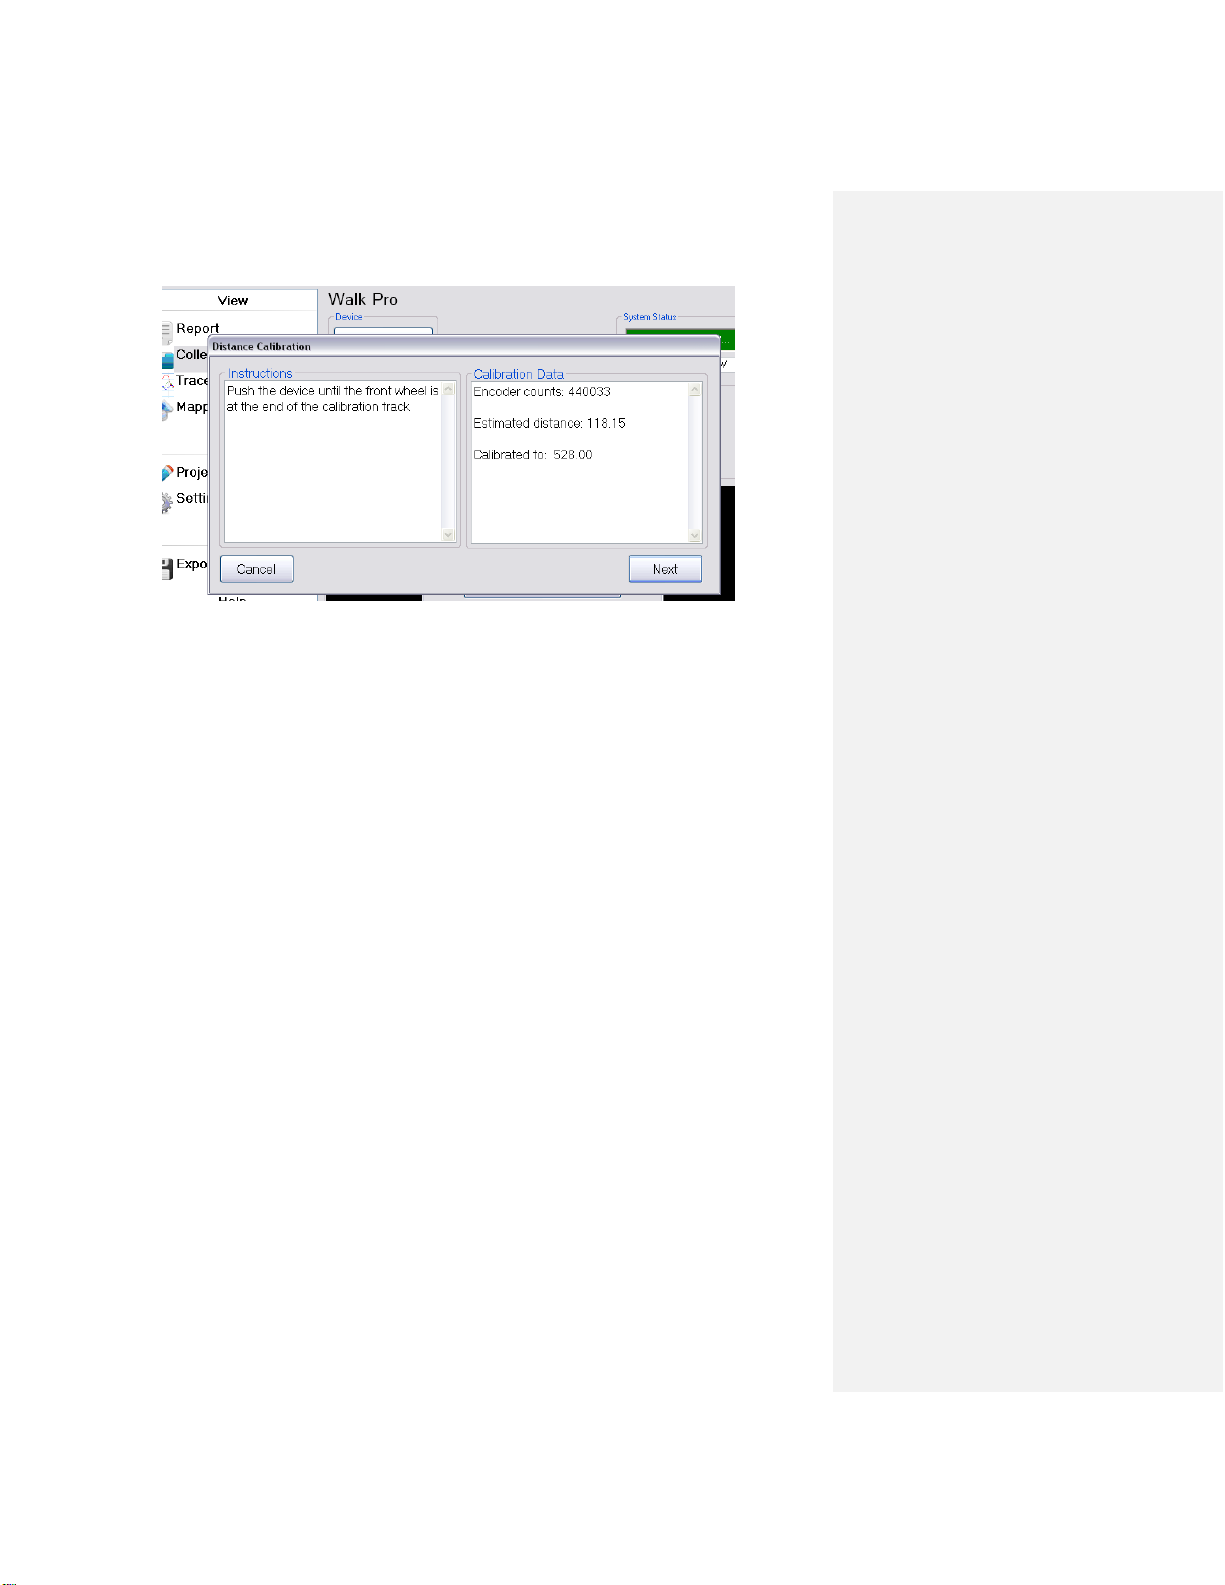
Once the walking profiler’s front wheel is on the beginning of the track, select next and push the
device until the front wheel is at the end of the calibration track as indicated in the collection window.
Figure 9: The initial window of the distance calibration for setting the track legth.
Figure 10: The instructions for the distance calibration are shown above.
14
Displayed are the number of encoder counts, the length of the track that was entered in the
previous window and the estimated distance traveled based on the last calibration.
If the estimated distance does not match the “Calibrated to” distance, it could be that the
system has never been calibrated, the last calibration was an improper, or the system had a
hardware/software update (None of which are a problem).
When the end of the track is reached, select next.
Figure 11: This window shows the distance calibration summary.
15
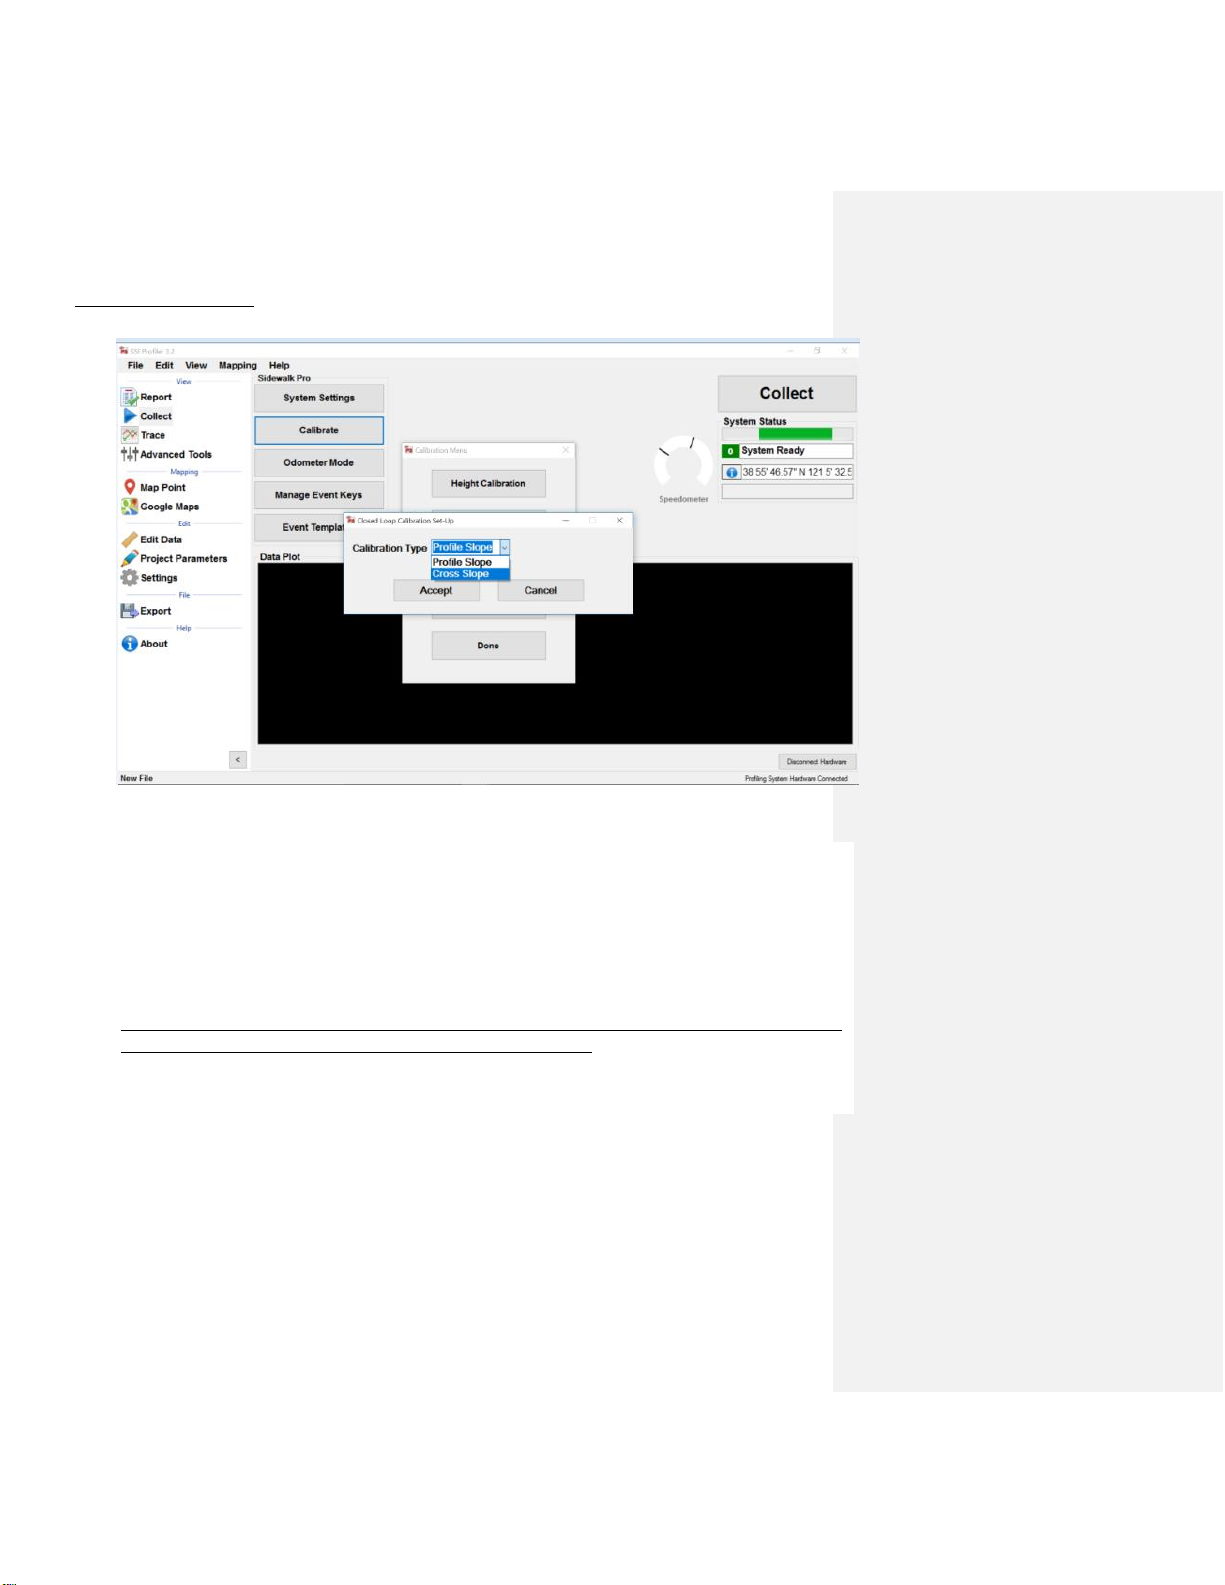
Closed Loop Calibration
Figure 12: Window showing the two options under the Closed Loop Calibration.
Both the Profile Slope and Cross Slope calibrations should be performed on a uniform surface
(ideally on a slab or an asphalt section). Do not start calibration with the wheels over a crack or
change level from slab to slab during calibration. When calibrating a new device, the height and
distance calibrations must be performed prior to either closed loop calibration.
The distance of the track should be between 10 and 30 feet (3 and 9 meters). This manual uses a
25ft (7.67m) segment for illustration.
Note: Base length (length from back wheel to laser) must be entered before calibrations can be
performed. This value typically ranges between 17 to 18 inches.

16
Profile Slope Calibration
Place system laser at start of track.
Figure 13: First window of the Profile Slope Calibration. The initial negative distance
indicates the length between the laser and back wheel. Proceed to push system to end of
track.
Figure 14: Calibration window with system at end of track. When the end of the
track is reached, select next.
17
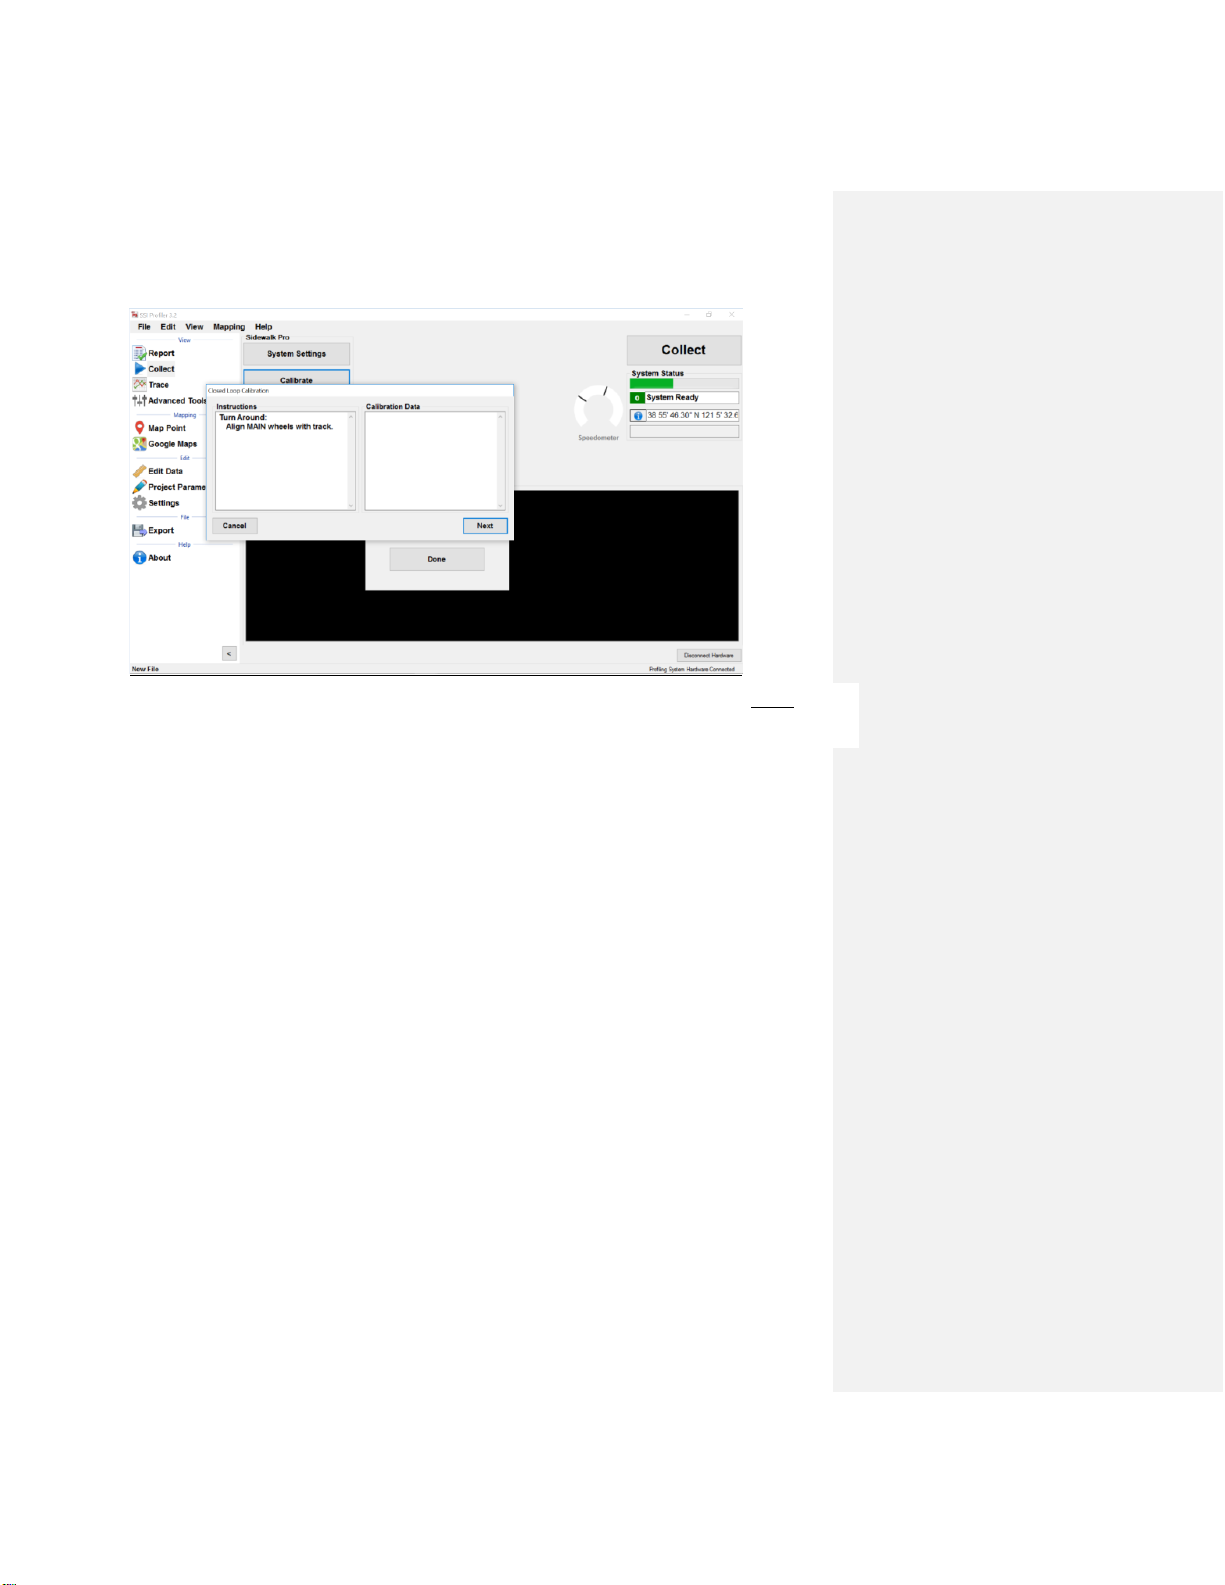
With the system facing the opposite direction and laser at the end of the track, where the back
wheel ended, push system back to initial starting point. The main wheels should go over the same
line. The distance traveled will be reversed. Stop when the onscreen “Current Distance” shows 0.00
feet.
Figure 15: Calibration window indicating operator to turn the system around, align the MAIN
wheels with the track, and press “Next”.

18
Figure 16: Calibration window indicating end of return close loop run. Press “Next”.
Figure 17. Calibration window calculating results.
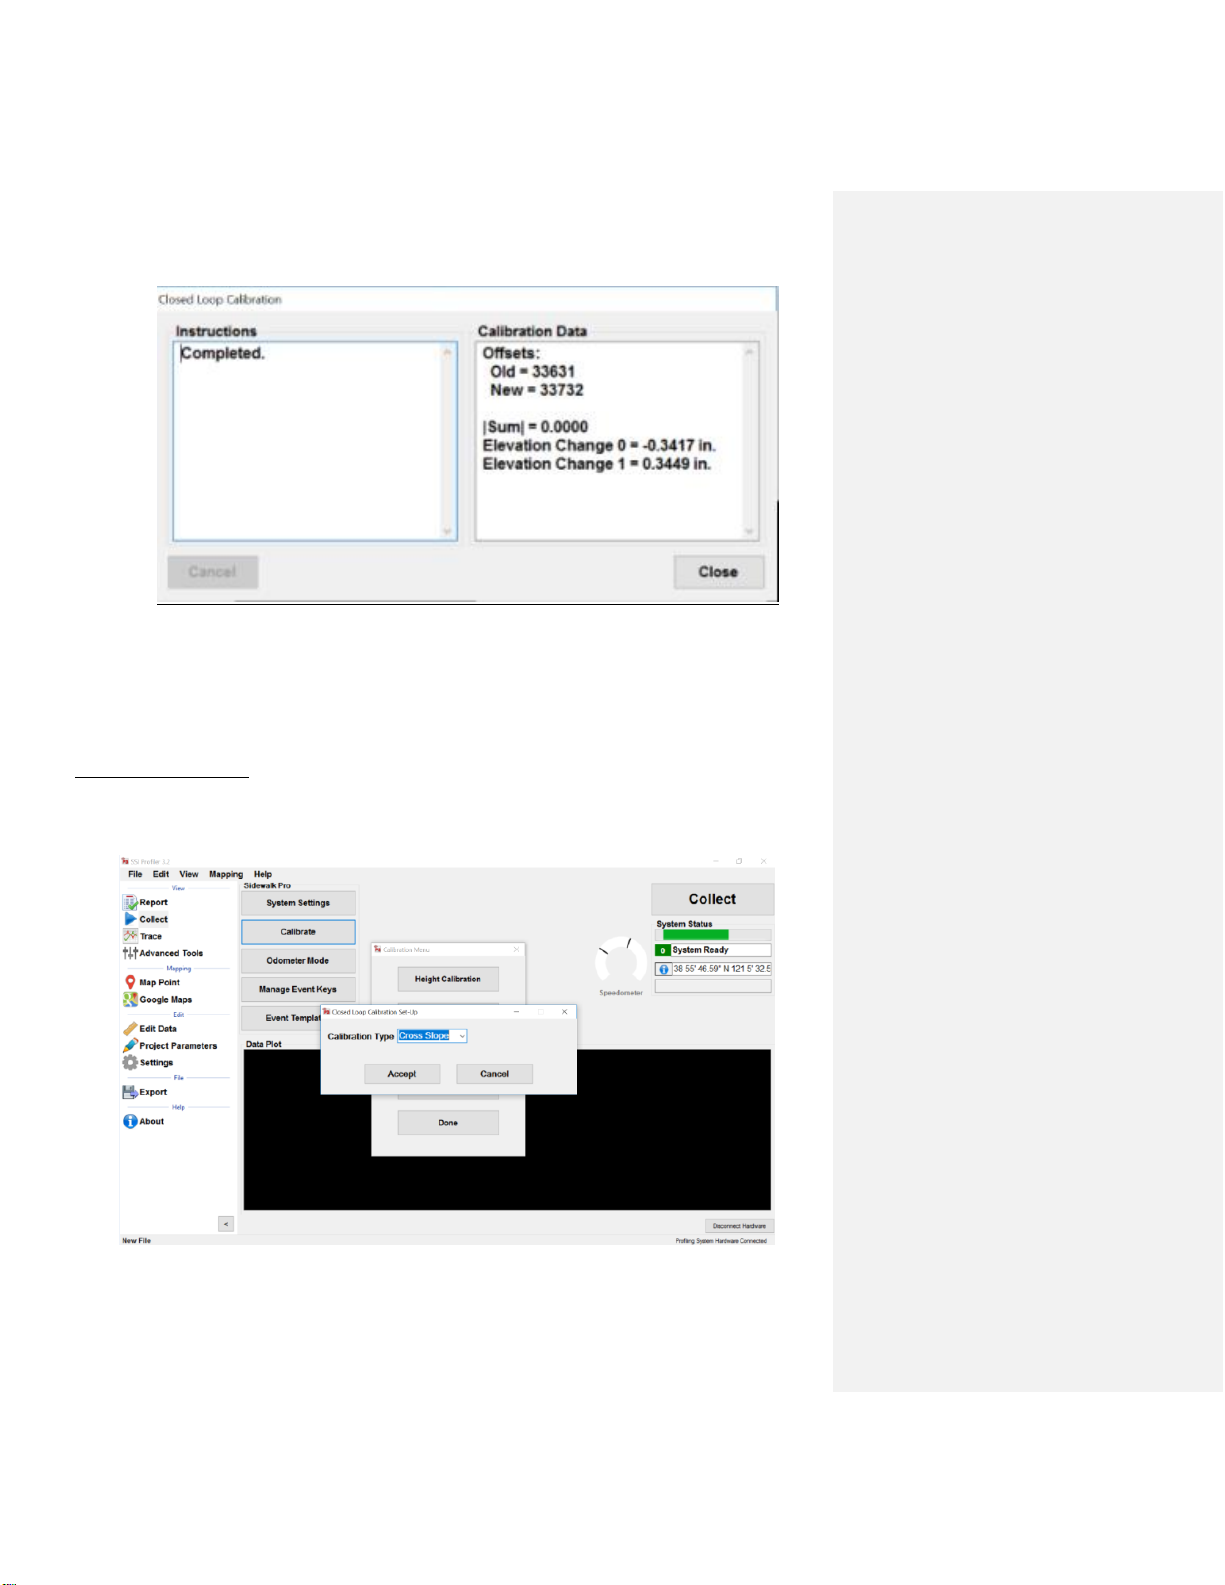
19
Cross Slope Calibration
Figure 18: Window indicating completion of Profile Slope Calibration.
Figure 19: Closed Loop Calibration window with “Cross Slope” selected.
Table of contents
Other SSI Test Equipment manuals

Popular Test Equipment manuals by other brands

Apera Instruments
Apera Instruments Premium Series user manual

Hopetech Electronics Technology
Hopetech Electronics Technology HP8000 Series user manual

Min
Min DS203 user manual

AND
AND BM Series instruction manual

Amptec Research
Amptec Research 630ES Operation & maintenance manual

Gilson
Gilson TS-1 operating manual


