BANGGOOD GS-320 User manual

GS-320
6G Vector Network
Analyzer device
User manual

CONTENT
1SUMMARY................................................................................................................................................... 1
1.1 introduction.......................................................................................................................................... 1
1.2 application............................................................................................................................................1
1.3 working conditions.............................................................................................................................. 1
2 DELIVERY LIST............................................................................................................................................1
3 SPECIFICATIONS......................................................................................................................................... 1
4 NOTICES........................................................................................................................................................2
5 COMPOSITION OF THE DEVICE...............................................................................................................3
5.1 The composition of the device is shown in Figure 5.1........................................................................3
5.2 The block of buttons for controlling the device is shown in Figure 5.2............................................. 3
6 TURNING ON/OFF....................................................................................................................................... 4
6.1 Turning on the device.......................................................................................................................... 4
6.2 Turning off the device..........................................................................................................................4
7 DEVICE SCREEN..........................................................................................................................................4
8 DEVICE MENU............................................................................................................................................. 7
8.1 Main menu........................................................................................................................................... 7
8.2 Frequency setting menu....................................................................................................................... 7
8.3 Plots menu settings displayed on the screen plots.............................................................................10
8.4 Markers menu.................................................................................................................................... 11
8.5 Device calibration menu.................................................................................................................... 16
8.6 Custom settings menu........................................................................................................................19
8.7 Device information............................................................................................................................ 20
8.8 Displaying the VSWR limit line........................................................................................................20

设备使用说明书
第1页 共 23 页
1SUMMARY
1.1 introduction
Portable 1-port 6G Vector Network Analyzer (hereafter the reflectometer, the device) are
designed to measure the matching characteristics of passive and active radio devices (antennas,
cables, filters, attenuators, amplifiers, etc.). The device allows you to measure the parameters of
the complex reflection coefficient, standing wave ratio (VSWR), impedance, admittance,
magnitude, phase, loss and distance to fault in the cable.
1.2 application
The device is intended for amateur radio use, as it is not a professional measuring instrument.
The presence of a built-in battery allows you to measure in laboratory and outside conditions.
1.3 working conditions
1) temperature:0℃~+40℃
2) humidity:0%~75%
2 DELIVERY LIST
Table 1
Name
Quantity
6G Vector Network Analyzer
1 pc
Connecting cable USB Type-C
1 pc
SOL Calibrator
1 pc
N/SMA-KJ
1 pc
Touch pen
1 pc
3 SPECIFICATIONS

设备使用说明书
第2页 共 23 页
Table 2
Parameter name
Value
Operating frequency range
23MHz-6200MHz
Frequency resolution, for frequencies 100-6200 MHz
10KHz
Maximum number of scan points
1000
Scanning rate
1000 points/s
The direction of the bridge, uncorrected throughout the range
> 12 dB
Directivity effective (after full single-port calibration)
> 50 dB
Standing wave ratio at the input
< 2
Phase measurement precision
> 1,5°
Magnitude measurement precision
> 0,25 dB
Resolution determining the distance to fault
(CxVF)/2S m
The maximum length of the measured cable 4 , at VF=1
3000m
Maximum DC input voltage
25V
Displayed plots
■ the Smith chart; ■ polar chart; ■ the phase of the reflection coefficient;
■ magnitude; ■ logarithmic magnitude; ■VSWR; ■ distance-to-fault; ■ cable loss
Number of user settings to save
8
Operating temperature range
0-40℃
Screen diagonal
3.2”
Screen type
touch, resistive
Battery capacity
4000mAh
Overall dimensions (L×W×H)
145x75x24mm
Weight
350g
4 NOTICES
1、Please read the user manual before using the equipment. Please ask the agent for the
detailed product manual.
2、It is strictly forbidden for the personnel using the equipment to dismantle and repair the
equipment without permission. If the equipment is detected to be faulty, please stop the operation
and shut down the equipment immediately and find the agent to repair it.
3、If you need to leave the workplace, disconnect the device and other devices. Do not leave
the device running unattended!
4、Avoid working in open spaces during snow or rain. Increased humidity and all types of
liquid, once inside the device, can damage it.
5、Do not use the device in areas with corrosive and explosive environments. Pairs of
aggressive substances can destroy the insulation, which can lead to the failure of the device.
6、Do not carry the device by the cables and wires connected to it, do not unplug the
connectors by pulling the cable or cord.
7、Do not apply excessive force to the control buttons and the device screen.
8、Avoid bumps and drops. If dropped, the device may be damaged.

设备使用说明书
第3页 共 23 页
9、Do not allow children to play with the device, as they could hurt or injure others, or disable
the device.
5 COMPOSITION OF THE DEVICE
5.1 The composition of the device is shown in Figure 5.1
Figure 5.1 External view of the device
1.RF test port;
2.Housing;
3.Colour resistive screen of 3.2” ;
4.Control buttons block;
5.Side switch button
6.Battery charge indicator charge;
7.Connector for transferring data and charging the battery of the device USB type C
5.2 The block of buttons for controlling the device is shown in
Figure 5.2

设备使用说明书
第4页 共 23 页
Figure 5.2 Control buttons unit
6 TURNING ON/OFF
6.1 Turning on the device
Power on: when the device is off, turn on the side switch button, and then press the menu button for more than
2 seconds to turn on the device. The screen will display the results of the device self-test. Then, the device
switches to normal operation.
6.2 Turning off the device
Power off: when the device is running, long press the menu button for more than 2 seconds. After the screen
goes out, turn off the side switch button.
7 DEVICE SCREEN
The device displays the results of scanning the specified frequencies in the form of user-defined plots and
charts. The current settings of the device, the scanning range, the type of displayed plot or chart and other
important information for the user are located on the bottom line of the screen. Consider this information line from
left to right.
8.<move>Buttons for moving markers, moving in frequency and
amplitude, changing the scanning range.
9.<span>switching buttons (8) to the mode for changing the scan
range at a constant center frequency (widening and narrowing of the
range).
10.<freq>switching buttons (8) to the center frequency change
mode without changing the scan range (left / right shift of the range).
11.<marker>switch the marker number and set the button mode (8)
to move the marker in frequency.
12.<plot>switching buttons (8) to the mode for changing the scan
range at a constant center frequency (widening and narrowing of the
range).
13.<ampl>switches the buttons (8) to the reference level change
mode when some plots are displayed.
14.<menu>exit to the main menu. Turning the device on and off
when pressed and held for more than 2 seconds.

设备使用说明书
第5页 共 23 页
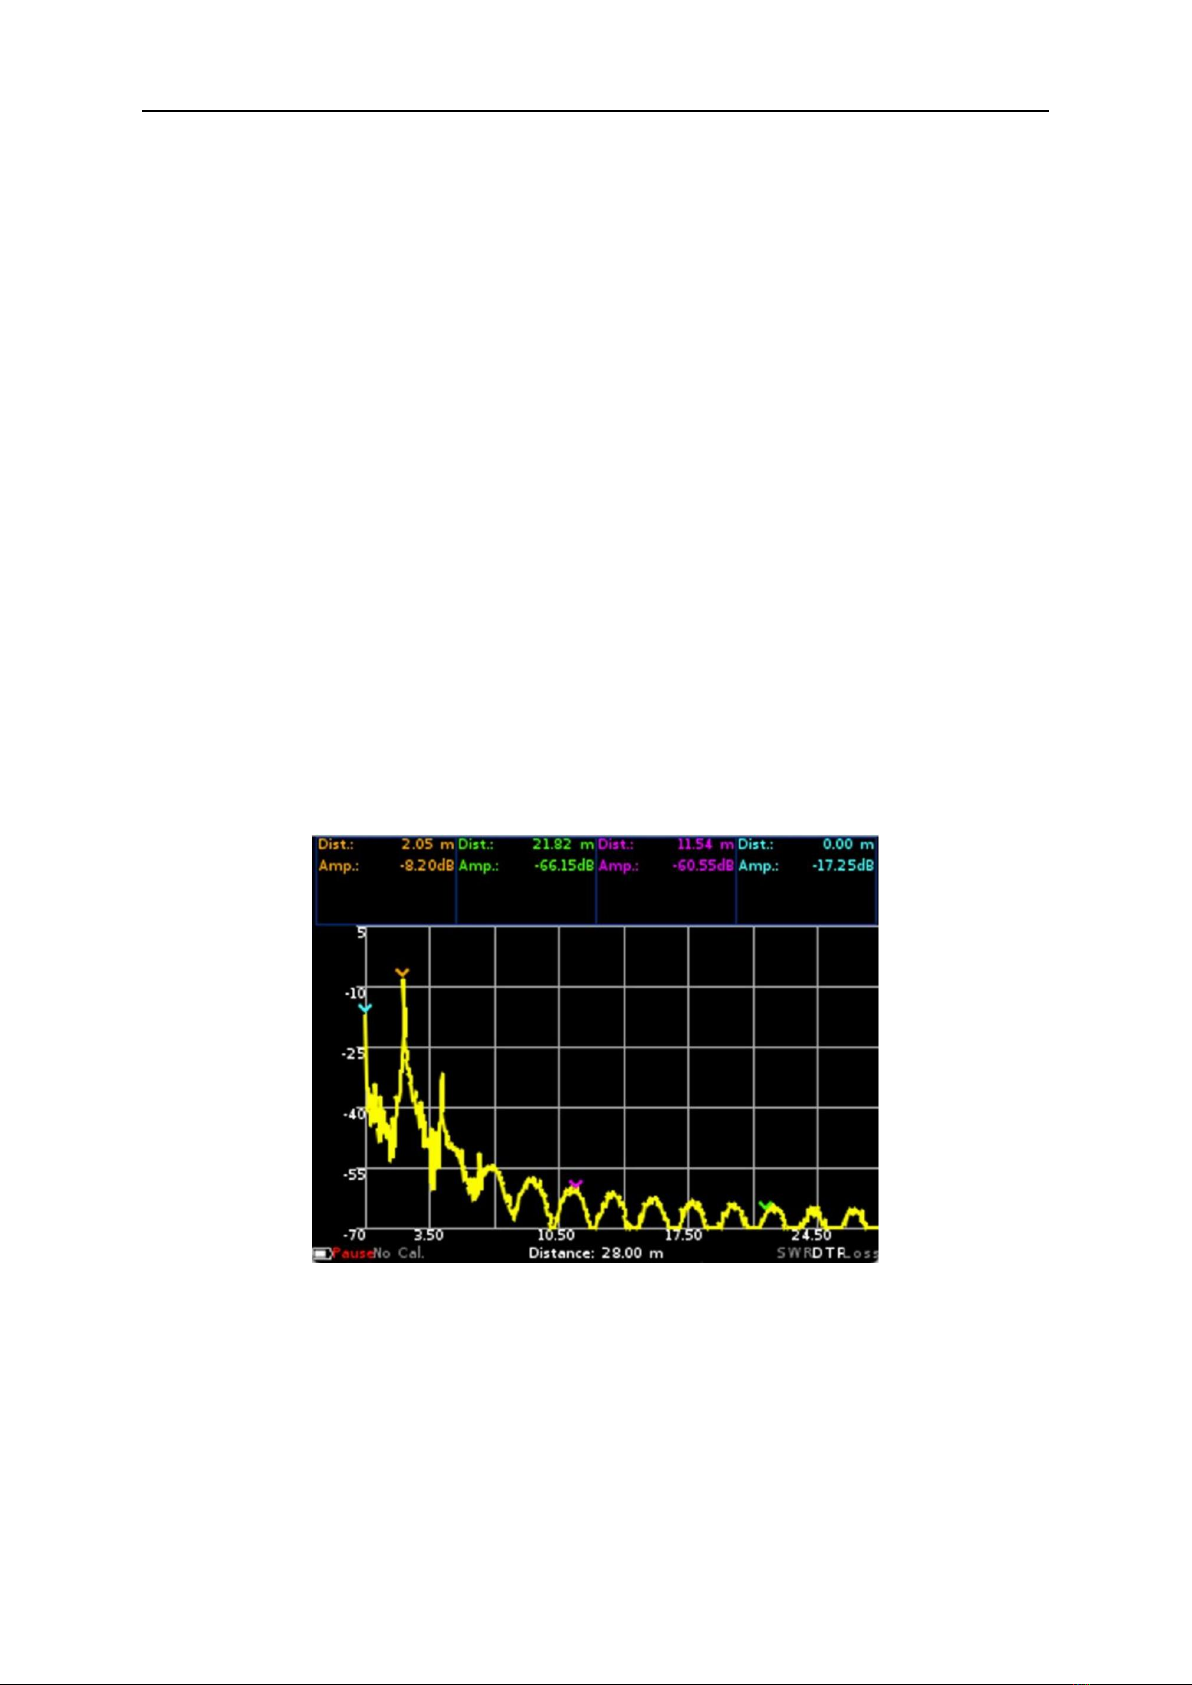
Figure 7.1 - Screen of the device
7.1 In Figure 7.1, in the lower left corner of the screen is placed the indicator (A) of the status of the internal
battery, which, depending on the state of the battery, can be displayed as:
indicator in the form of a spark (lightning) - battery is charging;
the indicator symbol in the form of a battery is completely filled with white - the battery is fully charged;
indicator symbol in the form of a white battery circuit - the battery is discharged, it is necessary to charge it;
the device has displayed a message on the critical power level - the battery is completely discharged, the
device will automatically turn off.
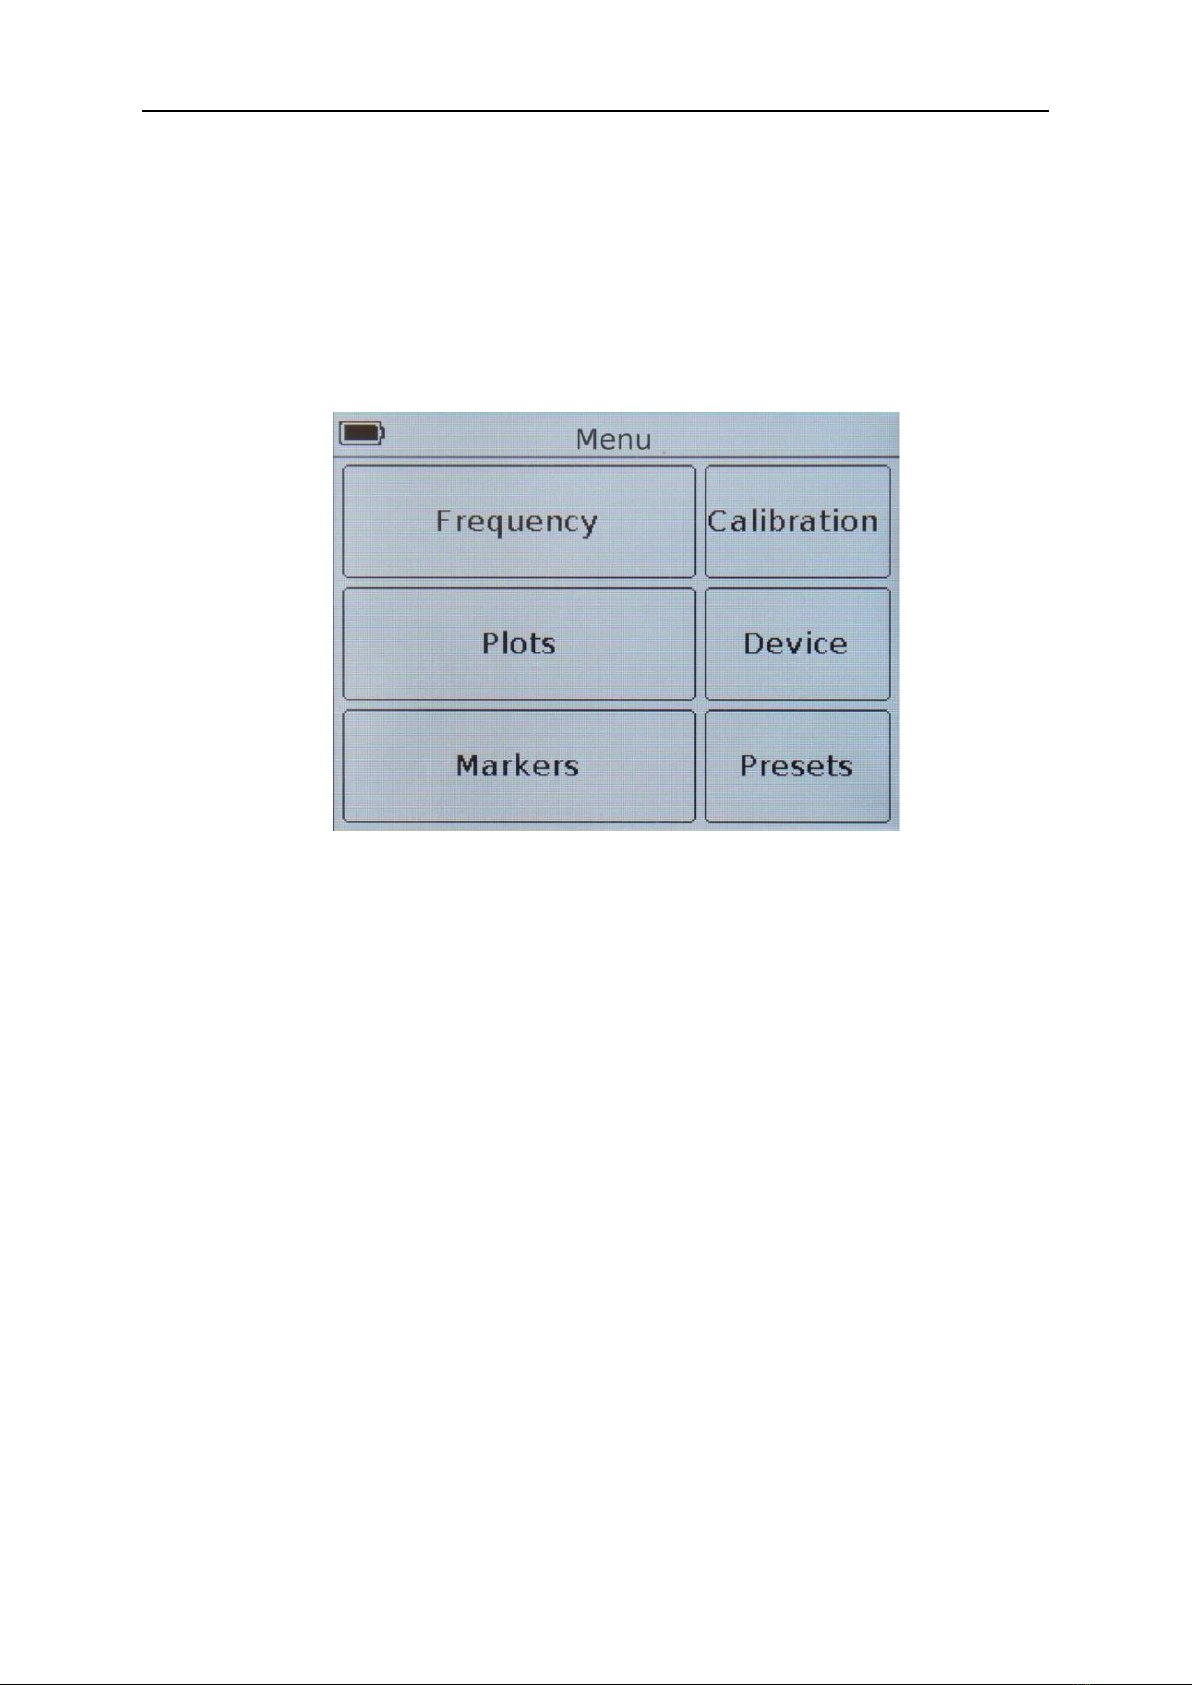
7.2 To the right, from the battery status indicator, the mode (B) is displayed, Figure 7.1, in which the navigation
buttons are located:
Plot - a mode in which the moving buttons switch charts and plots on the device screen;
Span - using the moving buttons, the user can change the viewing range at a constant center frequency;
Freq - use the moving buttons to change the initial and final frequencies without changing the width of the
frequency plan (shifting the frequency plan);
Mkr 1 ... Mkr 4 - an active marker that can be moved with the moving buttons. Switching between markers is
done by pressing the button “marker”;
Amp - mode in which the moving buttons change the reference level when outputting such plots as
magnitude, logarithmic magnitude and VSWR.
7.3 Designation of the type of calibration (С) figure 7.1:
No Cal - factory calibration;
Cal - calibration corresponding to the frequency plan, displayed in green;
Cal. Int - calibration interpolation, displayed in orange;
Cal. Ext - extrapolation of calibration, displayed in red.
7.4 In the center of the bottom line, the frequency plan is displayed (D) Figure 7.1:
Start - the initial frequency of the frequency plan;
Stop- the final frequency of the frequency plan.

设备使用说明书
第6页 共 23 页
7.5. In the lower right corner of the screen, the type of the plot is displayed on the device screen (E) (Figure
7.1):
Smh - Volpert-Smith chart allowing to display the complex reflection coefficient, relative to an impedance of
50 Ohms;
Pol - polar chart for displaying the complex reflection coefficient;
Ph - plot showing the phase of the reflection coefficient, reduced to degrees in the range from -180 to 180;
Mag - plot showing the modulus of the reflection coefficient in a linear scale;
LMag - plot representing the modulus of the reflection coefficient in a logarithmic scale (in dB);
SWR - plot showing the standing wave voltage ratio;
DTF - plot showing the distance to fault or discontinuity in the cable;
Loss - plot showing cable loss.
Note – To the left and to the right of the designation displayed on the plot, the designations of the previous and
next plot are displayed.
Note – Due to the characteristics of Smh and Pol charts on the device screen, the frequency plan is displayed
in the lower right corner. For the DTF plot, the distance or time is displayed instead of the frequency setting,
depending on the user settings.
7.6. Clicking on the screen with the displayed plot during the measurements puts the device in the pause
mode (Figure 7.2). In this mode, the user can take a closer look at the plot. Device status information is displayed
by a flashing PAUSE symbol next to the battery symbol.
Figure 7.2 - Pause mode
7.7. To exit the pause mode, press the device screen again or press any of the buttons of the control unit.

设备使用说明书
第7页 共 23 页
8 DEVICE MENU
8.1 Main menu
8.1.1 Turn on the device in accordance with section 6 of this Manual. After switching on the device, press the
"menu" button. The device will display the main menu as in Figure 8.1.
Figure 8.1 – Main menu of the device
8.1.2. Each section of the main menu has its own purpose:
Frequency – menu section where the user sets the frequencies at which devices or loads are tested.
Plots – the section of the main menu where you can select and configure the parameters of the charts and
plots displayed on the screen.
Markers – section for setting visual markers and setting parameters for their display during measurements.
Calibration – menu for calibration of the device.
Device – this section specifies the device serial number and the software version.
Presets – section to save user settings.
Traces – section to save the results of the current measurements (traces) with the subsequent possibility of
loading and comparing them.
8.1.3. To exit the main menu, press the “menu” button. To quickly exit from any menu to the displayed plots,
press the “plot” button.
8.2 Frequency setting menu
The frequency plan consists of the parameters by which the synthesizer sweeps and sets the measurement
mode (frequency range, number of measurement points, digital filter bandwidth)
8.2.1. To set the frequency plan enter the main menu of the device (Figure 8.1) by pressing the “menu”
button. Enter the Frequency section. A menu will appear on the screen, as in Figure 8.2.

设备使用说明书
第8页 共 23 页
Figure 8.2 – Menu for setting scan parameters
8.2.2. Each of the options in the Frequency menu has its own purpose:
Center – setting the center frequency of the scan range.
Span – scanning band (range) of frequencies.
Start – setting the initial frequency of the scanned frequency range.
Stop – setting the final frequency of the scanned frequency range.
BW – choice of bandwidth of the digital filter of the intermediate frequency (IF).
Points – select the number of scan points.
8.2.3. Setting the frequency parameters (Center,Span,Start and Stop) is done by entering a numerical value
in the opened submenu, as in Figure 8.3. Enter the numerical value of the frequencies and press or Enter. To
delete erroneous or previously entered values, press ×or Del. To refuse to enter a value, click ˂or Cancel.In our
example, in figure 8.3, the initial frequency of 2200 MHz of the scanned frequency range is set.
Note – discreteness of frequency parameters is 10 kHz (0.01 MHz). In the case of entering an unacceptable
value, a warning is displayed on the device that the input value is outside the allowable values.

设备使用说明书
第9页 共 23 页
Figure 8.3 – Entering numerical values of frequency parameters of the device
8.2.4. Frequency parameters are set in three ways:
By entering the initial Start and final Stop frequencies, while the center frequency Center is
automatically assumed equal to their half-sum. The range of scanned frequencies Span is automatically
taken equal to the difference between the final and initial frequencies.
Setting the Center frequency and Span scan frequency range. In this case, the Start and Stop
frequencies will be set automatically as Center ± Span / 2.
Loading custom settings from the Presets menu.
Note – If the frequency entered by the user is outside the working range, a corresponding warning is displayed
on the device screen, as shown in Figure 8.4.
Figure 8.4 – Warning about exceeding the operating range of 6G Vector Network Analyzer
8.2.5. In the BW menu (Figure 8.5), the bandwidth of the digital filter is selected. The narrower the digital filter
bandwidth, the higher the measurement precision and the signal-to-noise ratio. This increases the scan time.
Note – Decreasing the bandwidth 10 times will increase the signal-to-noise ratio of the voltage by 3times (or
10 dB) while increasing the scan time by 10 times.

设备使用说明书
第10 页 共 23 页
Figure 8.5 – Choosing the bandwidth in the BW menu
8.2.6. In the Points menu (Figure 8.6), the user sets the number of scan points. The scanning step in
frequency and the scanning time depend on the specified number of points. The correct choice of the number of
points and scanning range allows to improve the resolution at a number of measurements (DTF, Loss).
Figure 8.6 – Selection menu of scan points
8.3 Plots menu settings displayed on the screen plots
8.3.1. To select the plots displayed on the device screen and adjust the parameters displayed on these plots,
enter the main menu of the device (Figure 8.1) by pressing the "menu" button. Enter to the Plots section. The
menu appears as in Figure 8.7.

设备使用说明书
第11 页 共 23 页
Figure 8.7 – The setup menu for the displayed plots
8.3.2. In the Plots menu, the plots displayed on the screen are selected and the parameters displayed are set.
To display the plot on the device screen, you need to check the box next to the plot name, and to disable it,
uncheck it.
8.3.3. Clicking on the field with the name of the plot opens a menu of advanced settings for displaying the plot.
Note – In the case of setting the frequency plan, at which the maximum propagation time exceeds the value of
9999.99 ns, the DTF menu settings window will be blocked.
8.4 Markers menu
8.4.1. Enter the main menu of the device (Figure 8.1) by pressing the “menu” button . Enter the Markers
section. A menu will appear on the screen, as in Figure 8.8.
Figure 8.8 – Menu for setting parameters of markers displayed on plots

设备使用说明书
第12 页 共 23 页
8.4.2. On all plots displayed on the device screen, except for DTF and Loss, you can display up to four
ulti-colored markers to display numerical measurement results. Switching off and on the marker is made by moving
the corresponding slider against the selected marker to the Off / On position. Markers are completely independent
of each other and can be tuned by the type of values displayed by the marker and by frequency.
8.4.3. To adjust the marker by the type of displayed values, click on the corresponding marker in the Type
column. The menu for selecting the type of values displayed by the marker will appear on the screen (Figure 8.9).
Figure 8.9 – Selecting the type of values displayed by the marker
8.4.4. Select the type of value displayed by the marker according to table 3.
Table 3

设备使用说明书
第13 页 共 23 页
8.4.5. To set the frequency on which the marker will be set, in the menu of markers (Figure 8.8) in the
Frequency column, click on the corresponding marker. A submenu for entering numerical values will appear on
the screen, as in Figure 8.10.
Figure 8.10 – Entering numerical values of the frequency to set the marker
8.4.6. Enter the numerical value of the frequencies and press or Enter. To delete erroneous or previously
entered values, press ×or Del. To refuse to enter a value, click ˂or Cancel.
In our example, in figure 8.10, the frequency of 2110 MHz is entered to set the marker to this frequency value
on the plot.
The markers can be moved left-right along the plot using the navigation buttons and switching between the
markers with the button “marker”. The marker will move in steps equal to:
where Step – marker movement step
SPAN – scanning frequency range
N – number of scan points.
8.4.7. The marker turned on and set to a user-defined frequency will be displayed on the measurement plot in
the corresponding color. The parameters of the values displayed by the markers are displayed next to the
measurement plot and change in real time (Figure 8.11).

设备使用说明书
第14 页 共 23 页
Figure 8.11 – Display of parameters measured by markers
To quickly change the displayed parameters or the frequency of one of the four markers displayed near the
plot, click on the marker parameters area and go to the express settings menu of markers (Figure 8.12).
Figure 8.12 – Express menu for setting markers
Changing the frequency at which the marker is located is carried out in two ways:
Pressing the block with the frequency display and then moving to the menu for entering numerical
values, as in Figure 8.10.
By pressing the navigation buttons . The frequency change will occur in increments of 0.1% of the
current frequency.
The "start / pause" button allows you to fix the values of each of the parameters constantly changing in real
time.
The color highlights the parameters of the selected marker displayed on the plot. To change the display
parameters of the selected marker, click on one of the four blocks with parameters without backlight. Clicking on

设备使用说明书
第15 页 共 23 页
the backlit block will result in the return of the display parameters. Pressing the “menu” button returns to the
viewing plot.
Table 4 below shows the types of displayed parameters in the express menu.
Table 4 - The value of the parameters of the express menu of setting markers
8.4.8. To quickly change the displayed parameters or the frequency of one of the four markers of the DTF plot,
click on the area of the selected marker above the plot and go to the express menu (Figures 8.13 and 8.14). Press
the button “menu” to return to the viewing plot.
Figure 8.13 – Express menu for setting DTF plot distance parameters
Clicking on the top express-menu block, set the time (ns) or distance (m) from the reference point on the plot
for measuring with the selected marker. Then, set the type of marker Point or Peak. By selecting Point, you place
the marker at a plot point located at a specified distance or time from the start of the reference.
Select the value of the Peak (maximum) will lead to the placement of the marker on the peak (maximum) of
the plot corresponding marker sequence number. In this case, the entered time or distance value is ignored by the
device.

设备使用说明书
第16 页 共 23 页
Figure 8.14 – Express menu for setting the time parameters of the DTF plot markers
Note – The parameters of the markers (time or distance) depend on the selected Scale units of measurement
in the marker setting menu for the DTF plot.
In addition to entering numerical values, markers can be moved left-right along the plot using the navigation
buttons and switching between the markers with the button “marker”. The marker will be moved in increments of
1/1024 from the time or distance displayed on the plot.
Note – Moving with buttons is possible only for markers of the Point type. Peak (maximum) type markers do
not move.
8.4.9. To quickly change the displayed parameters or the frequency of one of the four markers of the Loss plot,
click on the area of the selected marker above the plot and go to the submenu for entering the numerical values of
this marker as in Figure 8.10
In addition to entering numerical values, markers can be moved left-right along the plot using the navigation
buttons and switching between the markers with the button “marker”. The movement of the marker will occur in
steps equal to:
where Step – marker movement step
SPAN – scanning frequency range
N – number of scan points.
8.5 Device calibration menu
The device is initially factory calibrated, recorded in non-volatile memory, the relevant information (No Cal) is
displayed in the lower information line of the screen. The calibration plane corresponds to the device port (1) for
connecting the test devices and the load (TEST PORT). To increase the accuracy of measurements using

设备使用说明书
第17 页 共 23 页
additional adapters and cables, it is necessary to make a full single-port calibration using a set of calibration
measures purchased separately.
8.5.1. To enter the calibration menu, enter the device main menu by pressing the "menu" button (Figure 8.1)
and select the Calibration section. The screen will display the calibration menu as shown in figure 8.15.
Figure 8.15 – Calibration Menu
8.5.2. To reduce the influence of connecting wires and connectors on the measurement results, it is necessary
to calibrate.
Note - Calibration is performed after warming up the device for at least five minutes. The change in ambient
temperature from the time of calibration to measurements should not exceed ± 3 °C. Before carrying out critical
measurements, always calibrate the device to eliminate the influence of the ambient temperature.
8.5.3. Connect the connectors, adapters and cables through which the device will be connected to the test
device to the port (1) of the device (TEST PORT).
Note – Thus, the device calibration plane is transferred from the test port (1) of the device (TEST PORT) to
the required cable or connector.
Then connect the loads from the standard set of calibration measures (not included) to the required
cable or connector:
Open standard and press the Open command on the screen
Short standard and press the Short command on the screen;
Load standard, and click Load command.
After calibration, the background of the commands on the screen will turn black or green (depending on the
model of your device), as in Figure 8.16.

设备使用说明书
第18 页 共 23 页
Figure 8.16 – Calibration of the device
Note – To cancel (erase) this or that calibration, click on the Erase button, and reconnect the appropriate
calibration measure, calibrate the device again.
8.5.4. On the screen in the plot display mode, the calibration information will appear in the lower information
line:
No Cal – custom calibration no. The device is factory calibrated.
Cal – Calibrated by user. Calibration and frequency plan match. In this mode, the measurement results are
the most accurate.
Cal. Int – The frequency plan does not coincide with the reference at which calibration was performed, but
the frequencies lie within the calibration range. The measurement accuracy is lower, since the device uses a
mathematical method for calculating calibrations based on interpolation.
Cal. Ext – The frequency plan does not coincide with the reference at which the calibration was performed,
but the frequencies are outside the calibration range. Measurement accuracy is the lowest since the device uses a
mathematical method for calculating calibrations based on extrapolation.
Note – When you exit the Calibration menu until the full calibration process is completed, a warning will be
displayed on the screen, as in Figure 8.17. You must either return to the menu by clicking Back and complete the
calibration process, or exit the menu by clicking OK. In the latter case, when carrying out measurements, the
factory calibration of the device will be applied.
Table of contents