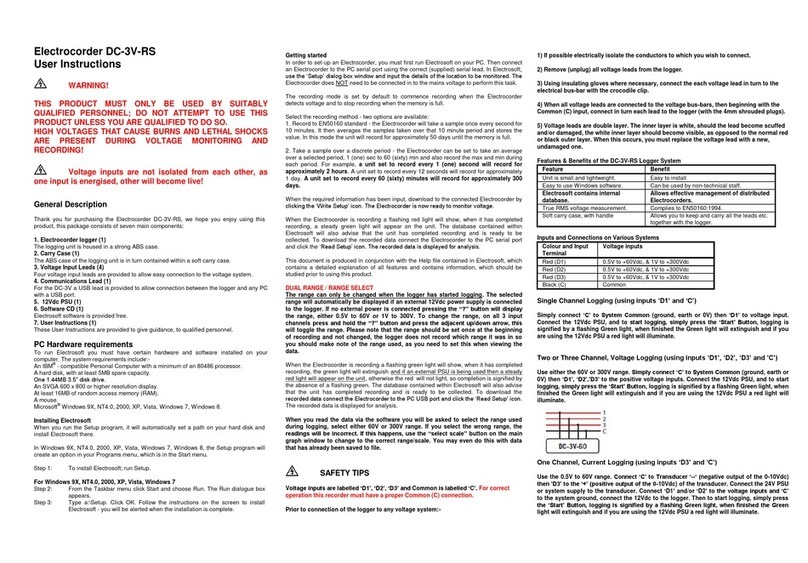
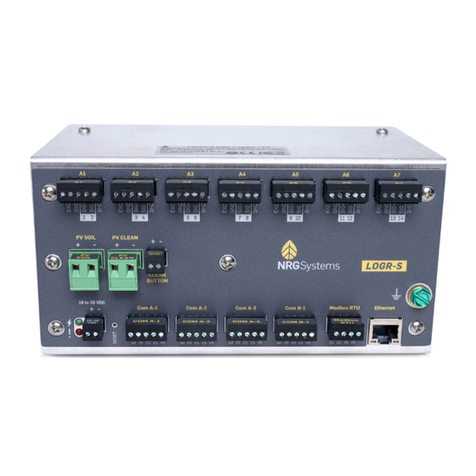
Data Harvest EASYSENSE Q Advanced User manual

CONTENTS Page
What’s in the storage bag? . . . . . . . . . . . . . . . . . . . . . . . . . . . . . . . . . . . . . . . . . . . . . . . . . . . . . . . . . . . . . . . . . . . 2
The EASYSENSE Q Advanced data logger . . . . . . . . . . . . . . . . . . . . . . . . . . . . . . . . . . . . . . . . . . . . . . . . . . . . . . . 3
EASYSENSE Q Advanced’s buttons . . . . . . . . . . . . . . . . . . . . . . . . . . . . . . . . . . . . . . . . . . . . . . . . . . . . . . . . . 3
Smart Q sensors . . . . . . . . . . . . . . . . . . . . . . . . . . . . . . . . . . . . . . . . . . . . . . . . . . . . . . . . . . . . . . . . . . . . . . . . . 4
Ways to capture data with EASYSENSE Q Advanced . . . . . . . . . . . . . . . . . . . . . . . . . . . . . . . . . . . . . . . . . . . . . . 5
Using EASYSENSE Q Advanced connected to a computer for the first time . . . . . . . . . . . . . . . . . . . . . . . . . . . . . 5
Using EASYSENSE QAdvanced with the computer after initial setup . . . . . . . . . . . . . . . . . . . . . . . . . . . . . . . . . . 7
The EASYSENSE software overview . . . . . . . . . . . . . . . . . . . . . . . . . . . . . . . . . . . . . . . . . . . . . . . . . . . . . . . . . . . . 7
Using EASYSENSE Q Advanced without a computer . . . . . . . . . . . . . . . . . . . . . . . . . . . . . . . . . . . . . . . . . . . . . . . 9
Meter . . . . . . . . . . . . . . . . . . . . . . . . . . . . . . . . . . . . . . . . . . . . . . . . . . . . . . . . . . . . . . . . . . . . . . . . . . . . . . . . 9
(Set sensor range) . . . . . . . . . . . . . . . . . . . . . . . . . . . . . . . . . . . . . . . . . . . . . . . . . . . . . . . . . . . . . . . . . . . . . . . 10
Snapshot . . . . . . . . . . . . . . . . . . . . . . . . . . . . . . . . . . . . . . . . . . . . . . . . . . . . . . . . . . . . . . . . . . . . . . . . . . . . . . 10
EasyLog . . . . . . . . . . . . . . . . . . . . . . . . . . . . . . . . . . . . . . . . . . . . . . . . . . . . . . . . . . . . . . . . . . . . . . . . . . . . . . . 12
Logging . . . . . . . . . . . . . . . . . . . . . . . . . . . . . . . . . . . . . . . . . . . . . . . . . . . . . . . . . . . . . . . . . . . . . . . . . . . . . . . 13
Time & Motion . . . . . . . . . . . . . . . . . . . . . . . . . . . . . . . . . . . . . . . . . . . . . . . . . . . . . . . . . . . . . . . . . . . . . . . . . . 17
Downloading stored data sets into the EASYSENSE software . . . . . . . . . . . . . . . . . . . . . . . . . . . . . . . . . . . . . 20
System Menu . . . . . . . . . . . . . . . . . . . . . . . . . . . . . . . . . . . . . . . . . . . . . . . . . . . . . . . . . . . . . . . . . . . . . . . . . . 20
1. No Bluetooth or Bluetooth . . . . . . . . . . . . . . . . . . . . . . . . . . . . . . . . . . . . . . . . . . . . . . . . . . . . . . . . . . . . 20
2. Battery life . . . . . . . . . . . . . . . . . . . . . . . . . . . . . . . . . . . . . . . . . . . . . . . . . . . . . . . . . . . . . . . . . . . . . . . . . 21
3. Set date & time . . . . . . . . . . . . . . . . . . . . . . . . . . . . . . . . . . . . . . . . . . . . . . . . . . . . . . . . . . . . . . . . . . . . . 21
4. Internal temperature . . . . . . . . . . . . . . . . . . . . . . . . . . . . . . . . . . . . . . . . . . . . . . . . . . . . . . . . . . . . . . . . 22
5. Data Sets and delete menu . . . . . . . . . . . . . . . . . . . . . . . . . . . . . . . . . . . . . . . . . . . . . . . . . . . . . . . . . . . 22
Switch off . . . . . . . . . . . . . . . . . . . . . . . . . . . . . . . . . . . . . . . . . . . . . . . . . . . . . . . . . . . . . . . . . . . . . . . . . . . . . . 22
Technical Information for EASYSENSE Q Advanced . . . . . . . . . . . . . . . . . . . . . . . . . . . . . . . . . . . . . . . . . . . . . . . . 23
Selecting the sensor range . . . . . . . . . . . . . . . . . . . . . . . . . . . . . . . . . . . . . . . . . . . . . . . . . . . . . . . . . . . . . . . . . 23
Hard Reset . . . . . . . . . . . . . . . . . . . . . . . . . . . . . . . . . . . . . . . . . . . . . . . . . . . . . . . . . . . . . . . . . . . . . . . . . . . . . 23
Powering EASYSENSE Q Advanced . . . . . . . . . . . . . . . . . . . . . . . . . . . . . . . . . . . . . . . . . . . . . . . . . . . . . . . . . 23
(Mains Power, Batteries and Automatic standby)
Specifications . . . . . . . . . . . . . . . . . . . . . . . . . . . . . . . . . . . . . . . . . . . . . . . . . . . . . . . . . . . . . . . . . . . . . . . . . . . 25
Care & Maintenance . . . . . . . . . . . . . . . . . . . . . . . . . . . . . . . . . . . . . . . . . . . . . . . . . . . . . . . . . . . . . . . . . . . . . . 25
Updating EASYSENSE QAdvanced’s firmware . . . . . . . . . . . . . . . . . . . . . . . . . . . . . . . . . . . . . . . . . . . . . . . . 26
Trouble Shooting . . . . . . . . . . . . . . . . . . . . . . . . . . . . . . . . . . . . . . . . . . . . . . . . . . . . . . . . . . . . . . . . . . . . . . . . . 27
Appendix 1. EasyLog Logging (samples & duration) . . . . . . . . . . . . . . . . . . . . . . . . . . . . . . . . . . . . . . . . . . . . . . . . 28
Appendix 2. Duration and Interval table for Logging . . . . . . . . . . . . . . . . . . . . . . . . . . . . . . . . . . . . . . . . . . . . . . . . 29
Appendix 3. Logging menu . . . . . . . . . . . . . . . . . . . . . . . . . . . . . . . . . . . . . . . . . . . . . . . . . . . . . . . . . . . . . . . . . . . . 33
Appendix 4. Timing Interupters and Parameters . . . . . . . . . . . . . . . . . . . . . . . . . . . . . . . . . . . . . . . . . . . . . . . . . . . 34
Appendix 5. Timing Options . . . . . . . . . . . . . . . . . . . . . . . . . . . . . . . . . . . . . . . . . . . . . . . . . . . . . . . . . . . . . . . . . . . 35
Appendix 6. System menu . . . . . . . . . . . . . . . . . . . . . . . . . . . . . . . . . . . . . . . . . . . . . . . . . . . . . . . . . . . . . . . . . . . . 41
Appendix 7. Bluetooth instructions . . . . . . . . . . . . . . . . . . . . . . . . . . . . . . . . . . . . . . . . . . . . . . . . . . . . . . . . . . . . . . 41
Warrenty . . . . . . . . . . . . . . . . . . . . . . . . . . . . . . . . . . . . . . . . . . . . . . . . . . . . . . . . . . . . . . . . . . . . . . . . . . . . . . . . 48
Copyright: all rights reserved.
This manual may be copied for use within the premises of the Licensee on condition that it is not loaned, sold or used
outside the Licensee’s premises.
Data Harvest’s policy is to continually improve products and services, so we reserve the right to make changes
without notice. It is acknowledged that there may be error or omissions in this publication for which responsibility
cannot be assumed. No liability will be accepted for loss or damage resulting from use of information contained in this
manual or from uses as described.
Document No: DO160
1

2
The EASYSENSE Q Advanced data logger
A USB communication cable A power supply unit (UK version shown)
Two long Smart Q sensor leads Two short Smart Q sensor leads
The EASYSENSE software with
Quick Start Guide
What’s in the storage bag?
Note: If EASYSENSE Q Advanced is to be connected via a USB port, it is only suitable for use
on a computer with an operating system that supports USB e.g. 98SE, 2000, Me and XP. It will
not be supported by Windows 95, 98 or Windows NT (workstation and server).
Note: The battery pack in EASYSENSE Q Advanced is fully charged before it leaves Data
Harvest. Even when turned off, EASYSENSE Q Advanced will use a small amount of current,
and the battery will slowly empty. If the unit is to be stored for long periods without use then it is a
good idea to recharge the batteries fully every 6 – 8 weeks. See page 24.

The EASYSENSE Q Advanced data logger
EASYSENSE Q Advanced is a fully self-contained portable data logger, which can be used:
1. As an interface connected to a computer
2. As a stand alone instrument
In its stand alone mode EASYSENSE QAdvanced can:
!!Display meter readings of the sensor attached
!!Record the data from sensors in its memory for transferring later to a computer for
analysis
EASYSENSE Q Advanced buttons
The green triangle (ENTER) button is used to start data collection, to confirm a choice or take a
sample.
The red square (STOP) button is used to stop data being recorded or return to the previous
screen.
The blue triangle buttons (SCROLL) are used to scroll through menus on the LCD screen or to
browse measurements during data logging.
To wake up EASYSENSE Q Advanced, press any of the buttons on the top panel.
3
Bluetooth LED indicator
LCD Display
USB input
Power Light
Power Socket
Blue triangle
(scroll up) button
Green triangle
(enter or select)
button
Blue triangle
(scroll down)
button
Red square
(stop or back) button
Inputs for plug-in sensors
(Note: Input 5 and 6 dual labelled as A and B for Timing operations)
Bluetooth Logo
(on Bluetooth
enabled
loggers only)

4
Smart Q Sensors
Smart Q Sensors are each equipped with a sophisticated microprocessor that greatly improves the
sensor’s accuracy, precision and consistency. The auto-identification circuitry dramatically simplifies
set up procedures and allows for greater flexibility when logging data.
The six inputs on Q Advanced may be used with analogue and digital sensors. Both will be recorded
side by side during logging operations e.g. whilst recording with traditional analogue sensors, a
digital sensor can be used to create a ‘blip’ on the graph to mark an event. Once a Smart Q Sensor
is connected it will automatically be detected and displayed on the LCD display.
To maintain consistency with existing software, sensor inputs 5 and 6 are dual
labelled as A and B. These inputs for are use with digital sensors which must be
connected to either Input 5:A or Input 5:A and 6:B during Timing operations.
Four sensor leads have been provided to connect Smart Q Sensors to Q Advanced.
1. Hold the Smart Q sensor housing with label on top.
2. Push one end of the sensor cable into the socket on the sensor
housing with the flat of the connecting plug facing upwards.
3. Connect the other end of the cable to the shaped input socket on
the EASYSENSE Q Advanced.
Smart Q Sensors are available to purchase separately and are not
supplied with EASYSENSE Q Advanced.
Sensors can be divided into two main types:
1. Analogue - which are used to measure physical quantities such as temperature, sound, light,
pH, etc.
2. Digital - which are switch-type sensors for measuring ON/OFF conditions such as light gates
and timing mats used for calculating time, speed and acceleration.
Please contact your supplier for an up-to-date list of Smart Q Sensors.
Input socket
Sensor housing
Sensor cable
with locating
arrows facing
upwards
Smart Q pH electrode and adapter
Smart Q Light Gate

Ways to capture data with EASYSENSE Q Advanced
There are different ways that EASYSENSE Q Advanced can be used to collect data.
1. Real time. In this mode EASYSENSE Q Advanced is entirely driven by the software on the host
computer. The data from the sensors is transmitted immediately to the computer and displayed
on the computers screen using the applications in the EASYSENSE software. This method of
collection is useful for many classroom-based experiments.
2. Remote. In this mode EASYSENSE Q Advanced is used to collect and store data while
disconnected from the computer. Data collection can either be:
a) Setup using EASYSENSE Q Advanced menu options (e.g. Easy Log, Snapshot, Logging
or Time & Motion – see stand-alone operation on page 9).
or
b) Setup via Setup Remote in the EASYSENSE software to log data for a set time period.
The data collected in remote mode is stored in the memory of EASYSENSE Q Advanced to be
retrieved later by the computer.
Using EASYSENSE Q Advanced connected to a computer for the first
time
Step 1:
Install the EASYSENSE software, if it is not already on your computer. For details of how to install
and operate this program, please refer to the instructions provided with the EASYSENSE software.
Note: DO NOT CONNECT EASYSENSE Q Advanced to the USB port before the EASYSENSE software is
installed.
Step 2:
a) If EASYSENSE Q Advanced is to be connected via the USB port, the USB drivers will need to
be installed.
Note for Windows 2000 and XP users: You need to be logged on as administrator (or with equivalent access
rights) to install the EASYSENSE Q Advanced USB drivers.
!!Connect the ‘square’ USB plug of the USB cable to the USB input on the side of
EASYSENSE Q Advanced.
!!Connect the ‘flat’’ USB plug to a USB port on your computer.
!!Windows will automatically detect that a new device has been connected and a Wizard will
be generated to aid installation.
Windows XP Users: Select to install the software automatically. You may be warned that the drivers have not
passed Windows Logo signing, please ‘continue anyway’ at this point.
Window Me users: With the EASYSENSE CD ROM still in the CD Drive, select ‘Specify a location’ and search
for the best driver on removable media, click on OK. Next.
Window 2000 users: Select ‘Search for a suitable driver for my device’. Windows 2000 has a habit of
‘remembering’ the install path for USB drivers so it is best to install from the local drive rather than search on the
EASYSENSE CD ROM. Select ‘Specify a location’, click on the Browse button and browse for the USB Drivers
folder [default location is C Program Files Dhg Drivers and select the USB Drivers folder]. Click on OK.
Window 98 users: With the EASYSENSE CD ROM still in the CD Drive, select ‘Search for the best driver for
your device’, Next. Select ‘Specify a location’, click on the Browse button and browse for the EASYSENSE CD
ROM Drivers folder select the USB Drivers and click on OK. Click Next. Click on Next and the driver
information database will be built.
5

Note: Connect the EASYSENSE Q Advanced unit to each USB port on the computer that maybe used so that
the drivers can be installed.
b) If EASYSENSE Q Advanced is to be ‘connected’ via Bluetooth™ use the instructions provided
on page 41.
Notes:
!!To ‘connect’ via Bluetooth your EASYSENSE Q Advanced unit must have Bluetooth built-in. This will be
indicated by a Bluetooth symbol above the Data Harvest logo.
!!If you wish to add Bluetooth functionality to your EASYSENSE Q Advanced unit, please contact Data
Harvest for information about a Bluetooth upgrade.
Step 3:
!!Check that the LCD screen on EASYSENSE Q Advanced is displaying
the ‘Main Menu’.
Note: In most circumstances EASYSENSE Q Advanced will not communicate with the PC if it is taking samples. If
the LCD screen shows samples being taken press the red square button and then the green triangle to stop
the recording.
!!Open the EASYSENSE software program.
Step 4:
The first time the EASYSENSE program is opened a ‘Select
Program Level’ window will automatically open. Select a suitable
user’s level.
!!Level 1 is aimed at ‘start’ level (e.g. up to 9 years old).
!!Level 2 is aimed at ‘mid’ level (e.g. 9 – 15 years old)
!!Level 3 is aimed at ‘exam’ level (e.g.15 years plus).
Note: The program level can be altered at anytime using the Level icon once a logging option has been opened.
Step 5:
An Interface option window will open.
1. Select the Interface as EASYSENSE Range.
2. Select the method of connection.
!!If you are connecting via the USB port select ‘USB port’.
!!If you are using Bluetooth, select Serial port and then the serial
(COM) port configured for Bluetooth from the drop down menu.
3. If you use different interfaces or methods of connection, tick the ‘Show
at startup’ option so you can check your current selection and make any
adjustments as necessary each time EASYSENSE opens.
4. Click on OK. The program will save your selection so it will be automatically configured when
next used.
When a connection is established the Home page will open. Select one of the New experiment
modes i.e. EasyLog, Graph, Meters, Scope, Snapshot or Timing.
6

Using EASYSENSE Q Advanced with the computer after initial setup
!!Connect EASYSENSE Q Advanced to the computer.
!!Open the EASYSENSE software program.
!!Select one of the recording modes e.g. EasyLog from the Home page. The sensors connected
will automatically be recognised and calibrated.
The EASYSENSE software overview
Home is the main navigation page. On this
page are the icons for all of EASYSENSE Q
Advanced’s logging options.
EasyLog
EasyLog will open pre-set to record sensor
values continuously as a line graph until
stopped.
Click on the Start/Stop icon to start recording.
Logging will start with a time span of 30 seconds and
when this has elapsed the time will double automatically.
This will continue until the recording is stopped by
clicking on the Start/Stop icon.
Meters
The Meters window gives an introduction to
sensors and how they respond to change. Up
to four section displays can be open at any
one time and they can be any combination of
sensors and displays.
The program will open with live data from one sensor in a Numeric window. Click on the appropriate
picture icon on the Menu bar to open other section displays i.e. Numeric, Gauge, Colour Change or
Bar. To alter the sensor displayed in a section, right click in the individual section window and select
the sensor from the list.
Click on the Start/Stop icon to stop recording.
Snapshot
Snapshot will open pre-set to record sensor values on demand (manual sampling) with a
bar graph display.
Click on the Start/Stop icon to start recording. Click in the graph area to record the current value
for each active sensor. Click on the Start/Stop icon to stop data being recorded.
Graph
Graph is pre-set to record sensor values against a chosen time span as a line graph
display. The window opens with the real time logging wizard from which the time span,
interval between samples, start condition and triggers for the recording can be chosen.
(The options available will depend on the level you have selected to work at). When the
selection has been made, click on Finish.
7
The Home Page (Level 2 & 3)

Click on the Start/Stop icon and the recording will start when the start condition you have
selected is met e.g. if None was the selected trigger then the recording will start as soon as the
Start/Stop icon is clicked. The recording will stop when the selected time span has passed.
Scope
Click on the Start/Stop icon. The data from the sensor is redrawn continuously on the
screen in an oscilloscope type display.
Timing
Timing is used to allow students to study Time, Velocity, Acceleration, Momentum and
Kinetic Energy relationships using switch-type (digital) sensors such as light gates. A
recording wizard will open with these options available to select before recording data.
Sensors are connected to inputs 5:A or 5:A & 6:B. (The options available will depend on
the level you have selected to work at). When the selection has been made, click on
Finish.
Click on the Start/Stop icon and a reading will be displayed when a change is detected in signal
from the digital sensors.
Open File
Used to load a previously saved .sid or .ssl file. Locate the correct file and click on open.
Open Worksheet
To select and open a worksheet and its accompanying experimental set up file.
Open Setup
To select and open an experimental set up file. This will pre-set the software for a specific
operation.
Set up Remote
Used to set up the available options for capturing data while disconnected from the
computer (remote). These options can include the duration of a recording, the time
between each sample, and the trigger event. (The options available will depend on the
level you have selected to work at).
Retrieve Remote
Use this option to retrieve a data set stored in your EASYSENSE QAdvanced unit’s
memory for display and analysis.
8

9
Using EASYSENSE Q Advanced without a computer
EASYSENSE Q Advanced has a menu of different options available, which are displayed on the
built-in LCD screen.
A menu option is selected by using the blue triangle buttons to move the
list up or down until the pointer is pointing at the required option (the
pointer stays in the same position).
Press the green triangle button to select.
EASYSENSE Q Advanced has no ON switch. To ‘switch’ EASYSENSE Q Advanced on press any
button on the top panel.
If EASYSENSE Q Advanced is not being used, it will automatically switch itself off after two
minutes. Press any button to resume operation.
Meter
In this mode EASYSENSE Q Advanced will display measurements from the active sensors on the
LCD screen but will not store any data. The display is updated every half second.
The range of a Smart Q sensor can be altered whilst in Meter mode.
!!Connect the sensors. If the display is turned off, press any button to wake up EASYSENSE Q
Advanced.
!!Use the blue up/down buttons to scroll the list until the pointer is
pointing at Meter.
!!Press the green button to select Meter. The blue up/down buttons
can be used to scroll and view data from the active sensors.
!!Press the red button to exit Meter mode and return to the main menu.
Use the green triangle
button (enter) to select
the mode required
Use the blue triangle (scroll)
button to move the list down
Use the blue triangle (scroll)
button to move the list up
Use the red square as a
stop/back button (to return
to the previous screen)
Use the blue up/down
buttons to scroll and
view data from the
attached sensors

Set sensor range
Some Smart Q sensors have multiple ranges e.g. sound can be in decibels (dBA) or milli volts (mV).
The range of a sensor can be altered whilst in Meter mode.
!!Whilst in Meter use the blue up/down buttons to scroll through the list
until the pointer is pointing at the appropriate sensor.
!!Press the green button to view the ranges available.
Note: If there isn’t a choice of range available for the selected sensor then pressing enter will have no effect.
!!An asterisk * will indicate the present range selected. Use the blue
up/down buttons to scroll the list until the pointer is pointing at the
required range.
!!Press the green button to select the range and return to Meter.
Snapshot
Snapshot mode enables you to capture sensor readings every time the green button is pressed,
rather than at a regular time intervals. The readings are stored as a data set in EASYSENSE Q
Advanced’s memory.
!!Connect the sensors. If the display is turned off, press any button to wake up EASYSENSE Q
Advanced.
!!Use the blue up/down buttons to scroll through the menu until the
pointer is pointing at Snapshot.
!!Press the green button to select Snapshot.
!!Each data sample can be given a name/number e.g. the location at which the sample was taken.
Use the blue up/down buttons to select from either yes or no for this option.
10

11
!!From now on each time you press the green button on EASYSENSE
Q Advanced; a reading will be taken from all sensors connected.
EASYSENSE Q Advanced will display the number of samples taken so
far and the current value from the sensors.
The blue up/down buttons can be used to scroll and view data from the list
of sensors.
If yes to ‘name each sample’ was selected a window
will open for adding a comment to the sample. Use
the blue up/down buttons to scroll through the
letters and numbers. Press the green button to
select as appropriate.
The list starts each time at the same point; use the up button to go through the
numbers, and the down button to go through the alphabet.
Select the symbol (two presses up from ‘a’) to delete a mistake.
Press the red button when you have finished entering your comment. This
will take you back to the ‘samples taken’ window ready to take the next sample.
Note: If more than 2 minutes have elapsed between readings, EASYSENSE Q Advanced will
go into ‘sleep’ mode. Press any button to wake up the unit and then press to take a reading.
!!When you have finished sampling press the red button to close the data set,
then green to confirm your choice and enter the Recording finished menu.
!!Press the green button to return to the Main Menu, or scroll to Repeat the
experiment or Name the data set.
Repeat experiment will take you direct to the
Samples taken window (the choice of whether to
name or not name each sample will still apply).
Name data set will open a window in which text or
numbers can be selected for the name of the data
set. Use the blue up/down buttons to scroll
through the letters and numbers. Press the green
button to select as appropriate.
Press the red button to finish and go to the recording finished menu.
!!The readings taken will be stored as a data set. Over 1000 samples can be
stored in one data set. The data set can be downloaded to the computer for
display and analysis using Retrieve remote from the Home page in the
EASYSENSE program.
)
(
#
/
=
*_
+
%
0
9
8
7
6
5
4
3
2
1
.
a
b
c
d
e
f
g
h
i
j
k
l
m
n
o
p
q
r
s
t
u
v
w
x
y
z
‘
:
?
&
@
/
(
)
delete
space

Easy Log
In Easy Log it is not necessary to set the duration of the recording – EASYSENSE Q Advanced will
capture data until stopped (up to a maximum of 41 days). The data set will then be stored in
EASYSENSE Q Advanced’s memory.
!!Connect the sensors. If the display is turned off, press any button to wake up EASYSENSE Q
Advanced.
!!Use the blue up/down buttons to scroll though the menu until the
pointer is pointing at EasyLog.
!!Press the green button to select EasyLog and automatically begin
recording.
The bottom line of the LCD screen is a visual indicator of the logging as
it takes place.
The blue up/down buttons can be used to scroll and view the values from the sensors on the
LCD screen whilst still logging.
Note: If more than 2 minutes have elapsed between readings, EASYSENSE Q Advanced will go into ‘sleep’ mode.
Press any button to wake up the unit.
!!When the experiment is complete press the red button. Q Advanced will continue to log data
until you press the green button to confirm your choice and go to the Recording finished .
menu.
Note: If the Stop button was not pressed intentionally, press the red button to continue logging.
!!Press the green button to return to the Main Menu, or scroll to Repeat .
the experiment or Name the data set.
Repeat experiment will take you back to EasyLog in the Main Menu.
Name data set will open a window in which text or numbers can be
selected for the name of the data set. Use the blue up/down
buttons to scroll through the letters and numbers. Press the green
button to select as appropriate.
Press the red button to finish and go to the recording finished menu.
12

13
!!The data recorded will be stored as a data set. The data set can be downloaded to the
computer for display and analysis using Retrieve remote from the Home page in the
EASYSENSE software.
EASYSENSE Q Advanced records data at a rate of 40 samples per second until it has captured
1000 samples. At this point, the sample rate halves (i.e. 20 samples per second) and alternate
samples are discarded (leaving 500 samples). It will continue at this speed until it has captured
another 500 samples (1000 total), then the sample rate halves again (i.e. 10 samples per second)
and it discards half the stored data, and so on. See page 28 for full details.
In EasyLog mode the EASYSENSE Q Advanced will stay awake until the interval between readings
reaches 5 seconds or greater – at this point it will begin to sleep between samples to conserve
battery power. When EASYSENSE Q Advanced is asleep, sensor readings can be viewed by
pressing any button to ‘wake’ it up.
Press the green button while still logging to see a logging summary i.e.
samples taken, elapsed time, current logging interval and the time started.
Press again to return to the normal screen.
When the sample interval is greater than or equal to one second (i.e. after logging for 8 minutes and
20 seconds), it is possible to download data from EASYSENSE Q Advanced to a computer (without
interrupting the recording) using Retrieve remote from the Home page in the EASYSENSE software.
The maximum duration of any one Easy Log recording is 41 days (1000 hours - 1000 readings at a
1 hour interval).
Note: If you would prefer to record for a specified time span then set up Q Advanced using Logging (see below) or the
Setup remote option in the EASYSENSE software.
Logging
In Logging mode, the total recording time, interval between readings and trigger condition can be
set. The data set collected will be stored in EASYSENSE Q Advanced’s memory.
Example of logging using enter as the trigger - see page 33 for the full menu.
!!Connect the sensors. If the display is turned off, press any button to wake up EASYSENSE Q
Advanced.
!!Use the blue up/down buttons to scroll though the menu until the
pointer is pointing at Logging. Press the green button to select.

!!Line 2 - Scroll through the choices to find a suitable duration of
recording from those available (a full list of the choices is on page 29-32).
Press the green button to select.
!!Line 3 - Scroll through the choices to find a suitable interval between
each sample. Press the green button to select.
The number of samples will automatically alter as the time duration and interval between
samples are selected.
!!Select the start condition required from the following choices:
1. ‘When pressed’ – logging will be started by pressing the green
button.
2. ‘at date & time’ – the recording will start at the time and date specified.
3. ‘sensor rises’ - logging will not start until the value from a sensor rises above a set level.
4. ‘sensor falls’ - logging will not start until the value from a sensor falls below a set level.
When pressed
Use the blue up/down buttons to scroll though the menu until the pointer is pointing at ‘When
pressed’. Press the green button to select.
Press the green button on the EASYSENSE QAdvanced unit and
logging will start.
At date & time
Note: When you select this option the LCD screen will show time, date, and the date format currently set. If these
are not correct change the settings in the System menu (see page 21).
Use the blue up/down buttons to scroll though the menu until the pointer is pointing at ‘at date
& time’. Press the green button to select.
Set the time and date that you want the recording to start:
!!Use the blue up/down buttons to select the correct hour (using the
24 hour clock), press to select, repeat for minutes and then seconds.
!!Use the blue up/down buttons to select the correct day, press to select, repeat for month
and then year.
Logging will not start until the date and time selected have been reached.
14

Sensor rises above or falls below
Use the blue up/down buttons to scroll though the menu until the
pointer is pointing at ‘sensor rises’ or ‘sensor falls’ as appropriate. Press
the green button to select.
Scroll though the connected sensors until the pointer is pointing at the
sensor that will be used as a trigger. Press the green button to select.
Enter the level at which the sensor will trigger the start - use the blue
buttons to scroll up or down through the numbers. Press the green
button to select a number. When the trigger level is selected press the
red button.
Note: The list starts each time at the same point (a space); use the up button to go through
the numbers, and the down button to delete (), decimal place and minus sign.
Press the green button to confirm your choice.
Logging will not start until the value rises above or falls below the set
level as appropriate.
Pre-trigger
If ‘sensor rises’ or ‘sensor falls’ has been selected as the trigger event
and the selected logging duration/interval is fast enough, an option to
set a pre-trigger will be available [None, 25%, 50%, 75%, and 100%].
Pre-trigger will cause a percentage of samples to be taken before the trigger condition is met and
the remainder to be taken afterwards e.g. if 1,000 readings are to be taken and a 25% pre-trigger
is selected, 249 readings will be taken before the trigger condition is met.
If pre-trigger readings are not required leave the selection as None.
Scroll through the choices and press the green button to select.
!!Recording will start as soon as the trigger condition is reached. The bottom line of the LCD .
screen is a visual indicator as logging progresses (each square takes a 20th of the selected
duration to fill in).
15
Rises above
Logging will not start until the
value rises to above the set level.
Falls below
Logging will not start until the
value falls to below the set level.
Delete a
mistake
9
8
7
6
5
4
3
2
1
0
.
-

!!When the recording is complete the LCD will show the ‘recording finished’
menu and the data recorded will be stored as a data set.
Either press the green button to return to the Main Menu, or scroll to
Repeat the experiment or Name the data set.
Repeat experiment will enable you to repeat the experiment with the same settings. If a date &
time trigger was selected, you will return to the ‘start when’ window so you can set a new time.
Name data set will open a window in which text or numbers can be
selected for the name of the data set. Use the blue up/down buttons
to scroll through the letters and numbers. Press the green button to
select as appropriate.
The list starts each time at the same point; use the up button to go through the numbers, and the
down button to go through the alphabet.
Press the red button to finish and go to the recording finished menu.
!!The data set can be downloaded to the computer for display and analysis using Retrieve
remote from the Home page in the EASYSENSE software.
While recording with a sampling interval of 20ms or more, the blue up/down buttons can be used
to scroll and view the sensor readings on the LCD screen whilst still logging.
If recording over a long duration EASYSENSE Q Advanced will sleep between samples to conserve
battery power. Press any of the buttons to ‘wake up’ the unit so the current value from the sensors
can be viewed.
While logging press the green button to see a logging summary i.e.
samples taken, the time elapsed since the recording was started, the current
logging interval and the time started (using the date and time set in the Q
Advanced’s clock as a reference). Press again to return to the normal
screen.
To stop logging before the duration is complete, press and then to confirm.
When the sample interval is greater than or equal to one second, it is possible to download data
from EASYSENSE Q Advanced (without interrupting the recording) using the Retrieve remote option
in the EASYSENSE software.
For very fast sample rates there is a limit to the number of sensors that can be connected, this is
indicated in the maximum sensors column. For slower rates the internal temperature sensor and up
to six external sensors can be used.
The following Smart Q Sensors are not able to provide readings at intervals of less than 20ms (50
Hz): Ohaus Scout Pro Top-pan Balance Adapter (Product No. 3060), Carbon Dioxide Gas Sensor
(Product No. 3152), Drop Counter and Bubble Sensor (Product No. 3266), Geiger Muller Sensor
(Product No. 3265), Heart Rate and Pulse Waveform (Product No. 3147), Motion Sensor (Product
No.3705 or 3270) and the Polar Heart Rate Exercise Sensor (Product No. 3148).
16

Time & Motion
Used to setup and store time measurement from either one digital sensor connected to Input 5:A, or
two connected to Input 5:A and Input 6:B.
Digital switch type sensors e.g. Light Gates, have two states ON (low) or OFF (high).
For EASYSENSE QAdvanced to be able to calculate Speed, Velocity or Acceleration, it needs
information about the dimensions of the interrupt used in an investigation. The choice of interrupt
and its dimensions are preset in EASYSENSE QAdvanced’s memory. See page 18 for the list of
interrupts and the choice of preset dimensions e.g. a single interrupt card can be 30, 40, 50, 95, 100
or 120 mm in length.
Example using Time at A - see page 34 - 40 for further details.
!!Either connect a digital sensor to Input 5:Aor a pair of digital sensors to Input 5: Aand 6:B. If the
display is turned off, press any button to wake up EASYSENSE Q Advanced.
!!Use the blue up/down buttons to scroll the menu until the pointer is
pointing at Time & Motion. Press the green button to select.
!!Use the blue up/down buttons to scroll the menu until the pointer is
pointing at Time, Speed or Acceleration as appropriate. Press the green
button to select.
!!Use the blue up/down buttons to scroll the sub menu until the pointer is pointing at the option
required. Press the green button to select.
17
Speed at A = Length of single interrupt card
Time
—-Time menu —
Stopwatch A to A
Time at A
Time at A or B
Time from A to B
Period at A
-Acceleration menu-
Accel. at A
Accel. A to B
—-Speed menu —
Speed from A to B
Speed at A
Speed at A or B
3 Speeds at A or B

!!If Speed or Acceleration is selected, the choice of interrupt and its measurement will be:
See page 34 - 40 for further information.
Line 2 - If you are measuring Speed or Velocity at A, scroll through the
list of interrupters to find the type you are going to use. Press the green
button to select.
Line 3 - Scroll through the list of dimensions and select the one to be the used. Press the green
button to select.
!!EASYSENSE Q Advanced will be ready to start taking measurements. When a signal change
from the digital sensor/sensors is received, the timing measurement will be displayed in seconds
(s) on the LCD screen.
Example:
18
Line 1 – What is
being measured Line 2 – Interrupter Line 3 – Measurements available to select
Speed at A 1 Interrupt card Length of card = 30, 40, 50, 95, 100 or 120 mm
2 Interrupt card Length of segment = 30, 40, 50, 95, 100 or 120 mm
Picket fence Pitch (width of black + clear stripe) = 10, 20, 40, 60 or
80 mm
10 Spoked pulley For use with the Data Harvest Spoked pulley
(Product No 3177), which has a 47 mm diameter
Speed at A or B 1 Interrupt card Length of card = 30, 40, 50, 95, 100 or 120 mm
3 Speeds at A or B 1 Interrupt card Length of card = 30, 40, 50, 95, 100 or 120 mm
Speed from A to B Distance A to B
Distance between A and B =
100, 200, 300, 400, 500, 600, 700, 800, 900 mm, 1.0, 2.0,
3.0, 4.0, 5.0, 6.0 m
Accel. at A 2 Interrupt card Length of segment = 30, 40, 50, 95, 100 or 120 mm
Picket fence Pitch (width of black + clear stripe) = 10, 20, 40, 60 or
80 mm
10 Spoked pulley For use with the Data Harvest Spoked pulley
(Product No 3177), which has a 47 mm diameter
Accel. A or B 1 Interrupt card Length of card = 30, 40, 50, 95, 100 or 120 mm

The second line shows the current reading, the # number indicates the number of the reading.
The blue up/down buttons can be used to scroll back and forward through the readings
already taken, the # number will indicate the reading number of the measurement shown.
The bottom line shows the average measurement and number of readings used to calculate this
average.
Note: Whilst recording in this mode, EASYSENSE Q Advanced will stay awake.
!!Press the red button to finish or cancel timing.
!!The LCD will show the ‘recording finished’ menu and the data set will be stored.
Either press the green button to return to the Main Menu, or scroll to
Repeat the experiment or Name the data set.
Repeat experiment will take you direct back to the recording window.
Name data set will open a window in which text or numbers can be
selected for the name of the data set. Use the blue up/down buttons
to scroll through the letters and numbers. Press the green button to
select as appropriate.
The list starts each time at the same point; use the up button to go through the numbers, and the
down button to go through the alphabet
Press the red button to finish and go to the recording finished menu.
!!The data set can be downloaded to the computer for display and analysis using Retrieve remote
from the Home page in the EASYSENSE software.
19

Downloading stored data sets into the EASYSENSE software
!!Connect the EASYSENSE Q Advanced unit to the
computer and open the EASYSENSE program.
!!Select the Retrieve remote option from the Home
page.
!!Select the data set from the list and click on
Retrieve.
Note: The most recent data set is first in the list.
System Menu
Use the blue up/down buttons to scroll the menu until the pointer is
pointing at System. Press the green button to select.
!!Use the blue up/down buttons to scroll the menu until the pointer is
pointing to the appropriate system menu item. Press the green
button to select.
1. No Bluetooth or Bluetooth
If Bluetooth has been built-in it will show listed as Bluetooth. If not then the System menu will show
‘No Bluetooth’.
Bluetooth On/Off:
Shows the status of Bluetooth. Use the blue up/down buttons to scroll
between ON and OFF.
When the Bluetooth device is active the Bluetooth indicator LED will blink
(a fast blink indicates data is being transferred).
Note: Bluetooth cannot be switched on until EASYSENSE Q Advanced has been paired with a computer.
Pair Blue tooth (See page 43).
This will initiate the blue tooth pairing process on the logger. The logger will attempt to pair with
another Bluetooth device for 2 minutes, giving time for the PC Bluetooth services to be started.
During the Pairing process the screen will show;
1. ID: this is the EASYSENSE QAdvanced’s serial number.
2. Passkey: All EASYSENSE QAdvanced units have a passkey of 1234. The pass key must be
used and cannot be changed.
20
Most recent
Older data sets
Table of contents
Other Data Harvest Data Logger manuals
Data Harvest
Data Harvest EASYSENSE V-Hub User manual
Data Harvest
Data Harvest EASYSENSE Vu+ User manual
Data Harvest
Data Harvest EASYSENSE V-Log User manual
Data Harvest
Data Harvest DS186 User manual

Data Harvest
Data Harvest EASYSENSE V-Log User manual
Data Harvest
Data Harvest EasySense Q 3 User manual
Data Harvest
Data Harvest EASYSENSE Q3+ User manual
