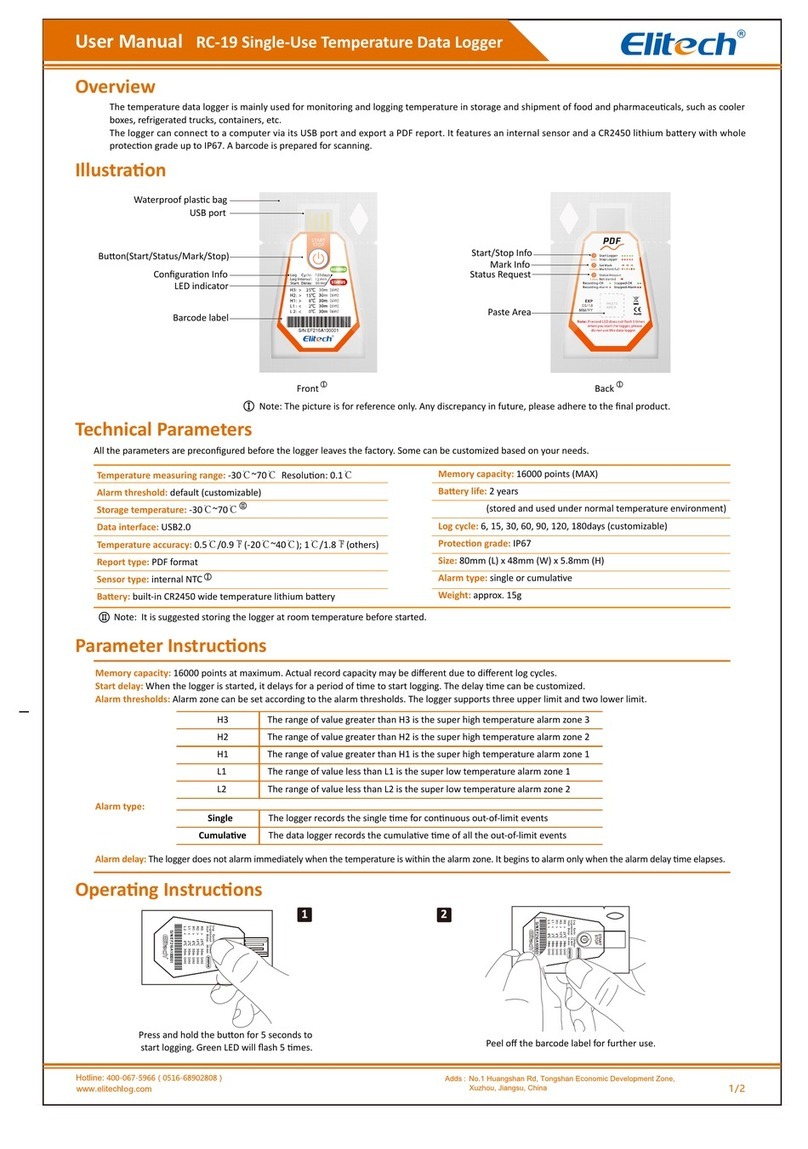
• Trip Description - enter information as required
• Repeat Start - Enable/Disable
• Circular Logging - Enable to overwrite logger data
when full or Disable to stop.
• Alarm Settings - Select No Alarm or Multiple Alarms
to select alarm thresholds required. Click on Alarm
checkbox required for either or both upper H1 and
lower L1 temperature alarm threshold limits. Enter
Alarm Thresholds Temperatures and Alarm Type
(Single or Cumulative)
• Set Alarm Delay period if required
3. When complete click on ‘Save Parameter.’
4. A dialog box will appear to conrm all logger data will be
erased.
5. A “Parameters set successfully” message will appear.
Remove the logger from the computer.
Start Recording
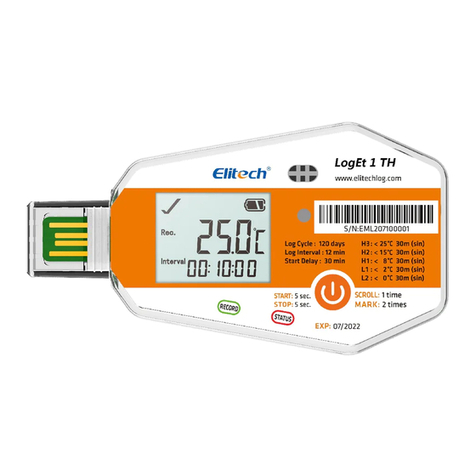
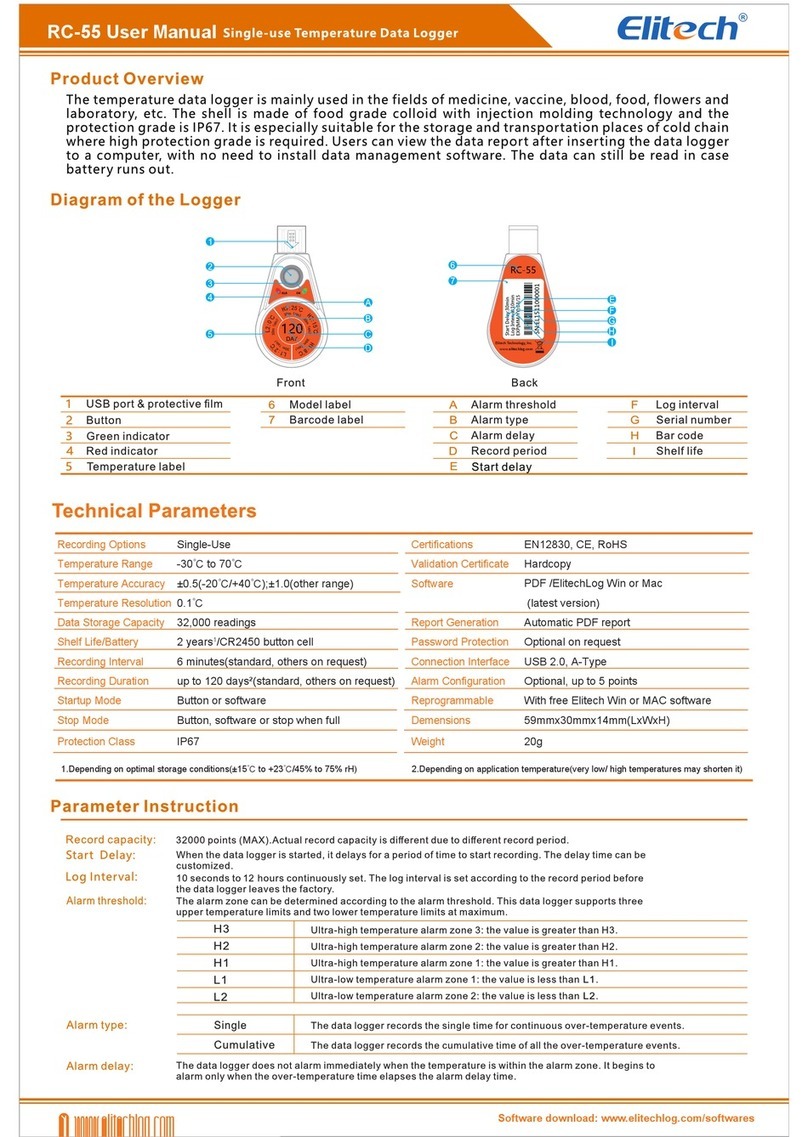
1. Press and hold the button for 5 secs to start the
logger until shows on the screen. The logger will start
logging once the Start Delay period set has elapsed.
2. Replace the cover and place it where it is required for
logging.
View logger information at any time
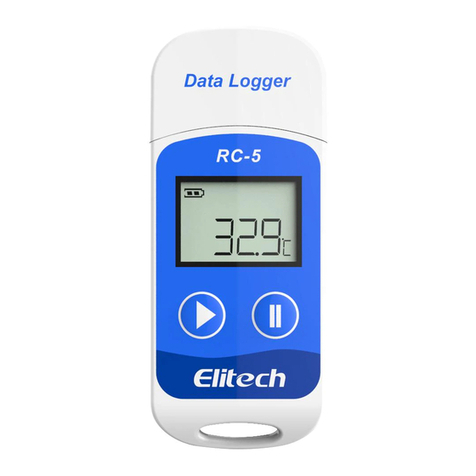
1. Press and release to shift between display interfaces to
view information at any time.
2. Pressing the button will scroll through to show:
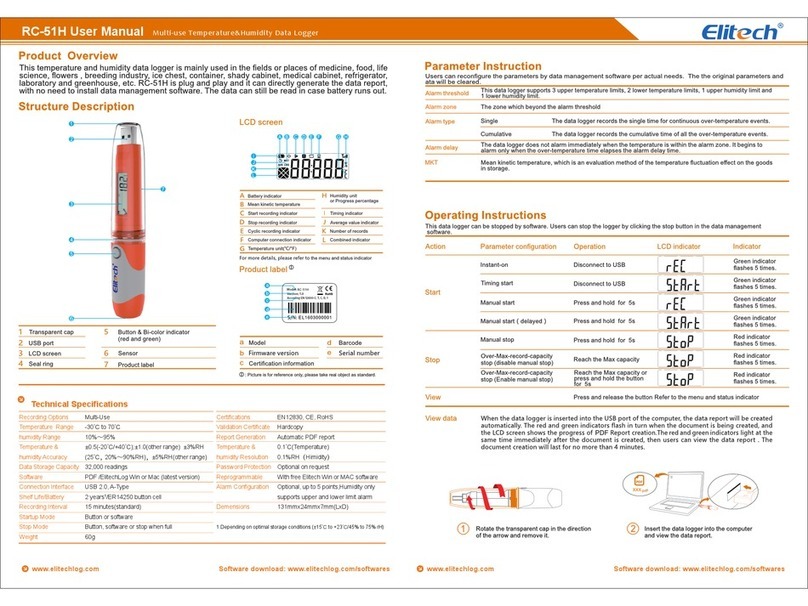
• current temperature
• number of readings
• current time HH:MM
• date MM:DD
• maximum temperature recorded,
• minimum temperature recorded
• maximum temperature thresholds set.
• minimum temperature thresholds set.
Stop Recording
1. Press and hold for 5 secs to stop the logger until
shows in the logger screen. The logger has now stopped
logging.
Download Data
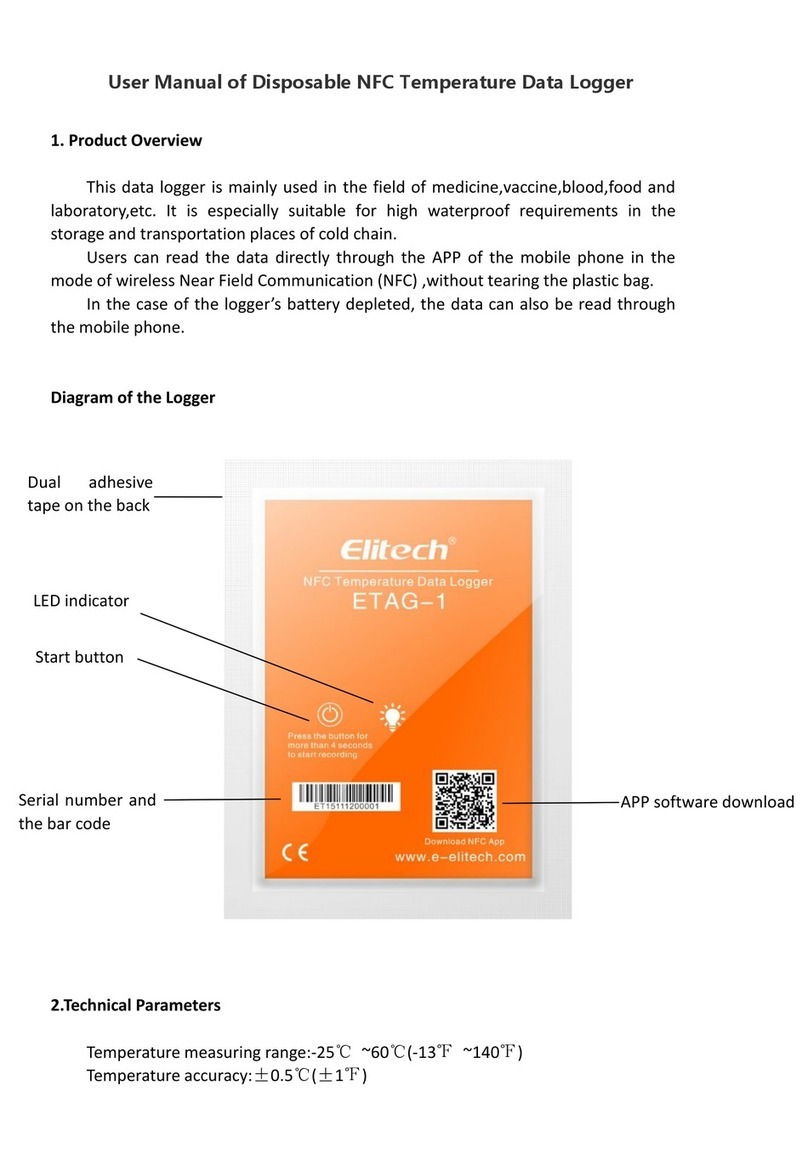
1. Remove the lid from the data logger and plug it into a
USB port on your PC.
2. Open the Elitech software and wait for the USB to be
recognised.
3. The software will open on the summary page and display
the device’s information. This page will show the statistical
information recorded on the logger.
This page provides:
• number of readings.
• the time of the rst and last readings.
• mean kinetic temperature.
• maximum temperature.
• minimum temperature.
• average temperature.
• time of the rst alarm (if any).
To view a complete breakdown of the data, select ‘Graph’
from the menu at the top of the screen. A graph will appear
displaying all the measured readings.

