energlaze ZAPPI User manual

eco-smart EV charge point
Understand your
ZAPPI EV charger
Operation
zappi
1
Operation
Controls & Indicators
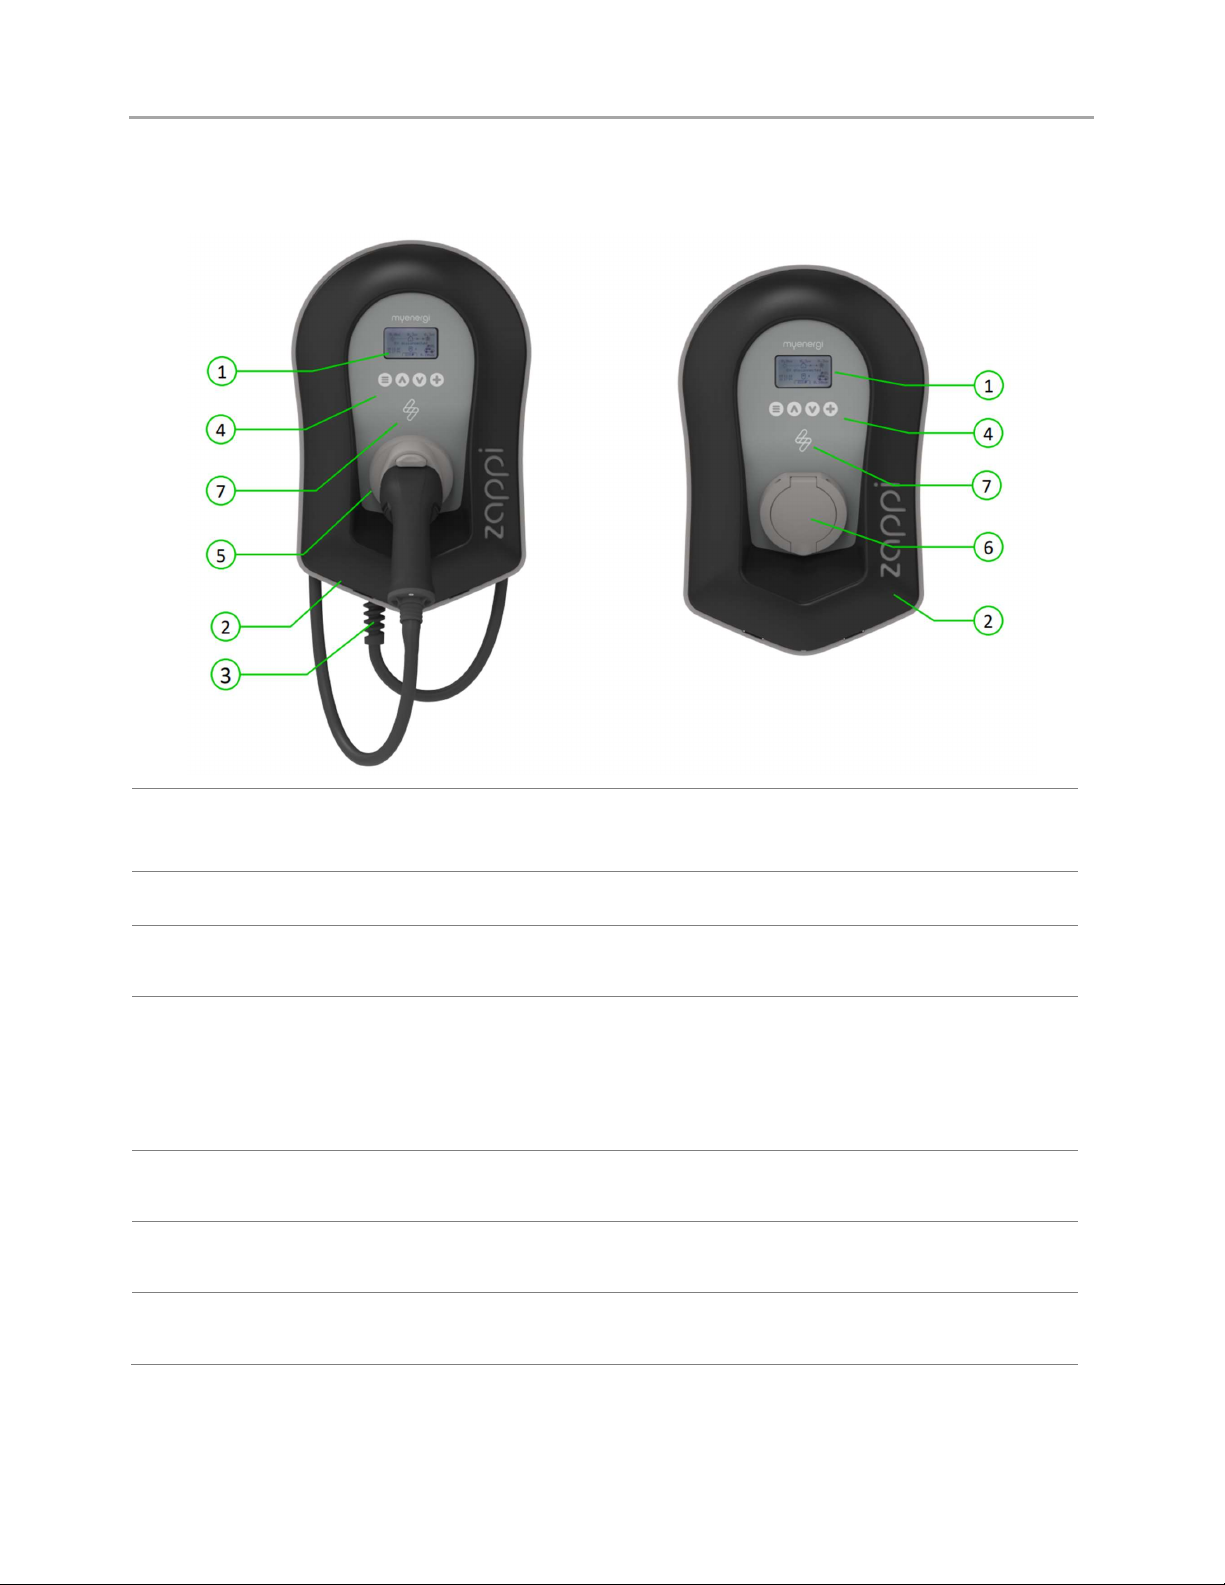
1. Display Graphical LCD display with LED backlight
Backlight can be activated by tapping the unit.
2. Front Fascia Remove fascia for installing and servicing
3. Tethered Charging Cable if
applicable 6.5-meter cable with a Type 2 plug or Type 2 socket with locking system
for untethered models.
4. Control Buttons Four tactile buttons used to navigate the menus and alter settings:
Menu
Change charge mode | Move up a menu item | Increase value
Change charge mode | Move down a menu item | Decrease value
Boost | Select item | Confirm value and move to next setting.
5. Integrated Cable Holster
(tethered units only) When not in use, the charging cable should be wrapped around the unit and
secured in the cable holster (tethered units).
6. Charging Connection Point
(untethered units) When cable not in use, the charging cable should be unplugged and stored
in a cool dry place.
7. RGB Indicator Visual Indicator that changes colour dependant on the zappi's charging
state. (see RGB Indicator page 9)
Operation
2
zappi
Display
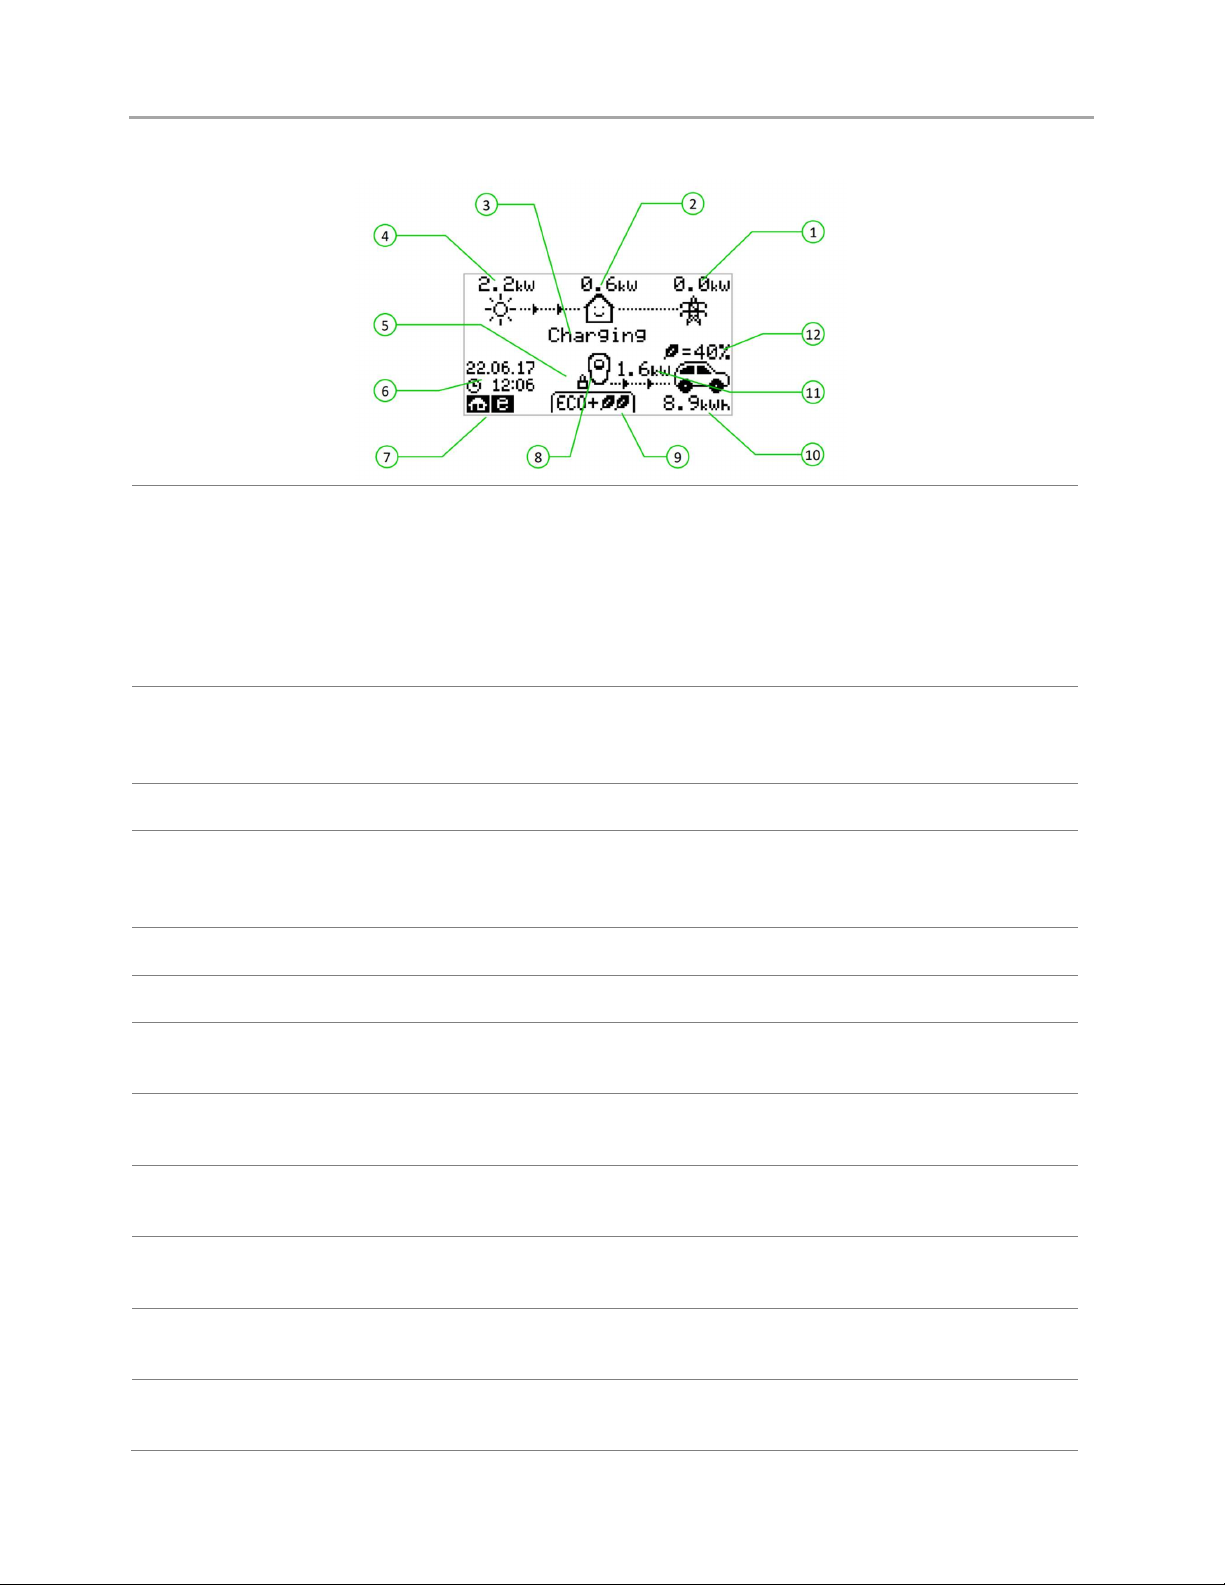
1. Import / Export Power The power being either imported or exported from or to the grid (kW). The
direction of the arrows indicates if the property is currently importing
power (left) or exporting power (right).
The size of the arrows is proportionate to the level of power being imported
/ exported, When the property is neither importing or exporting power the
figure will be 0.0kW and there will no animated arrows. The property is then
said to be 'in balance'.
2. House Load Power The power that the property is currently using in kW. (Note: This is displayed
only when the Generation Sensor is installed directly to a CT input or a
harvi
or other
myenergi
device)
3. Status Text The current status is displayed here (see Status Screens Page 12).
4. Generation Power The power being generated at this time in kW. (Note: This is displayed only
when the CTs are installed either hard wired to the CT inputs of the
zappi
or
wirelessly to a
harvi
or other
myenergi
device)
5. Lock Icon Operation lock is active.
6. Date & Time The current date and time.
7. Mode Icons These icons indicate that the import limiting is active (house), Demand Side
Response (~) or the eSense input is live (e) see page 44.
8. zappi Icon If you see wavy lines above the zappi icon, the unit is thermally limiting!
The output power is temporarily reduced.
9. Charge Mode Shows the selected Charging Mode; FAST, ECO or ECO+ (see Charging
Modes page 14).
10. Charge Delivered to EV The accumulated charge energy that has been sent to EV in this charge
session.
11. Current Charging Power When the EV is charging, arrows will show here along with the charging
power in kW.
12. Green Level of Last Charge This is the percentage of 'Green' energy for the last charge session, this is
shown at the end of a charge or when the EV is unplugged.
Operation
zappi
3
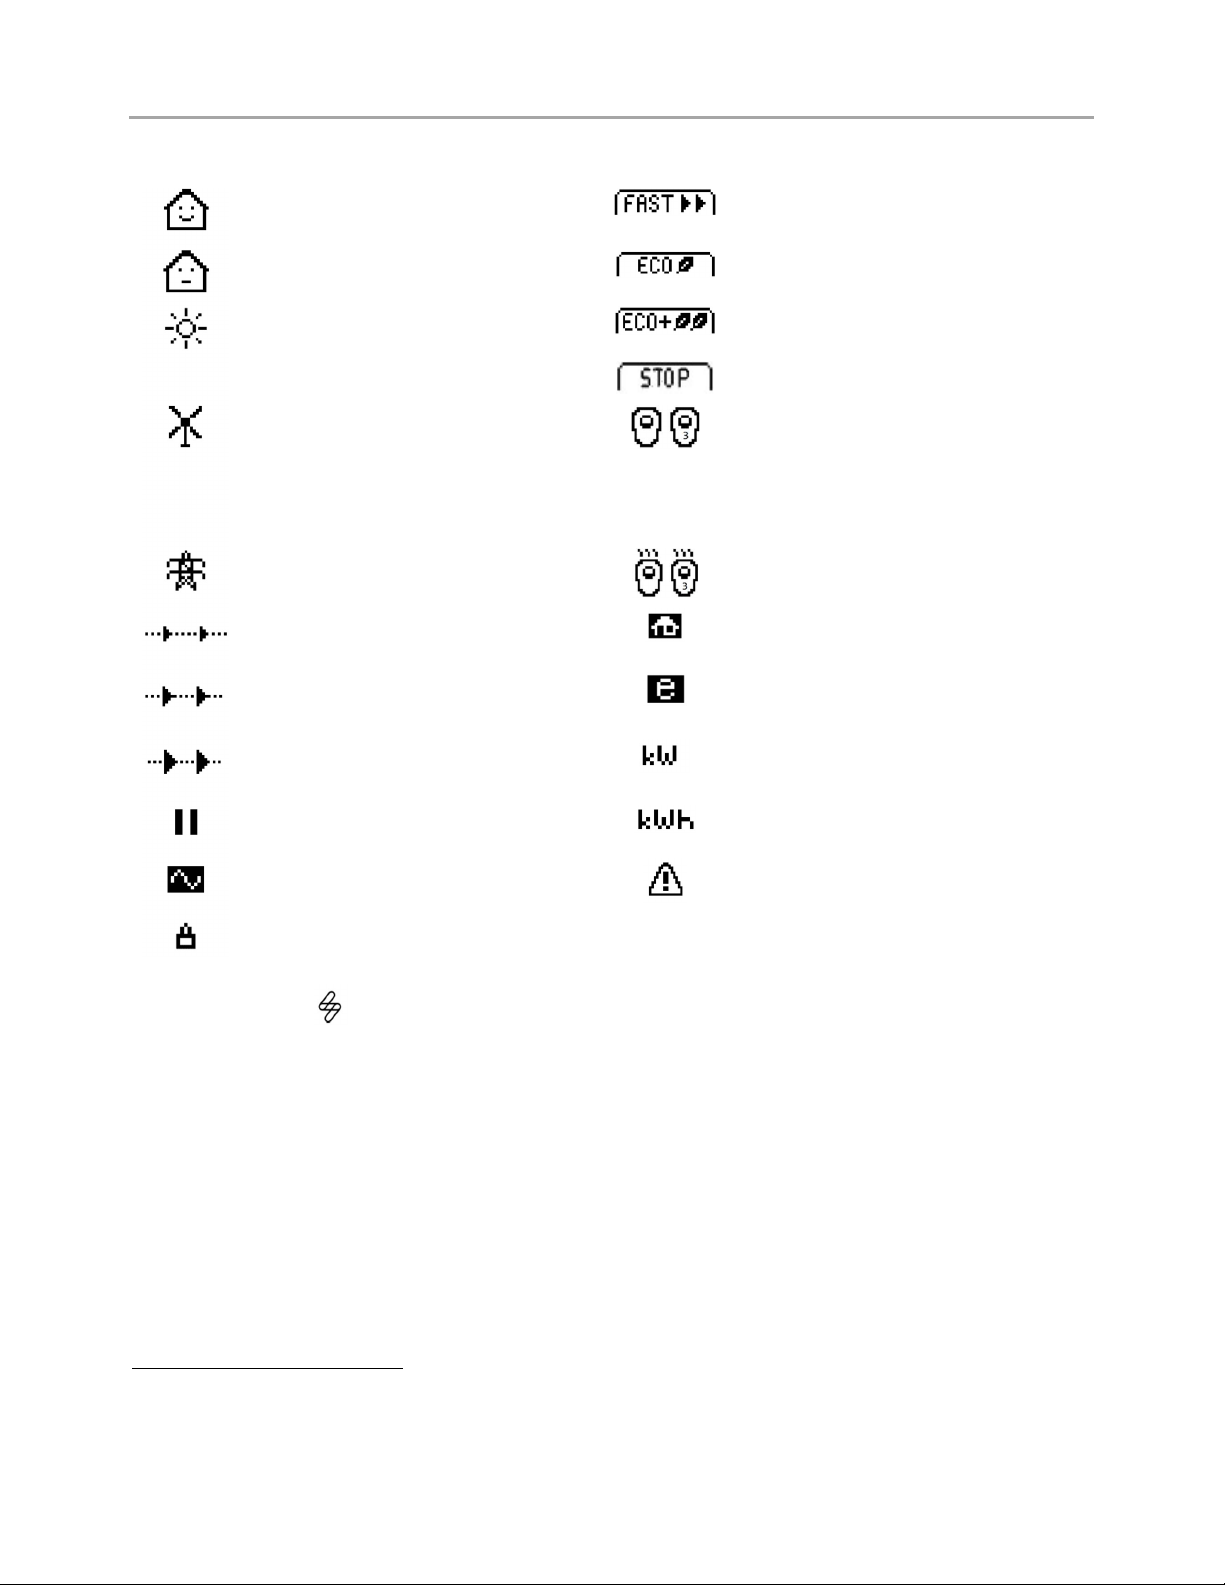
Display Icons Key
House Consumption
–
Not Importing
Charge Mode = FAST
House Consumption
–
Importing
Charge Mode = ECO
Solar Generation Power
Charge Mode = ECO+
Charge Mode = STOP
Wind Generation Power
zappi
Device
–
Normal
On the three phase zappi the number in
the icon indicates whether the EV is
charging with a single phase or all three
phases.
Grid Power
–
Import / Export
zappi
Device
–
Too Warm (output
limited)
Power Flow Direction
–
Small Amount
Import Power Limiting Active
Power Flow Direction
–
Medium Amount
Economy Tariff Electricity Available
Power Flow Direction
–
Large Amount
Current Charging Power
Waiting for Surplus Power
Energy sent to EV for this charge
DSR Mode (demand
-
side
response
)
2
Warning
–
refer to text on screen
Lock icon
–
zappi
or cable locked
(untethered versions only)
RGB Indicator
The lighting flash indicator on the front of the zappi indicates the status of the charge. The default colours are:
Pink: Connected
Green: Charging 100% Green
White: Charging from Grid only
Yellow: Charging mix of grid/green energy
Blue: Charge complete
Red: Error
These colours can be adjusted on Display & Sound menu (firmware version 2.163 onwards)
The colour effect (pulsing of the LED brightness) varies according to the charging power
2 DSR – Demand Side Response – A smart feature for future use by electricity suppliers and distribution companies
to help manage load on the electricity system at times of high demand. This feature can only be enabled by the owner
of the zappi
Operation
4
zappi
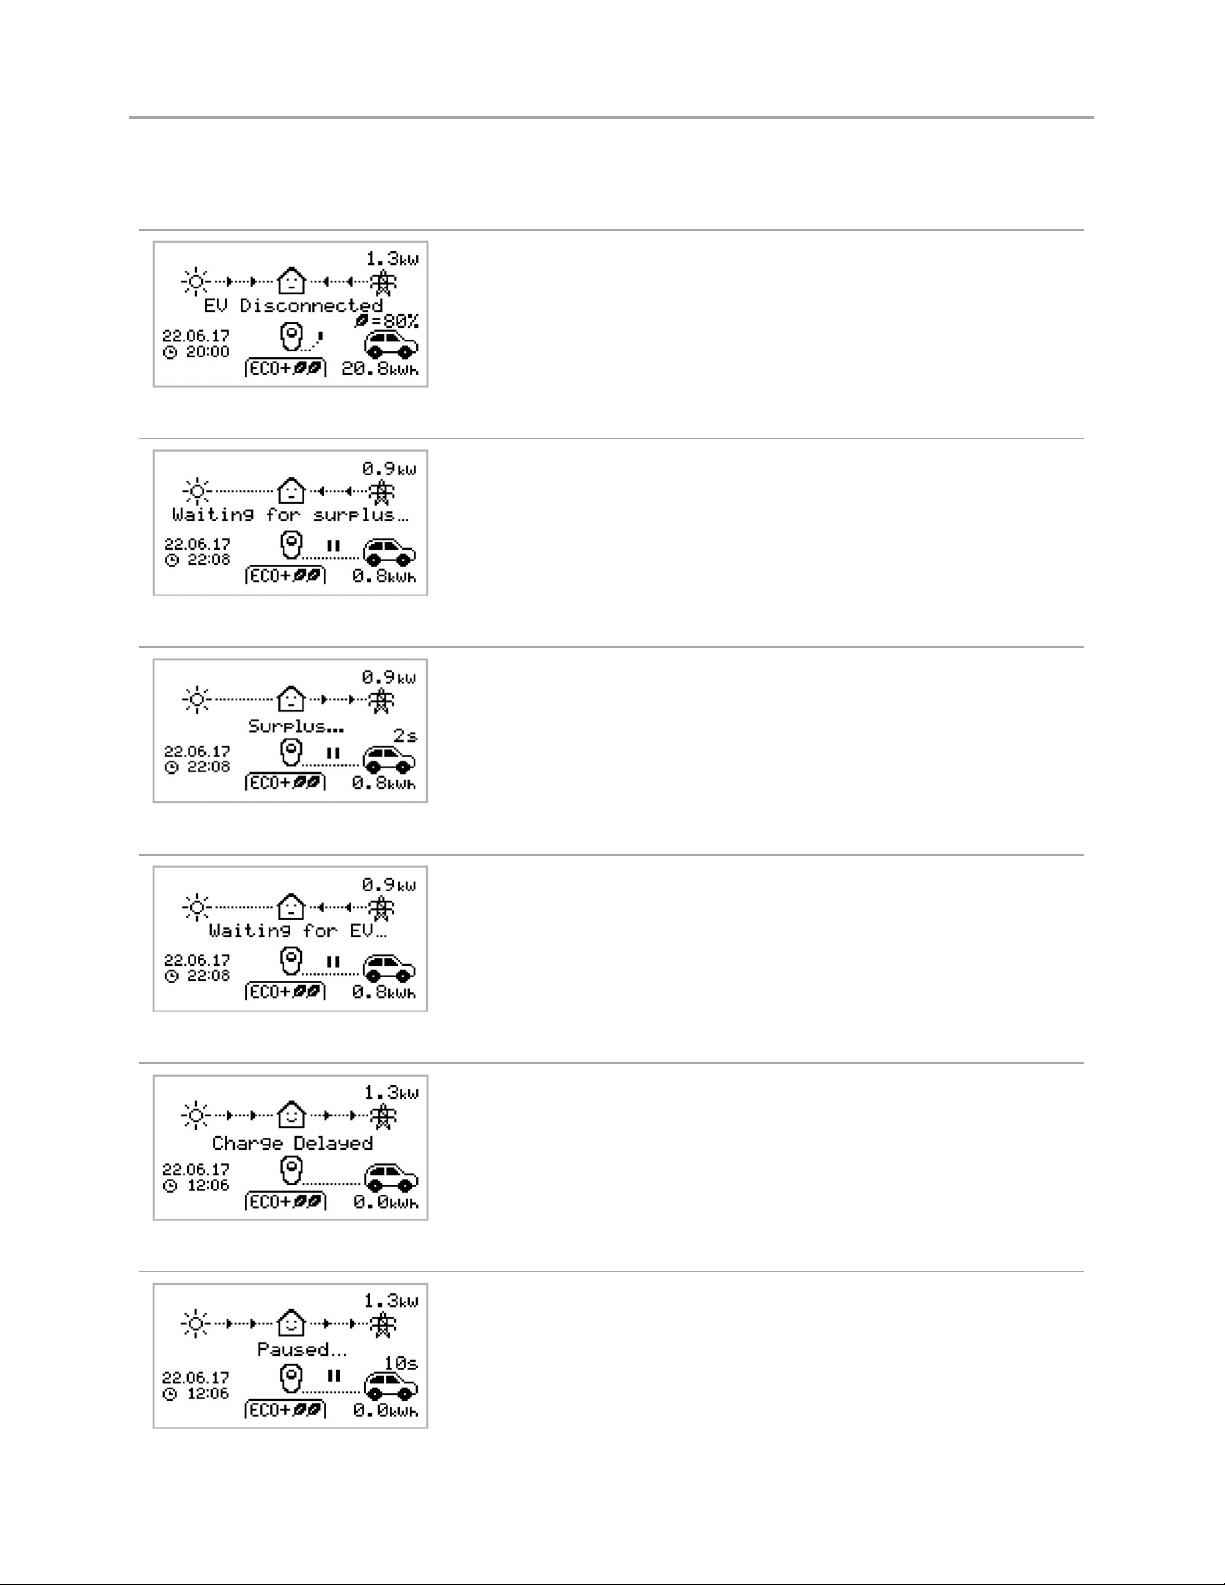
Status Screens
EV Disconnected
The EV is not connected to
zappi
.
In this example the last charging session delivered 20.8kWh of energy
to the EV and 80% of that energy came from the solar panels.
Waiting for Surplus
zappi
is waiting for sufficient surplus power from the microgeneration
system. This screen will be shown in ECO+ mode as it is only in this
mode that charging will stop if there is not enough surplus power.
The house in the centre is straight-faced as grid electricity is being
used by the house (0.9kW in the example shown).
Surplus
Enough surplus is available and
zappi
is about to charge the EV. A
timer is decremented and can be set in the charge settings (ECO+
mode only).
Waiting for EV…
zappi
is waiting for the EV to respond; the EV is not ready to accept
charge.
Charge Delayed
The charging session has
been delayed by the EV because a scheduled
charge has been set in the vehicle.
Paused…
zappi
is paused for a few seconds in order to limit the start/stop
frequency during ECO+ mode charging.
Table of contents
Popular Automobile Accessories manuals by other brands


ULTIMATE SPEED
ULTIMATE SPEED 279746 Assembly and Safety Advice

SSV Works
SSV Works DF-F65 manual

ULTIMATE SPEED
ULTIMATE SPEED CARBON Assembly and Safety Advice

Witter
Witter F174 Fitting instructions

WeatherTech
WeatherTech No-Drill installation instructions

TAUBENREUTHER
TAUBENREUTHER 1-336050 Installation instruction