ForaCare FORA 6 Plus Installation guide

Version: Rev 4.2
Release date: 07 Nov. 2019
Editor: Dean Chiu
ForaCare Suisse AG
Blood Glucose and Multi-Functional
Monitoring System FAQs

2/65
Table of contents
General Blood Glucose Meter questions………………………………………………… 2
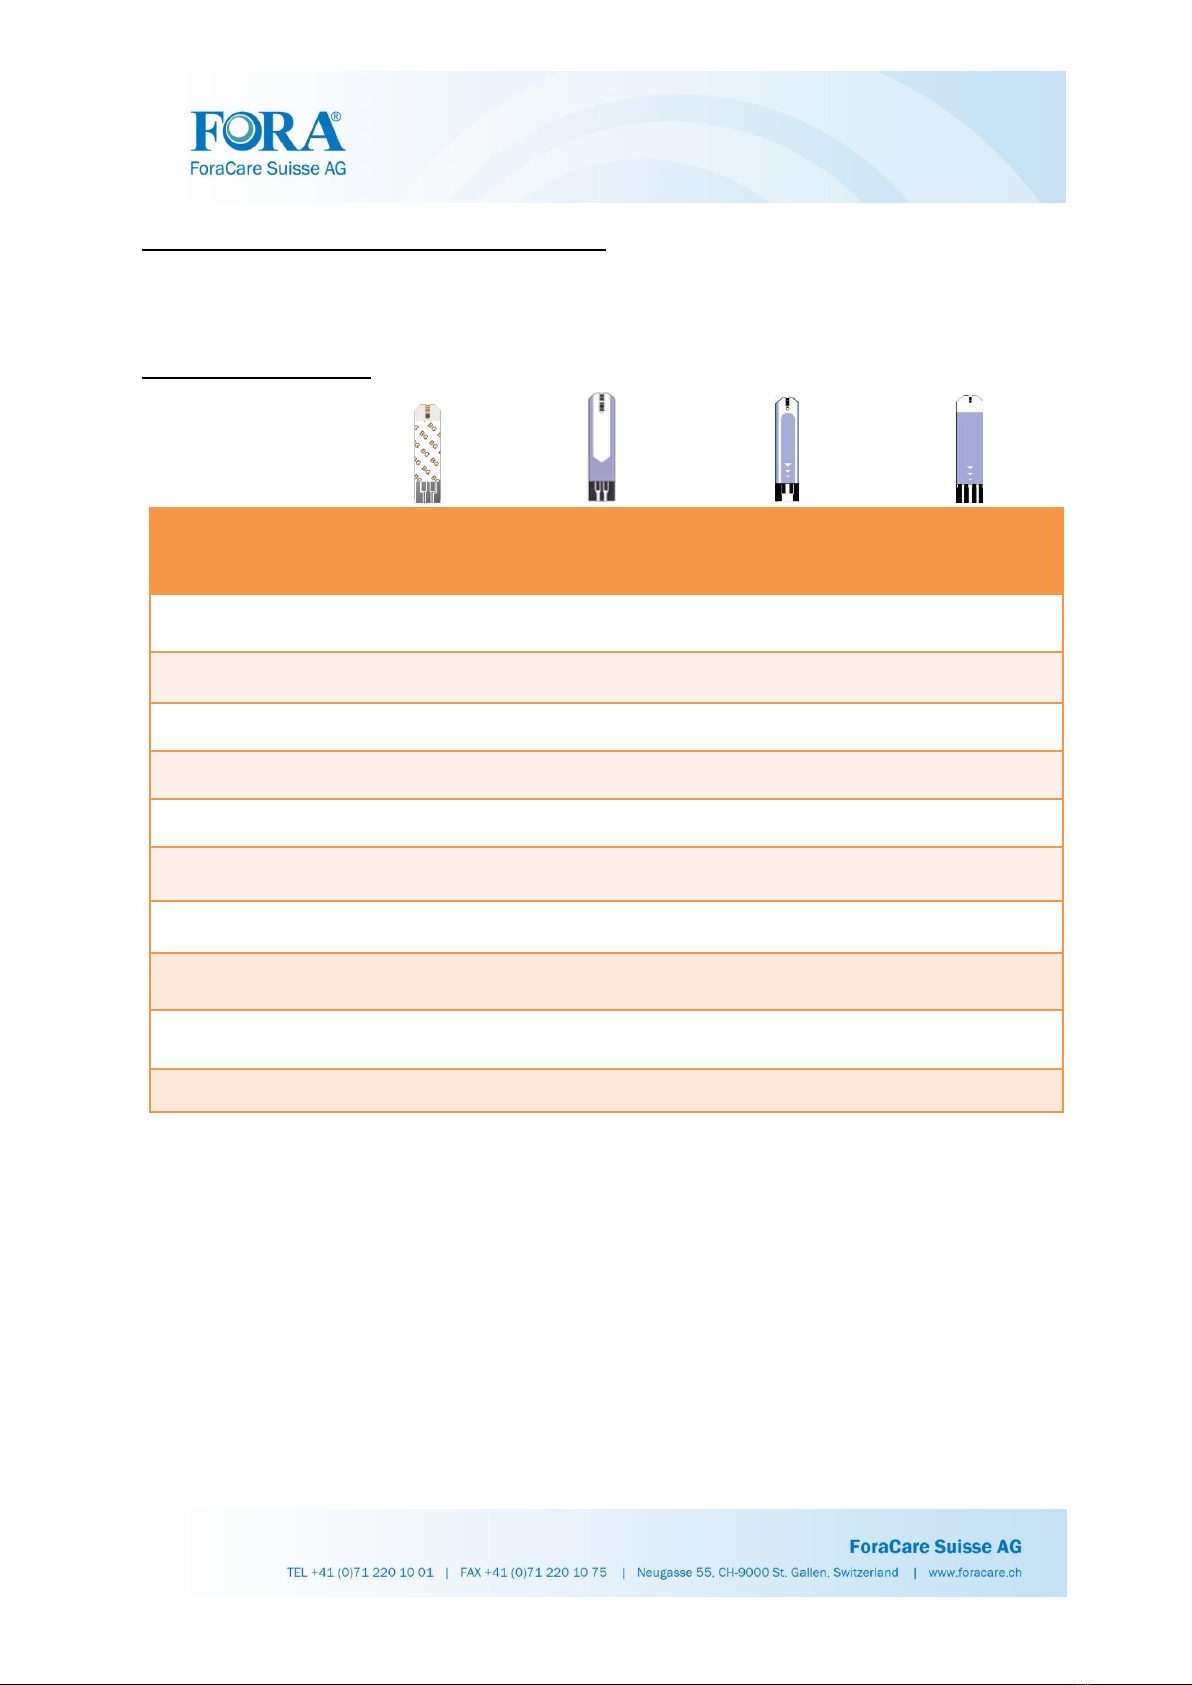
Q1. How is the test strips used with FORA’s blood glucose monitors? .......................5
Q2.What are the precision and accuracy in FORA’s test strips?..............……………11
Q3. What is the safety information in FORA’s blood glucose monitors?……………..30
Q4. Can hematocrit levels affect the result?........................................……………..31
Q5. The following physical situation could lead your reading incorrect and you should
consult your healthcare professional………………………………………………32
Q6. Can we use the FORA’s test strips on an airplane and what is the altitude
limitation of FORA’s GDH-FAD and GOD strips?...............................................33
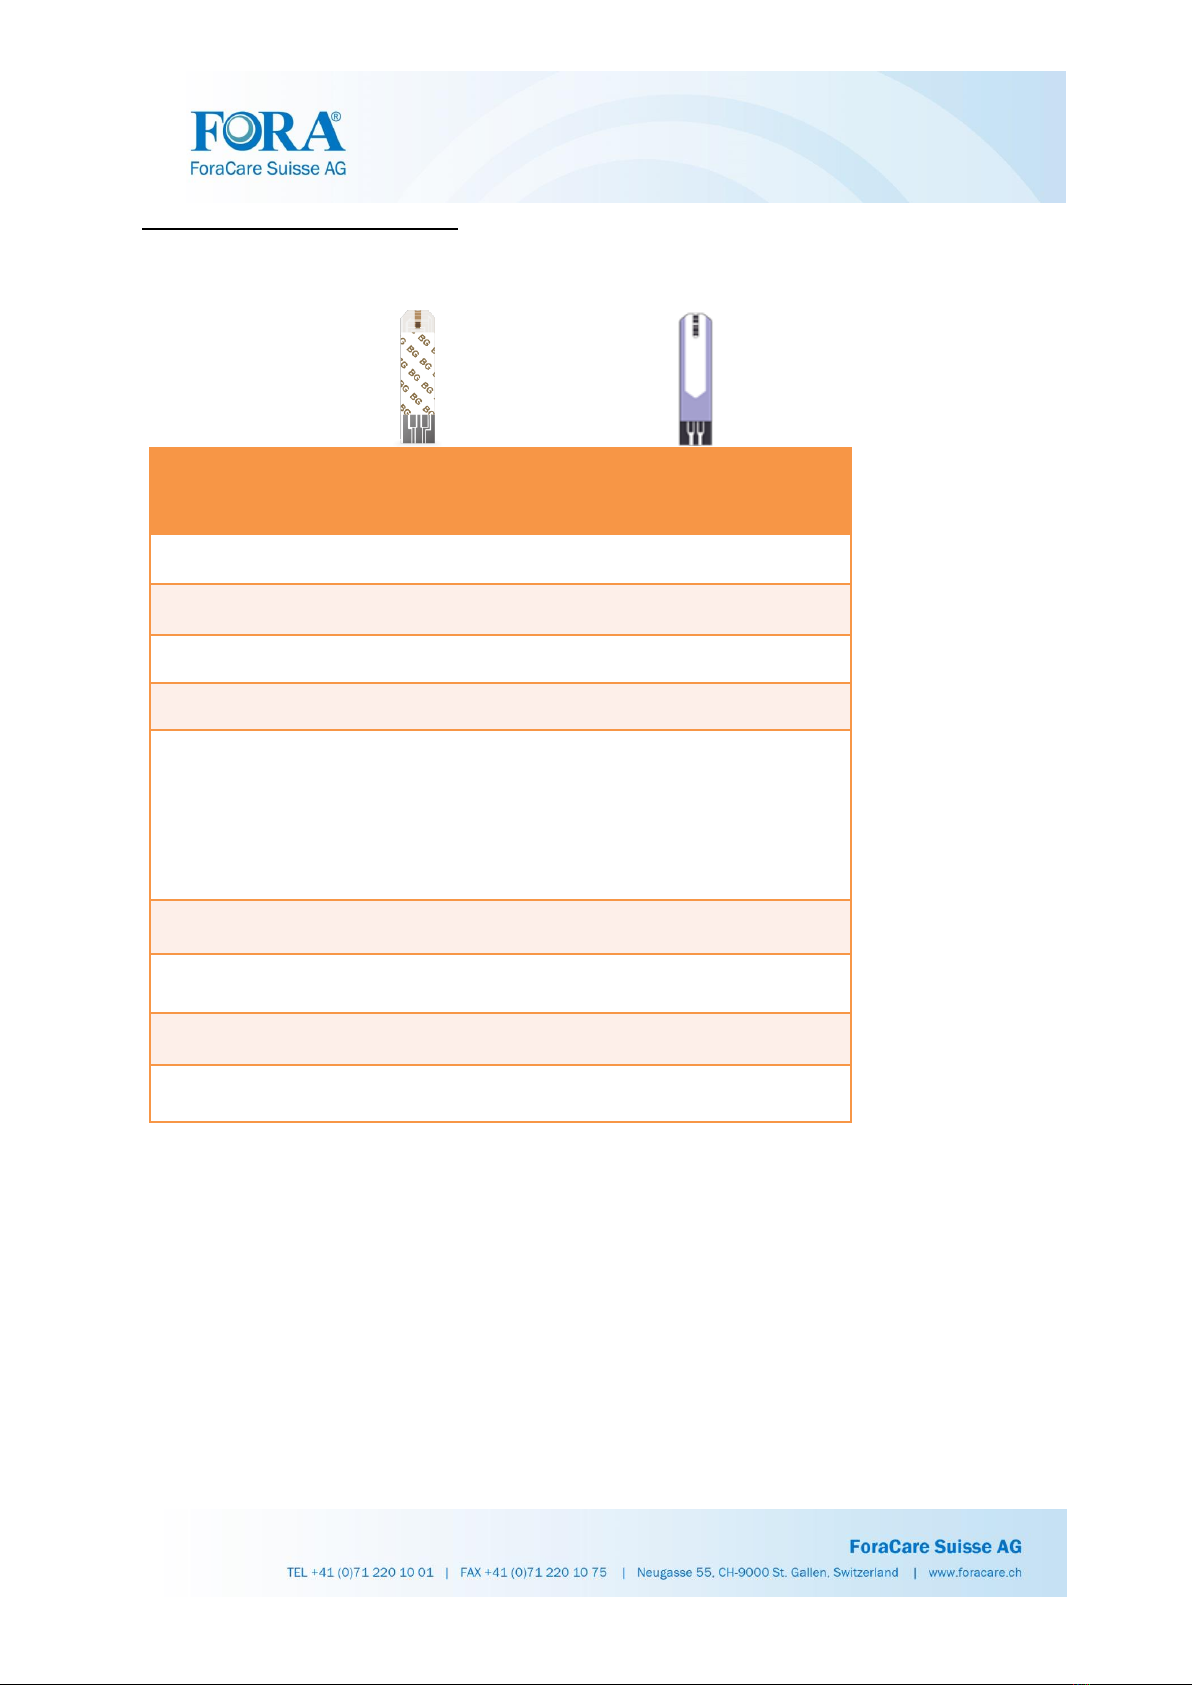
Q7. What are the combinations between FORA’s BGMs and test strips?…………34
Q8. What kind of substance interferes FORA’s BGM glucose reading in GOD and
GDH-FAD blood glucose test strips?..................................................................38
Q9. How do you know if sufficient blood has been applied on the test strip?............41
Q10. Can I use ForaCare Suisse Test Strips with other brands of Meters…………..41
Q11.What happens if I use expired test strips with FORA’s BGM?………………….41
Q12. W ha t is alternat i ve s i t e t e st i n g ( A S T) i n F O R A ’ s t e s t s t r ip s o f
BGM?………………………………………………………………………………...…42
Q13. How many testing sites can be used with FORA’s test strips of BGM?.............43
Q14. What will happen if insufficient blood is applied on the test strip? What do I
do?..................................................................................................................... 44
Q15. Why would it be possible to obtain different results from the same sample of
blood using the same glucometer?………………………………………………….44
Q16. What is the international standard in blood glucose’s accuracy?……………….42
Q17. Reasons for abnormal readings or defect of blood glucose monitor…………46

3/65
Battery…………………………………………………………………………………………7
Q18. Will low battery cause inaccurate test results?…………………………………47
Q19. What does it mean when my meter displays a battery symbol?……………….47
Q20. How long will my battery last?....................................................……………….47
Q21. Will replacing the battery cause memory loss?...................................………47
Universal Tone………………………………………………………………………………….
Q22. What is universal tone and which devices have this function?.........................47
Q23. What is the meaning of universal tone in different testing results?..................48
Q24. What is the meaning of universal tone in announcement of memory
result?.................................................................................................................49
Ketone warning
Q25. What is ketone warning?..................................................................................49
Changing the Setting (Universal Tone, Time, Date and Alarm)…………………………..
Q26. How do I change the universal tone, time, date and alarm on my meter?.......50
Caring your Device…………………………..
Q27. How do I clean my FORA BGM?......................................................................50
Q28. When should I clean and disinfected my FORA BGM?....................................50
Meter Disposal……………………………………………………….…………………….......
Q29. How do I dispose my FORA BGM?..................................................................50
Coding the Meter…………………………………………………………..............................
Q30. Which device needs coding before using? How do I code my FORA
meter……………………………………………………………………………………51
Control Solution……………………..................................................................................

4/65
Q31. How do I do the control solution test?..............................................................51
Q32. Where can I find the control solution range?....................................................52
Q33. Common Abnormal Results from Control Solution Test...................................53
Data Management Features of the FORA BGM Meter…………………………………….
Q34. What is FORA’s BGM Meter’s platform for blood glucose management?........53
Q35. What are the ways in which FORA BGM Meters transmit data and manage
media?................................................................................................................57
Q36. What are the support operation systems in FORA Healthcare system
software?.............................................................................................................58
Q37. How is data transmission done?.......................................................................58
Q38. W hat is the diff erent be tween Bluet ooth V3 and V4 on FORA ’s
meters?...............................................................................................................60
Lancet Device…………………………………………………………………………………..
Q39. How to prepare the lancing device?.................................................................61
Q40. What are the warning information in lancing devices?.....................................65
Q41. How to clean the lancing devices?...................................................................65

5/65
General Blood Glucose Meter questions:
Q1: How is the test strips used with FORA’s blood glucose monitors?
Blood Glucose Only:
Model Name
ACS045
ACS047
ACS044
ACS042
Applicable meter Name
FORA 6
Plus/ Connect/ Smart/
GTel
FORA
Advance Pro/
Comfort Pro
FORA
Prima/Voice/
Mini/GD50
FORA Comfort
Plus/ advance/
plus mini/plus voice
Enzyme Type
GDH-FAD
GDH-FAD
GDH-FAD
GOD
Sample Size
0.5 uL
1.1 uL
0.5 uL
0.5 uL
Reaction Time
5 Seconds
5 Seconds
5 Seconds
5 Seconds
Hematocrit Range
0 ~ 70%
0 ~ 70%
20 ~ 60%
20 ~ 60%
Measuring Range
10 ~ 600 mg/dL
(0.55 ~ 33.3 mmol/L)
10 ~ 600 mg/dL
(0.55 ~ 33.3 mmol/L)
20 ~ 600 mg/dL
(1.1 ~ 33.3 mmol/L)
20 ~ 600 mg/dL
(1.1 ~ 33.3 mmol/L)
Alternative Site Testing
YES AST
No AST
YES AST
YES AST
Applicable Sample
(Whole Blood)
Capillary; Venous;
Arterial
Capillary; Venous
Capillary;
Venous
Capillary
Intended use
General Patient; Dialysis;
Gestational; Neonatal
General
Patient; Dialysis;
Gestational; Neonatal
General Patient; Dialysis;
Gestational
General Patient
Code Type
NO Code Card
NO Code Card
NO Code Card
NO Code Card

6/65
Model Name
ACS041
ACS043
Applicable meter Name
FORA Comfort
basic G20
FORA Comfort
check G40
Enzyme Type
GOD
GDH-FAD
Sample Size
0.7 uL
0.7 uL
Reaction Time
7 Seconds
7 Seconds
Hematocrit Range
20 ~ 60%
35 –60 %
Measuring Range
20 ~ 600 mg/dL
(1.1 ~ 33.3 mmol/L)
20 ~ 600 mg/dL
(1.1 ~ 33.3 mmol/L)
Alternative Site Testing
YES AST
YES AST
Applicable Sample
(Whole Blood)
Capillary;
Capillary; Venous
Intended use
General Patient
General Patient; Dialysis;
Gestational
Code Type
NO Code Card
NO Code Card

7/65
BG/HCT/HB 3 in 1 Test Strip
Model Name
ACS051
ACS050
Applicable meter
Name
FORA 6
Plus/ Connect/ GTel
FORA
Advance Pro
Enzyme Type
GDH-FAD
GDH-FAD
Sample Size
0.5 uL
1.1 uL
Reaction Time
5 Seconds
5 Seconds
Measuring Range
BG:
10 ~ 600 mg/dL
(0.55 ~ 33.3 mmol/L)
HCT:
0 ~ 70%
Hb:
0~23.8 g/dL
BG:
10 ~ 600 mg/dL
(0.55 ~ 33.3 mmol/L)
HCT:
0 ~ 70%
Hb:
0~23.8 g/dL
Alternative Site
Testing
YES AST
YES AST
Applicable
Sample
(Whole Blood)
Capillary; Venous; Arterial
Capillary; Venous
Intended use
General Patient; Dialysis;
Gestational; Neonatal
General Patient; Dialysis; Gestational;
Neonatal
Code Type
NO Code Card
NO Code Card

8/65
β-Ketone (KB) Strip:
Model Name
ACS053
ACS052
Applicable meter
Name
FORA 6
Plus/ Connect/ GTel
FORA
Advance Pro
Enzyme Type
β- Hydroxybutyrate
β- Hydroxybutyrate
Sample Size
0.8 uL
1.0 uL
Reaction Time
10 Seconds
10 Seconds
Measuring Range
0.1 ~ 8.0 mmol/L
0.1 ~ 8.0 mmol/L
Hematocrit Range
10 ~ 70%
10 ~ 70%
Alternative Site
Testing
No AST
No AST
Applicable
Sample
(Whole Blood)
Capillary; Venous
Capillary; Venous
Intended use
General Patient
General Patient
Code Type
Need Code Card
Need Code Card

9/65
Urine Acid (UA) Strip:
Model Name
ACS057
Applicable meter
Name
FORA 6
Plus/ Connect/ GTel
Enzyme Type
Uric Acid Catalyst
Sample Size
1.0 uL
Reaction Time
15 Seconds
Measuring Range
3 ~ 20mg/dL ( 0.179~1.190mmol/L)
Hematocrit Range
20 ~ 60%
Alternative Site
Testing
No AST
Applicable Sample
(Whole Blood)
Capillary, Venous
Intended use
General Patient
Code Type
Need Code Card

10/65
Total Cholesterol (TCH) Strip:
Model Name
ACS055
Applicable meter
Name
FORA 6
Plus/ Connect/ GTel
Enzyme Type
Cholesterol esterase/
Cholesterol oxidase
Sample Size
3.0 uL
Reaction Time
60 Seconds
Measuring Range
100 ~ 400 mg/dL
( 2.6~10.4 mmol/L)
Hematocrit Range
20 ~ 60%
Alternative Site
Testing
No AST
Applicable
Sample
(Whole Blood)
Capillary, Venous
Intended use
General Patient
Code Type
Need Code Card

11/65
Q2: What are the precision and accuracy in FORA’s test strips?
1. FOR A 6 Blood Glucose Test Strip
ACS045
Accuracy
The table below displays how often FORA 6 achieves this target. The chart is
based on a study carried out on 100 patients (each patient was tested six times
which resulted in 600 test results) to see how well FORA 6 performed compared
to Cobas Integra® 400 plus reference method results.
Table 1 Accuracy results for glucose concentration < 100 mg/dL (5.55 mmol/L)
Within ±5 mg/dL
(Within ±0.28mmol/L)
Within ±10 mg/dL
(Within ±0.55mmol/L)
Within ±15 mg/dL*
(Within ± 0.83 mmol/L)
33.3% (52/156)
73.7% (115/156)
98.7% (154/156)
Table 2 Accuracy results for glucose concentration ≥ 100 mg/dL (5.55 mmol/L)
Within ±5 %
Within ±10 %
Within ±15 %*
69.1% (307/444)
93.9% (417/444)
99.5% (442/444)
Table 3 Accuracy results for glucose concentrations between 40 mg/dL (2.22
mmol/L ) to 456 mg/dL (25.3 mmol/L)
Within ±15 mg/dL or ±15%
(Within ±0.83 mmol/L or ±15%)
99.3% (596/600)
Note: * According to the accuracy criteria of EN ISO 15197: 2015, 95% of all
differences in glucose values (i.e., Cobas Integra® 400 plus reference values
minus glucose values of FORA 6) should be within ±15 mg/dL (0.83 mmol/L) for
glucose concentration < 100 mg/dL (5.55 mmol/L), and within ±15% for glucose
concentration ≥ 100 mg/dL (5.55 mmol/L). When Test Strips results are compared
to the reference values, difference values below 100 mg/dL (5.55 mmol/L) are
expressed in mg/dL or mmol/L, while thos above 100 mg/dL (5.55 mmol/L) are in
percentage.
User performance
160 subjects were tested with blood samples taken from the fingertip and the
alternative sites, the palm, the forearm and the upper arm. The tables show how
well FORA 6 performed compared to Cobas C311 reference method results.

12/65
Table 1 Difference distribution for glucose concentration < 100 mg/dL (5.55
mmol/L)
Tested sites
Difference within
±5mg/dL
Difference within
±10mg/dL
Difference within
±15mg/dL
Fingertip
26/43 (60.5%)
37/43 (86.0%)
43/43 (100%)
Palm
27/42 (64.3%)
41/42 (97.6%)
42/42 (100%)
Forearm
31/42 (73.8%)
39/42 (92.9%)
42/42 (100%)
Upper arm
29/42 (69.0%)
38/42 (90.5%)
41/42 (97.6%)
Table 2 Difference distribution for glucose concentration ≥ 100 mg/dL (5.55
mmol/L)
Tested sites
Difference within
±5mg/dL
Difference within
±10mg/dL
Difference within
±15mg/dL
Fingertip
59/117 (50.4%)
102/117 (87.2%)
115/117 (98.3%)
Palm
49/118 (41.5%)
92/118 (78.0%)
118/118 (100%)
Forearm
43/118 (36.4%)
84/118 (71.2%)
115/118 (97.5%)
Upper arm
49/118 (41.5%)
87/118 (73.7%)
116/118 (98.3%)
Precision
In both intermediate precision and repeatability tests, the standard deviation (SD)
is within 5 mg/dL (0.28 mmol/L) for each glucose concentration < 100 mg/dL
(5.55 mmol/L) and the coefficient of variation (CV) is less than 5% for each
glucose concentration ≥ 100 mg/dL (5.55 mmol/L).

13/65
2. FORA 6 Blood Glucose, Hematocrit and Hemoglobin Test Strip
ACS051
(1) BG
Accuracy
The table below displays how often FORA 6 achieves this target. The chart is
based on a study carried out on 100 patients (each patient was tested six times
which resulted in 600 test results) to see how well FORA 6 performed compared
to Cobas Integra® 400 plus reference method results.
Table 1 Accuracy results for glucose concentration < 100 mg/dL (5.55 mmol/L)
Within ±5 mg/dL
(Within ±0.28mmol/L)
Within ±10 mg/dL
(Within ±0.55mmol/L)
Within ±15 mg/dL*
(Within ± 0.83 mmol/L)
33.3% (52/156)
73.7% (115/156)
98.7% (154/156)
Table 2 Accuracy results for glucose concentration ≥ 100 mg/dL (5.55 mmol/L)
Within ±5 %
Within ±10 %
Within ±15 %*
69.1% (307/444)
93.9% (417/444)
99.5% (442/444)
Table 3 Accuracy results for glucose concentrations between 40 mg/dL (2.22
mmol/L ) to 456 mg/dL (25.3 mmol/L)
Within ±15 mg/dL or ±15%
(Within ±0.83 mmol/L or ±15%)
99.3% (596/600)
Note: * According to the accuracy criteria of EN ISO 15197: 2015, 95% of all
differences in glucose values (i.e., Cobas Integra® 400 plus reference values
minus glucose values of FORA 6) should be within ±15 mg/dL (0.83 mmol/L) for
glucose concentration < 100 mg/dL (5.55 mmol/L), and within ±15% for glucose
concentration ≥ 100 mg/dL (5.55 mmol/L). When Test Strips results are compared
to the reference values, difference values below 100 mg/dL (5.55 mmol/L) are
expressed in mg/dL or mmol/L, while thos above 100 mg/dL (5.55 mmol/L) are in
percentage.
User performance
160 subjects were tested with blood samples taken from the fingertip and the
alternative sites, the palm, the forearm and the upper arm. The tables show how
well FORA 6 performed compared to Cobas C311 reference method results.

14/65
Table 1 Difference distribution for glucose concentration < 100 mg/dL (5.55
mmol/L)
Tested sites
Difference within
±5mg/dL
Difference within
±10mg/dL
Difference within
±15mg/dL
Fingertip
26/43 (60.5%)
37/43 (86.0%)
43/43 (100%)
Palm
27/42 (64.3%)
41/42 (97.6%)
42/42 (100%)
Forearm
31/42 (73.8%)
39/42 (92.9%)
42/42 (100%)
Upper arm
29/42 (69.0%)
38/42 (90.5%)
41/42 (97.6%)
Table 2 Difference distribution for glucose concentration ≥ 100 mg/dL (5.55
mmol/L)
Tested sites
Difference within
±5mg/dL
Difference within
±10mg/dL
Difference within
±15mg/dL
Fingertip
59/117 (50.4%)
102/117 (87.2%)
115/117 (98.3%)
Palm
49/118 (41.5%)
92/118 (78.0%)
118/118 (100%)
Forearm
43/118 (36.4%)
84/118 (71.2%)
115/118 (97.5%)
Upper arm
49/118 (41.5%)
87/118 (73.7%)
116/118 (98.3%)
Precision
In both intermediate precision and repeatability tests, the standard deviation (SD)
is within 5 mg/dL (0.28 mmol/L) for each glucose concentration < 100 mg/dL
(5.55 mmol/L) and the coefficient of variation (CV) is less than 5% for each
glucose concentration ≥ 100 mg/dL (5.55 mmol/L).
(2) HCT:
Accuracy: ≦±5% ; Precision: SD≦3
(3) HB:
Accuracy: ≦1.7 g/dL ; Precision: SD≦3 g/dL
In our system, the HB is calculated by HCT. Our device is not directly got the
value of HB. All the hemoglobin (HB) detect tested data are calculated from
hematocrit (HCT) detect tested results (Hb = HCT x 0.34). Based on this, the Hb
detect linearity performance results are the same as HCT detect linearity
performance results. However, normal accuracy requirement on market (without
any formal regulatory requirements) is ±1.5%.

15/65
3. FORA 6 β-Ketone Test Strip
ACS053
Accuracy
The table below displays how often FORA achieves this target. The chart is
based on a study carried out on 160 patients (each patient was tested three
times which resulted in 480 test results) to see how well FORA performed
compared to β-Hydroxybutyrate LiquiColor® reference method results.
Capillary samples
(n=480)
β-ketone concentration (mmol/L)
Regression analysis
Range: 0.10 to 6.75
Mean: 1.13
y = 0.9997x - 0.0153,
R²= 0.9912
Venous samples
(n=480)
β-ketone concentration (mmol/L)
Regression analysis
Range: 0.10 to 6.75
Mean: 1.12
y = 0.9926x - 0.0554,
R²= 0.9772
Precision
In repeatability test, the standard deviation (SD) is within 0.1 mmol/L for each β-
Ketone concentration < 1 mmol/L and the coefficient of variation (CV) is less than
7.5% for each β-Ketone concentration ≥ 1 mmol/L.

16/65
4. FORA 6 Urine Acid Test Strip
ACS057
Accuracy
Results: Difference Plot Analysis
Number of subjects (N) = 160
TABLE 1 Ratio of samples (capillary whole blood) falling within different bias
ranges
Within ±5 %
Within ±10 %
Within ±15 %
Within ±20 %
64.1%
95.0%
100%
100%
Measurement range: 3.3 ~ 10 mg/dL
Linear Regression: y = 1.0098x + 0.0095, R²= 0.9637, (n=320)
User performance
Results: Difference Plot Analysis
Number of subjects (N) = 160
TABLE 2 Ratio of samples (capillary whole blood) falling within different bias
ranges
Within ±5 %
Within ±10 %
Within ±15 %
Within ±20 %
68.1%
96.9%
100%
100%
Measurement range: 3.3 ~ 10 mg/dL
Linear Regression: y = 1.0036x + 0.0499, R²= 0.9633, (n=160)
Precision
TABLE 3 Precision
Uric Acid Concentration (mg/dL)
LOW
MID
HIGH
Mean
5.1
10.1
15.0
SD.
o.205
0.258
0.438
CV%
4.05%
2.55%
2.92%

17/65
5. FORA 6 Total Cholesterol Test Strip
ACS055
Accuracy
Results: Difference Plot Analysis
Number of subjects (N) = 320
TABLE 1 Ratio of samples (capillary whole blood) falling within different bias
ranges
Within ±5 %
Within ±10 %
Within ±15 %
Within ±20 %
80.3%
99.1%
100%
100%
Measurement range: 129 ~ 399 mg/dL
Linear Regression: y = 0.9777x + 1.9945, R²= 0.9724, (n=640)
User performance
Results: Difference Plot Analysis
Number of subjects (N) = 160
TABLE 2 Ratio of samples (capillary whole blood) falling within different bias
ranges
Within ±5 %
Within ±10 %
Within ±15 %
Within ±20 %
68.4%
98.8%
100%
100%
Measurement range: 129 ~ 399 mg/dL
Linear Regression: y = 0.9753x + 2.0318, R²= 0.9693, (n=320)
Precision
TABLE 3 Precision
FORA 6 Plus
Interval 1
Interval 12
Mean
140.0
236.8
SD
9.81
16.63
CV%
7.01%
7.02%
FORA 6 Connect
Interval 1
Interval 12
Mean
137.6
241.5
SD
10.12
16.75
CV%
7.35%
6.94%

18/65
6. FORAADVANCED pro Blood Glucose Test Strip
ACS047
Accuracy
The table below displays how often FORA achieves this target. The chart is
based on a study carried out on 160 patients (each patient was tested six times
which had 960 test results) to see how well FORA performed compared to YSI-
2300 reference method results.
Table 1 Accuracy results for glucose concentration < 100 mg/dL (5.55 mmol/L)
Within ±5 mg/dL
(Within ±0.28mmol/L)
Within ±10 mg/dL
(Within ±0.55mmol/L)
Within ±15 mg/dL*
(Within ± 0.83 mmol/L)
59.7% (179/300)
90.7% (272/300)
99.3% (298/300)
Table 2 Accuracy results for glucose concentration≧100 mg/dL (5.55 mmol/L)
Within ±5 %
Within ±10 %
Within ±15 %*
51.2% (338/660)
85.5% (564/660)
97.1% (641/660)
Table 3 Accuracy results for glucose concentrations between 40.3 mg/dL
(2.24mmol/L ) to 547.0mg/dL (30.39mmol/L)
Within ±15 mg/dL or ±15%
(Within ±0.83 mmol/L or ±15%)
97.8% (939/960)
Note: *According to the accuracy criteria of EN ISO 15197: 2015, 95% of all
differences in glucose values (i.e., YSI-2300 reference values minus glucose
values of FORA) should be within ±15 mg/dL (0.83 mmol/L) for glucose
concentration < 100 mg/dL (5.55 mmol/L), and within ±15% for glucose
concentration ≥ 100 mg/dL (5.55 mmol/L). When Test Strips results are compared
to the reference values, difference values below 100 mg/dL (5.55 mmol/L) are
expressed in mg/dL or mmol/L, while those above 100 mg/dL (5.55 mmol/L) in
percentage.
User performance
160 subjects were tested with blood samples taken from the fingertip. The tables
show how well FORA performed compared to YSI-2300 reference method results.
Table 1 Difference distribution for glucose concentration < 100 mg/dL (5.55
mmol/L)

19/65
Tested sites
Difference within
±5mg/dL
Difference within
±10mg/dL
Difference within
±15mg/dL
Fingertip
71.4% (35/49)
95.9% (47/49)
100.0% (49/49)
Table 2 Difference distribution for glucose concentration ≥ 100 mg/dL (5.55
mmol/L)
Tested sites
Difference within
±5mg/dL
Difference within
±10mg/dL
Difference within
±15mg/dL
Fingertip
55.0% (61/111)
88.3% (98/111)
97.3% (108/111)
Precision
In both intermediate precision and repeatability tests, the standard deviation (SD)
is within 5 mg/dL (0.28 mmol/L) for each glucose concentration < 100 mg/dL
(5.55 mmol/L) and the coefficient of variation (CV) is less than 5% for each
glucose concentration ≥ 100 mg/dL (5.55 mmol/L).

20/65
7. FORAADVANCED pro Blood Glucose, Hematocrit and Hemoglobin Test Strip
ACS050
(1) BG
Accuracy
The table below displays how often FORA achieves this target. The chart is
based on a study carried out on 160 patients (each patient was tested six times
which had 960 test results) to see how well FORA performed compared to YSI-
2300 reference method results.
Table 1 Accuracy results for glucose concentration < 100 mg/dL (5.55 mmol/L)
Within ±5 mg/dL
(Within ±0.28mmol/L)
Within ±10 mg/dL
(Within ±0.55mmol/L)
Within ±15 mg/dL*
(Within ± 0.83 mmol/L)
59.7% (179/300)
90.7% (272/300)
99.3% (298/300)
Table 2 Accuracy results for glucose concentration≧100 mg/dL (5.55 mmol/L)
Within ±5 %
Within ±10 %
Within ±15 %*
51.2% (338/660)
85.5% (564/660)
97.1% (641/660)
Table 3 Accuracy results for glucose concentrations between 40.3 mg/dL
(2.24mmol/L ) to 547.0mg/dL (30.39mmol/L)
Within ±15 mg/dL or ±15%
(Within ±0.83 mmol/L or ±15%)
97.8% (939/960)
Note: *According to the accuracy criteria of EN ISO 15197: 2015, 95% of all
differences in glucose values (i.e., YSI-2300 reference values minus glucose
values of FORA) should be within ±15 mg/dL (0.83 mmol/L) for glucose
concentration < 100 mg/dL (5.55 mmol/L), and within ±15% for glucose
concentration ≥ 100 mg/dL (5.55 mmol/L). When Test Strips results are compared
to the reference values, difference values below 100 mg/dL (5.55 mmol/L) are
expressed in mg/dL or mmol/L, while those above 100 mg/dL (5.55 mmol/L) in
percentage.
User performance
160 subjects were tested with blood samples taken from the fingertip. The tables
show how well FORA performed compared to YSI-2300 reference method results.
Other manuals for FORA 6 Plus
1
This manual suits for next models
15
Table of contents
Other ForaCare Blood Glucose Meter manuals

ForaCare
ForaCare iDiamond User manual

ForaCare
ForaCare TD-3260 User manual

ForaCare
ForaCare Test N'GO User manual

ForaCare
ForaCare Pet Gluc User manual

ForaCare
ForaCare G30a User manual

ForaCare
ForaCare FORA D40 User manual

ForaCare
ForaCare D20 No-Coding User manual

ForaCare
ForaCare FORA 6 Connect User manual

ForaCare
ForaCare FORA 6 Plus Installation guide

ForaCare
ForaCare POCT S10a User manual