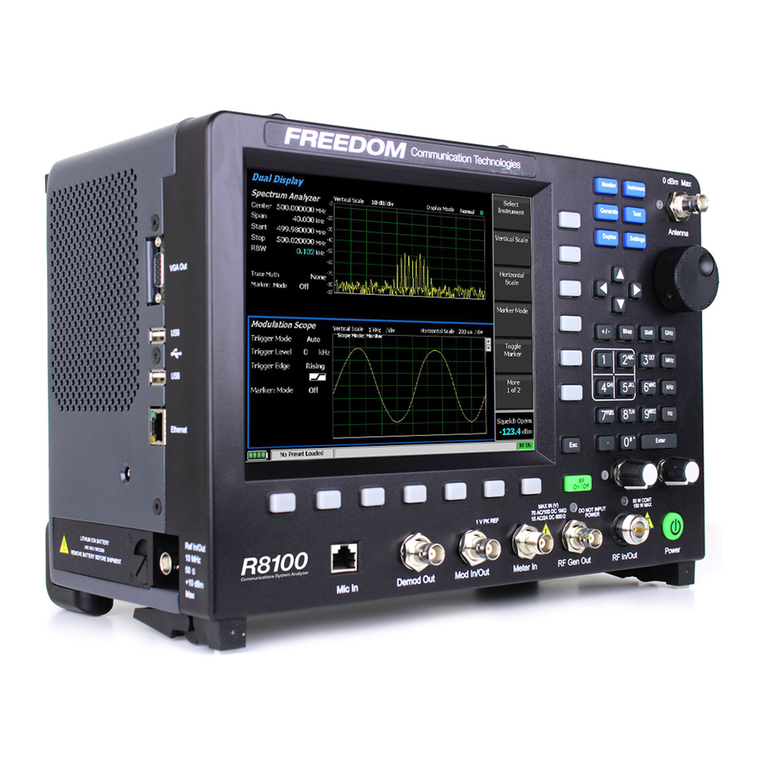
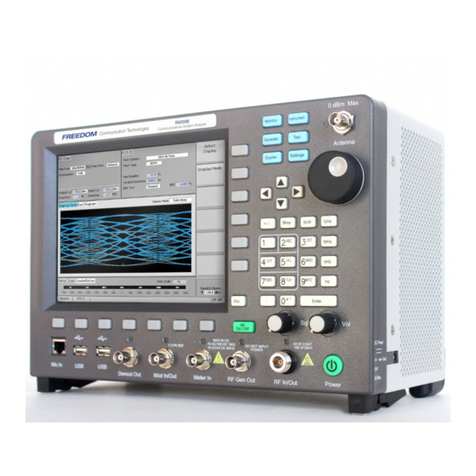
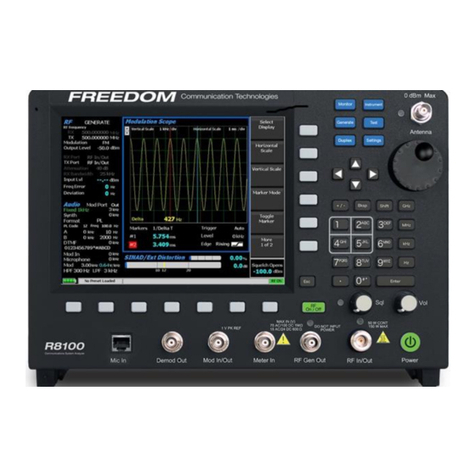
Freedom R8000 Series User manual

R8000 Series
Communications System Analyzer
AUTOTUNE USER GUIDE
Kenwood NX Portable
Kenwood NX Mobile
Freedom Communication Technologies
2002 Synergy Blvd, Suite 200
Kilgore, Texas 75662
Copyright 2015 Freedom Communication Technologies
All Rights Reserved
Printed in U.S.A.
CG-1375 Rev. B

Kenwood NX Series AutoTune™ User Guide
i
AUTOTUNE™ SOFTWARE LICENSE AGREEMENT
The software license agreement governing use of the R8000 Series
Communications System Analyzer AutoTune™software is located in CG-1365
R8000 Series Communications System Analyzer Operator’s Manual.
TRADEMARKS
The Freedom Communication Technologies logo and Freedom Communication
Technologies are registered ® trademarks of Freedom Communication
Technologies.
© 2007-2010 by Kenwood Corporation. All rights reserved.
OpenG License
Copyright (c) 2002-2005, Rolf Kalbermatter <rolf.kalbermatter@citeng.com>
Copyright (c) 2004, Heiko Fettig <heiko.fettig@gmx.net>
Copyright (c) 2005-2006, MKS Instruments, Inc., author: Doug Femec
All rights reserved.
Redistribution and use in source and binary forms, with or without modification,
are permitted provided that the following conditions are met:
- Redistributions of source code must retain the above copyright notice, this
list of conditions and the following disclaimer.
- Redistributions in binary form must reproduce the above copyright notice, this
list of conditions and the following disclaimer in the documentation and/or
other materials provided with the distribution.
- Neither the name of the SciWare, James Kring, Inc., nor the names of its
contributors may be used to endorse or promote products derived from this
software without specific prior written permission.

Kenwood NX Series AutoTune™ User Guide
ii
THIS SOFTWARE IS PROVIDED BY THE COPYRIGHT HOLDERS AND
CONTRIBUTORS "AS IS" AND ANY EXPRESS OR IMPLIED WARRANTIES,
INCLUDING, BUT NOT LIMITED TO, THE IMPLIED WARRANTIES OF
MERCHANTABILITY AND FITNESS FOR A PARTICULAR PURPOSE ARE
DISCLAIMED. IN NO EVENT SHALL THE COPYRIGHT HOLDER OR
CONTRIBUTORS BE LIABLE FOR ANY DIRECT, INDIRECT, INCIDENTAL,
SPECIAL, EXEMPLARY, OR CONSEQUENTIAL DAMAGES (INCLUDING, BUT
NOT LIMITED TO, PROCUREMENT OF SUBSTITUTE GOODS OR SERVICES;
LOSS OF USE, DATA, OR PROFITS; OR BUSINESS INTERRUPTION)
HOWEVER CAUSED AND ON ANY THEORY OF LIABILITY, WHETHER IN
CONTRACT, STRICT LIABILITY, OR TORT (INCLUDING NEGLIGENCE OR
OTHERWISE) ARISING IN ANY WAY OUT OF THE USE OF THIS
SOFTWARE, EVEN IF ADVISED OF THE POSSIBILITY OF SUCH DAMAGE.

Kenwood NX Series AutoTune™ User Guide
iii
TABLE OF CONTENTS
1. Introduction....................................................................................................1
2. Scope ............................................................................................................1
3. Conventions...................................................................................................1
4. Kenwood NX Portable Radio Test Setup.......................................................2
4.1. NX Portable Test Setup...........................................................................2
5. Kenwood NX Portable Alignment and Test Descriptions...............................3
5.1. Assist Voltage..........................................................................................3
5.2. Reference Frequency ..............................................................................4
5.3. TX Power.................................................................................................5
5.4. TX Modulation..........................................................................................7
5.5. TX Signaling ..........................................................................................10
5.6. TX VOX..................................................................................................12
5.7. RX Sensitivity.........................................................................................13
5.8. RX Squelch............................................................................................15
5.9. RX RSSI ................................................................................................18
6. Kenwood NX Mobile Radio Test Setup........................................................20
6.1. NX Mobile Test Setup............................................................................20
7. Kenwood NX Mobile Alignment and Test Descriptions................................21
7.1. Assist Voltage........................................................................................21
7.2. Frequency..............................................................................................22
7.3. TX Power...............................................................................................23
7.4. TX Modulation........................................................................................25
7.5. TX Signaling ..........................................................................................28
7.6. RX Sensitivity.........................................................................................30
7.7. RX Squelch............................................................................................32
7.8. RX RSSI ................................................................................................35
7.9. No test is currently available.Basic Troubleshooting..............................36
7.9. Basic Troubleshooting ...........................................................................37
8. Support Information.....................................................................................38
8.1. Technical Support..................................................................................38
8.2. Sales......................................................................................................38
APPENDIX A. Test Limits ..............................................................................A-1
APPENDIX B. Sample Test Result Report.....................................................B-1
APPENDIX C. Alternate Test Set...................................................................C-1
APPENDIX D. Revision History......................................................................D-1

Kenwood NX Series AutoTune™ User Guide
iv
LIST OF FIGURES
Figure 4-1. NX Portable Test Setup Diagram ......................................................2
Figure 6-1. NX Mobile Test Setup Diagram .......................................................20
Figure B-1. Sample Test Result Report............................................................B-5

Kenwood NX Series AutoTune™ User Guide
v
LIST OF TABLES
Table 5-1. Reference Frequency alignment results ..............................................3
Table 5-2. Analyzer Configuration for Reference Frequency................................4
Table 5-3. Reference Frequency alignment results ..............................................4
Table 5-4. Reference Frequency test results........................................................4
Table 5-5. Analyzer Configuration for TX Power...................................................5
Table 5-6. Kenwood NX Portable specified target power......................................5
Table 5-7. TX Power alignment results.................................................................5
Table 5-8. TX Power test results...........................................................................6
Table 5-9. Analyzer Configuration for Modulation Balance test, alignment...........7
Table 5-10. TX Balance alignment results............................................................7
Table 5-11. TX Balance test results......................................................................8
Table 5-12. TX Maximum Deviation alignment results..........................................8
Table 5-13. TX Maximum Deviation test results ...................................................9
Table 5-14. Analyzer Configuration for TX Signaling test, alignment..................10
Table 5-15. TX Signaling modulation types ........................................................10
Table 5-16. TX Signaling alignment results ........................................................10
Table 5-17. TX Signaling test results..................................................................11
Table 5-18. Analyzer Configuration for TX VOX1/10 alignment..........................12
Table 5-19. TX VOX1/10 alignment results.........................................................12
Table 5-20. Analyzer Configuration for RX Sensitivity test..................................13
Table 5-21. RX Sensitivity test results ................................................................13
Table 5-22. RX Sensitivity test results ................................................................14
Table 5-23. Analyzer Configuration for RX Squelch test.....................................15
Table 5-24. RX Squelch sensitivity results..........................................................15
Table 5-25. RX Squelch alignment results..........................................................15
Table 5-26. RX Squelch alignment results..........................................................16
Table 5-27. RX Squelch sensitivity test results...................................................16
Table 5-28. RX Squelch test results....................................................................17
Table 5-29. Analyzer Configuration for RX RSSI test .........................................18
Table 5-30. RX RSSI sensitivity results ..............................................................18
Table 5-31. RX Squelch alignment results..........................................................19
Table 5-32. RX Squelch alignment results..........................................................19
Table 7-1. Reference Frequency alignment results ............................................21
Table 7-2. Analyzer Configuration for Reference Frequency..............................22
Table 7-3. Reference Frequency alignment results ............................................22
Table 7-4. Reference Frequency test results......................................................22
Table 7-5. Analyzer Configuration for TX Power.................................................23
Table 7-6. TX Power Limit alignment results ......................................................23
Table 7-7. TX Power alignment results...............................................................24
Table 7-8. TX Power test results.........................................................................24
Table 7-9. Analyzer Configuration for TX Modulation test, alignment.................25
Table 7-10. TX Balance alignment results..........................................................25
Table 7-11. TX Balance test results....................................................................26
Table 7-12. TX Maximum Deviation alignment results........................................26

Kenwood NX Series AutoTune™ User Guide
vi
Table 7-13. TX Maximum Deviation test results .................................................27
Table 7-14. Analyzer Configuration for TX Signaling test, alignment..................28
Table 7-15. TX Signaling modulation types ........................................................28
Table 7-16. TX Signaling alignment results ........................................................28
Table 7-17. TX Signaling test results..................................................................29
Table 7-18. Analyzer Configuration for RX Sensitivity test..................................30
Table 7-19. RX Sensitivity (Analog) test results..................................................30
Table 7-20. RX Sensitivity (Digital) test results...................................................31
Table 7-21. Analyzer Configuration for RX Squelch test.....................................32
Table 7-22. RX Squelch sensitivity results..........................................................32
Table 7-23. RX Squelch alignment results..........................................................32
Table 7-24. RX Squelch alignment results..........................................................33
Table 7-25. RX Squelch sensitivity test results...................................................33
Table 7-26. RX Squelch test results....................................................................34
Table 7-27. Analyzer Configuration for RX RSSI test .........................................35
Table 7-28. RX RSSI sensitivity results ..............................................................35
Table 7-29. RX RSSI alignment results ..............................................................36
Table 7-30. RX RSSI alignment results ..............................................................36
Table 7-31. Kenwood NX Series Troubleshooting Chart ....................................37
Table A-1. Default Kenwood NX Portable Limits ..............................................A-5
Table A-2. Default Kenwood NX Mobile Limits .................................................A-9

Kenwood NX Series AutoTune™ User Guide
1
1. Introduction
The Freedom Communication Technologies R8000 Series Communications System
Analyzer AutoTune™ (hereafter “AutoTune”) is designed to provide an automated test
and alignment solution for supported two-way radios.
2. Scope
This document is intended to provide information regarding the tests and alignments
performed for supported radios by AutoTune. This document is restricted to radio-
specific information for Kenwood NX Portable and NX Mobile radios.
Please refer to the R8000 Series Communications System Analyzer Owner’s Manual
(CG-1365) for an overview and basic operating instructions for AutoTune itself.
3. Conventions
Rated Audio. Approx. 630 mVrms for Kenwood NX Portable and 2.83 Vrms for
Kenwood NX Mobile radios across a 4 Ωspeaker.

Kenwood NX Series AutoTune™ User Guide
2
4. Kenwood NX Portable Radio Test Setup
In order to perform the test and alignment procedures, the NX Portable radio must be
connected to the R8000 Communications System Analyzer as shown in the figure
below.
Make certain that the radio under test is configured as described in the
corresponding diagram before attempting to perform an alignment or test.
Failure to do so may result in poor radio performance and/or damage to the
analyzer or radio equipment under test.
4.1. NX Portable Test Setup
Refer to the diagram below for the proper test setup. Note that the correct setting for
each test set switch is listed in TEST SET SETTINGS.
Note: Approved USB to serial adapters for connecting the R8000 analyzer to the
Kenwood NX series radio under test include any adapters which utilize an FTDI
FT232_USB to serial UART interface OR Prolific Technology Inc. PL-2303 USB to serial
controller interface. See http://www.ftdichip.com/Products/ICs/FT232R.htm or
http://www.prolific.com.tw/US/ShowProduct.aspx?pcid=41 for more detail.
Figure 4-1. NX Portable Test Setup Diagram

Kenwood NX Series AutoTune™ User Guide
3
5. Kenwood NX Portable Alignment and Test Descriptions
Note: Throughout this section are references to Test Frequency. Test Frequencies are
band- and mode -specific. A table of the frequencies used by each band may be found
in the respective radio service manual.
Note: All analyzer Mode settings are Standard unless otherwise indicated.
5.1. Assist Voltage
5.1.1. Alignment
The radio is placed into Test Mode and its VCO lock voltage is adjusted at several RX
and TX Test Frequency points. The new softpot values for the voltages are then
programmed into the radio.
Name
Description
Result
Pass or Fail. Pass as long as no radio error detected.
Softpot
Radio softpot after alignment
Table 5-1. Reference Frequency alignment results
5.1.2. Test
There is no Assist Voltage test.

Kenwood NX Series AutoTune™ User Guide
4
5.2. Reference Frequency
RF Control
Port
Frequency
Modulation
Output Level
Generate
RF IN/OUT
Test Frequency
FM
-30 dBm
Table 5-2. Analyzer Configuration for Reference Frequency
5.2.1. Alignment
The radio is placed into Test Mode at a TX Test Frequency and commanded to
transmit. Using a best linear fit algorithm, two frequency error measurements are taken
at two different radio softpot values. These frequency error measurements are used to
calculate the softpot value which minimizes frequency error. After programming this new
softpot value into the radio, the radio softpot is fine tuned until minimum frequency error
is detected. The frequency error is compared against test limits and the final results
written to the log file.
Name
Description
Result
Pass or Fail. Pass as long as no radio error returned
Frequency
Test Frequency
New Softpot
Radio softpot after alignment
Temp (23 - 27° C)
Internal radio temperature, in Celsius. Ideal temperature is
between 23 and 27 degrees Celsius.
Table 5-3. Reference Frequency alignment results
5.2.2. Test
The radio is placed into Test Mode at a TX Test Frequency and commanded to
transmit. The frequency error is measured by the analyzer and compared to test limits.
The final results are written to the log file.
Name
Description
Result
Pass or Fail. Frequency Error within Max Limit, Min Limit
Frequency
Test Frequency
Freq Error
Measured frequency error
Min Limit
Minimum Limit (inclusive) for frequency error
Max Limit
Maximum Limit (inclusive) for frequency error
Temp (23 - 27° C)
Internal radio temperature, in Celsius. Ideal temperature is
between 23 and 27 degrees Celsius.
Table 5-4. Reference Frequency test results

Kenwood NX Series AutoTune™ User Guide
5
5.3. TX Power
RF Control
Port
Frequency
Modulation
Attenuation
Monitor
RF IN/OUT
Test Frequency
FM
30 dB
Table 5-5. Analyzer Configuration for TX Power
5.3.1. Alignment
The TX Power Out alignment aligns the power output level of the radio at both High and
Low power levels. The radio is placed into Test Mode and commanded to transmit at
the first Test Frequency and the High power setting. For each test frequency, the output
level is measured and then adjusted until near to a band-specific output level defined by
the respective Kenwood NX Portable radio service manuals.
Model
High Power Limits(W)
Low Power Limits(W)
NX-410 (800 MHz)
2.8 - 3.2
0.9 - 1.1
NX-411 (900 MHz)
2.3 - 2.7
0.9 - 1.1
All other models
4.8 - 5.2
0.7 - 0.9
Table 5-6. Kenwood NX Portable specified target power
This process is repeated for the Low Power setting. The final results are written to the
log file.
Name
Description
Result
Pass or Fail. Power Out within manufacturer limits
Frequency
Test Frequency
Power Out
Measured radio output level
Min Limit
Minimum Limit (inclusive) for Power Out
Max Limit
Maximum Limit (inclusive) for Power Out
Old Softpot
Original radio softpot setting
New Softpot
Radio softpot after alignment
Table 5-7. TX Power alignment results
5.3.2. Test
The radio is placed into Test Mode and commanded to transmit. Beginning at the first
TX Test Frequency, the output level is measured at each TX Test Frequency, for High
Power and Low Power, and compared against test limits. The final results are written to
the log file.

Kenwood NX Series AutoTune™ User Guide
6
Name
Description
Result
Pass or Fail. Power Out within Max Limit, Min Limit
Frequency
Test Frequency
Power Out
Measured radio output level
Min Limit
Minimum Limit (inclusive) for Power Out
Max Limit
Maximum Limit (inclusive) for Power Out
Softpot
Radio softpot which yields Power Out
Table 5-8. TX Power test results

Kenwood NX Series AutoTune™ User Guide
7
5.4. TX Modulation
The TX Modulation alignment and test includes both TX Balance alignment/test as well
as TX Maximum Deviation alignment/test.
RF Control
Port
Frequency
Modulation
Attenuation
Monitor
RF IN/OUT
Test Frequency
FM
30 dB
Table 5-9. Analyzer Configuration for Modulation Balance test, alignment
5.4.1. TX Balance Alignment
The radio is placed into Test Mode at low power at the first TX Test Frequency and
commanded to transmit. The radio generates a Low modulation tone and the ±Peak/2-
averaged deviation of this tone is measured with the analyzer. The radio then generates
a High modulation tone and the ±Peak/2-averaged deviation of this tone is measured
with the analyzer. The radio softpot is adjusted until the deviation difference between
the first and second tones is within test limits. This adjustment is performed for each TX
Test Frequency. The results for each TX Test Frequency are written to the log file.
The Variance is calculated as:
100*
(%)
LOW
HIGHLOW
Deviation
DeviationDeviation
Variance
Name
Description
Result
Pass or Fail. Calculated difference between Low and High tone
deviation less than or equal to Dev Ratio.
Frequency
Test Frequency
Variance
Calculated difference, in %, between Low and High tone deviation
Max Limit
Maximum passable % difference (inclusive) between low and high
tone deviation.
Old Softpot
Original radio softpot setting
New Softpot
Radio softpot setting after alignment
Table 5-10. TX Balance alignment results
5.4.2. TX Balance Test
The radio is placed into Test Mode at the first TX Test Frequency and commanded to
transmit. The radio generates a Low modulation tone and the ±Peak/2-averaged
deviation of this tone is measured with the analyzer. The radio then generates a High
modulation tone and the ±Peak/2-averaged deviation of this tone is measured with the
analyzer. The percent difference is compared against test limits and written to the log
file. This test is performed for each remaining TX Test Frequency.

Kenwood NX Series AutoTune™ User Guide
8
Name
Description
Result
Pass or Fail. Deviation is less than or equal to Max Limit.
Frequency
Test Frequency
Low Tone
Measured low tone deviation level.
High Tone
Measured high tone deviation level.
Variance
Calculated difference, in %, between Low and High tone deviation
Max Limit
Maximum passable deviation (inclusive)
Softpot
Radio softpot which yields Variance
Table 5-11. TX Balance test results
5.4.3. TX Maximum Deviation Alignment
The radio is placed into Test Mode at low power at the first bandwidth, first TX Test
Frequency and commanded to transmit. The radio generates a modulation tone and the
±Peak/2-averaged deviation of this tone is measured with the analyzer. The radio
softpot is adjusted until the deviation is within test limits. This adjustment is performed
for each TX Test Frequency. The results for each TX Test Frequency are written to the
log file.
Name
Description
Result
Pass or Fail. Calculated difference between Low and High tone
deviation less than or equal to Dev Ratio.
Frequency
Test Frequency
Deviation
Measured maximum deviation level
Min Limit
Minimum passable deviation level
Max Limit
Maximum passable deviation level
Old Softpot
Original radio softpot setting
New Softpot
Radio softpot setting after alignment
Table 5-12. TX Maximum Deviation alignment results
5.4.4. TX Maximum Deviation Test
The radio is placed into Test Mode at low power at the first TX Test Frequency and
commanded to transmit. The radio generates a modulation tone and the ±Peak/2-
averaged deviation of this tone is measured with the analyzer. This test is performed for
each TX Test Frequency. The test results for each TX Test Frequency are written to the
log file.

Kenwood NX Series AutoTune™ User Guide
9
Name
Description
Result
Pass or Fail. Deviation is less than or equal to Max Limit.
Frequency
Test Frequency
Deviation
Measured maximum deviation level
Min Limit
Minimum passable deviation level
Max Limit
Maximum passable deviation level
Softpot
Radio softpot which yields Deviation
Table 5-13. TX Maximum Deviation test results

Kenwood NX Series AutoTune™ User Guide
10
5.5. TX Signaling
RF Control
Port
Frequency
Modulation
Attenuation
Monitor
RF IN/OUT
Test Frequency
FM
30 dB
Table 5-14. Analyzer Configuration for TX Signaling test, alignment
5.5.1. TX Signaling Alignment
The radio is placed into Test Mode at low power at the first bandwidth and first TX Test
Frequency and commanded to transmit. The radio modulates the Test Frequency using
the modulation types in Table 5-15 in sequence. The ±Peak/2-averaged modulation
deviation is measured with the analyzer. The radio softpot is adjusted until the deviation
is within test limits. This adjustment is performed for each TX Test Frequency. The
results for each TX Test Frequency are written to the log file.
Modulation
Description
QT
Quiet Talk
DQT
Digital Quiet Talk
LTR
Logic Trunked Radio
DTMF
Dual-tone multi-frequency
Single Tone
Single modulation frequency
MSK
Minimum-shift keying
CWID
Continuous Wave Identification
Table 5-15. TX Signaling modulation types
Name
Description
Result
Pass or Fail. Calculated difference between Low and High tone
deviation less than or equal to Dev Ratio.
Frequency
Test Frequency
Deviation
Measured modulation deviation level
Min Limit
Minimum passable deviation (inclusive)
Max Limit
Maximum passable deviation (inclusive)
Old Softpot
Original radio softpot setting
New Softpot
Radio softpot setting after alignment
Table 5-16. TX Signaling alignment results
5.5.2. TX Signaling Test
The radio is placed into Test Mode at the first bandwidth and first TX Test Frequency
and commanded to transmit. The radio generates a Low modulation tone and the
±Peak/2-averaged deviation of this tone is measured with the analyzer. The radio then
generates a High modulation tone and the ±Peak/2-averaged deviation of this tone is
measured with the analyzer. The deviation is compared against test limits and written to
the log file. This test is performed for each remaining TX Test Frequency.

Kenwood NX Series AutoTune™ User Guide
11
Name
Description
Result
Pass or Fail. Deviation is less than or equal to Max Limit.
Frequency
Test Frequency
Deviation
Measured modulation deviation level
Min Limit
Minimum passable deviation (inclusive)
Max Limit
Maximum passable deviation (inclusive)
Softpot
Radio softpot which yields Deviation
Table 5-17. TX Signaling test results

Kenwood NX Series AutoTune™ User Guide
12
5.6. TX VOX
NOTE: The TX VOX alignment is only applicable to NX Portable radios.
Mode
Audio Frequency
Amplitude
VOX1
1 kHz
45 mVRMS (64 mVpk)
VOX10
1 kHz
3 mVRMS (4 mVpk)
Table 5-18. Analyzer Configuration for TX VOX1/10 alignment
5.6.1. TX VOX Alignment
The radio is placed into Test Mode. The VOX sensitivity is measured for both VOX 1
and VOX 10 levels. New VOX1 and VOX 10 levels are set using these sensitivity
measurements. The results for each VOX level are written to the log file.
Name
Description
Result
Pass or Fail. Pass unless a radio error occurs.
VOX1 Softpot
New programmed softpot based on VOX1 sensitivity level
Audio Voltage
VOX1 audio voltage level
VOX10 Softpot
New programmed softpot based on VOX10 sensitivity level
Audio Voltage
VOX10 audio voltage level
Table 5-19. TX VOX1/10 alignment results
5.6.2. TX VOX Test
There is no TX VOX test.

Kenwood NX Series AutoTune™ User Guide
13
5.7. RX Sensitivity
NOTE: This test requires an analyzer with NXDN test mode (R8-NXDN or R8-
NXDNTYPC option) capability.
RF Control
Port
Frequency
Modulation
Level
Generate
RF IN/OUT
Test Freq
Analog:
Wide(5k): 1 kHz @ 3 kHz
Wide(4k): 1 kHz @ 2.4 kHz
Narrow: 1 kHz @ 1.5 kHz
Digital:
FSW+PN9 test pattern
Model-
specific
Table 5-20. Analyzer Configuration for RX Sensitivity test
5.7.1. Alignment
Alignment not currently available.
5.7.2. Test (Analog)
The analyzer is setup by applying the Modulation signal in Table 5-20 to the radio and
then adjusting radio volume for Rated Audio. The radio is placed into Test Mode at the
first bandwidth and first RX Test Frequency. The output level of the analyzer is then
adjusted until the radio audio signal’s SINAD level measures about 12 dB. The current
analyzer output level is then compared against test limits. The final results are written to
the log file. This process is repeated for each bandwidth and each RX Test Frequency.
Name
Description
Result
Pass or Fail. Sensitivity (SINAD) level within Max Limit
Frequency
Test Frequency
12dB SINAD
Analyzer output level at which the radio SINAD level measures about
12 dB
Max Limit
Maximum Limit (inclusive) for RX Sensitivity to Pass
Table 5-21. RX Sensitivity test results
5.7.3. Test (Digital)
The analyzer is setup by applying the Modulation signal in Table 5-20 to the radio. The
radio is placed into Test Mode at the first bandwidth and first RX Test Frequency. The
output level of the analyzer is then adjusted until the radio’s BER level measures about
3%. The current analyzer output level is then compared against test limits. The final
results are written to the log file. This process is repeated for each bandwidth and each
RX Test Frequency.
Other manuals for R8000 Series
3
Table of contents
Other Freedom Measuring Instrument manuals
Popular Measuring Instrument manuals by other brands

Hioki
Hioki SAFETY HiTESTER 3258 Quick user guide

Tyredog
Tyredog TD2700F Adding a Relay / Programming Sensors

Veris Industries
Veris Industries E51H2 installation guide

Kofloc
Kofloc RK1812 Series instruction manual

Keysight Technologies
Keysight Technologies M9370A Configuration guide

Kistler
Kistler 2549A Quick Start Installation