Furuno WV-100 User manual

www.furuno.com
OPERATOR'S MANUAL
波浪解析ソフトウェア
取扱説明書
Wave Analyzer
Model
WV-100
WV-100ST


i
TABLE OF CONTENTS
FOREWORD................................................................................................................. ii
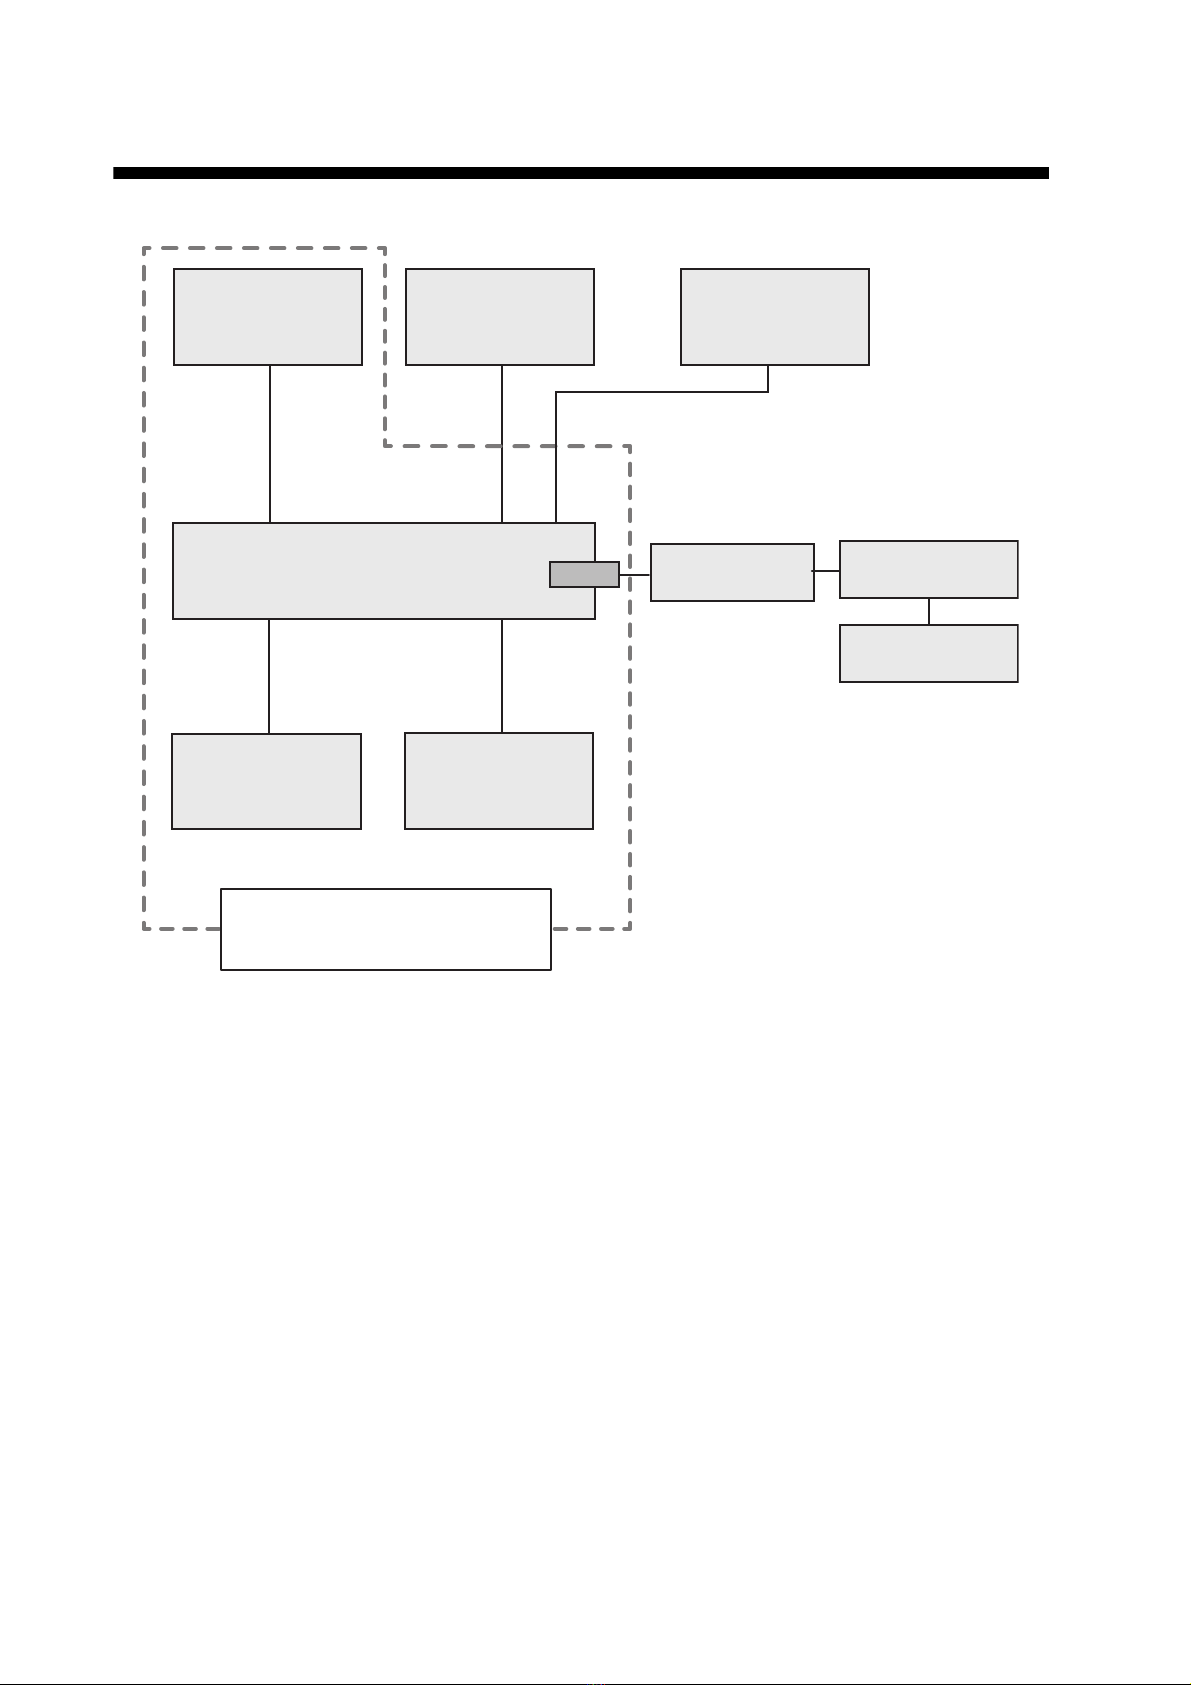
SYSTEM CONFIGURATION ....................................................................................... iv
1. OPERATIONAL OVERVIEW................................................................................. 1
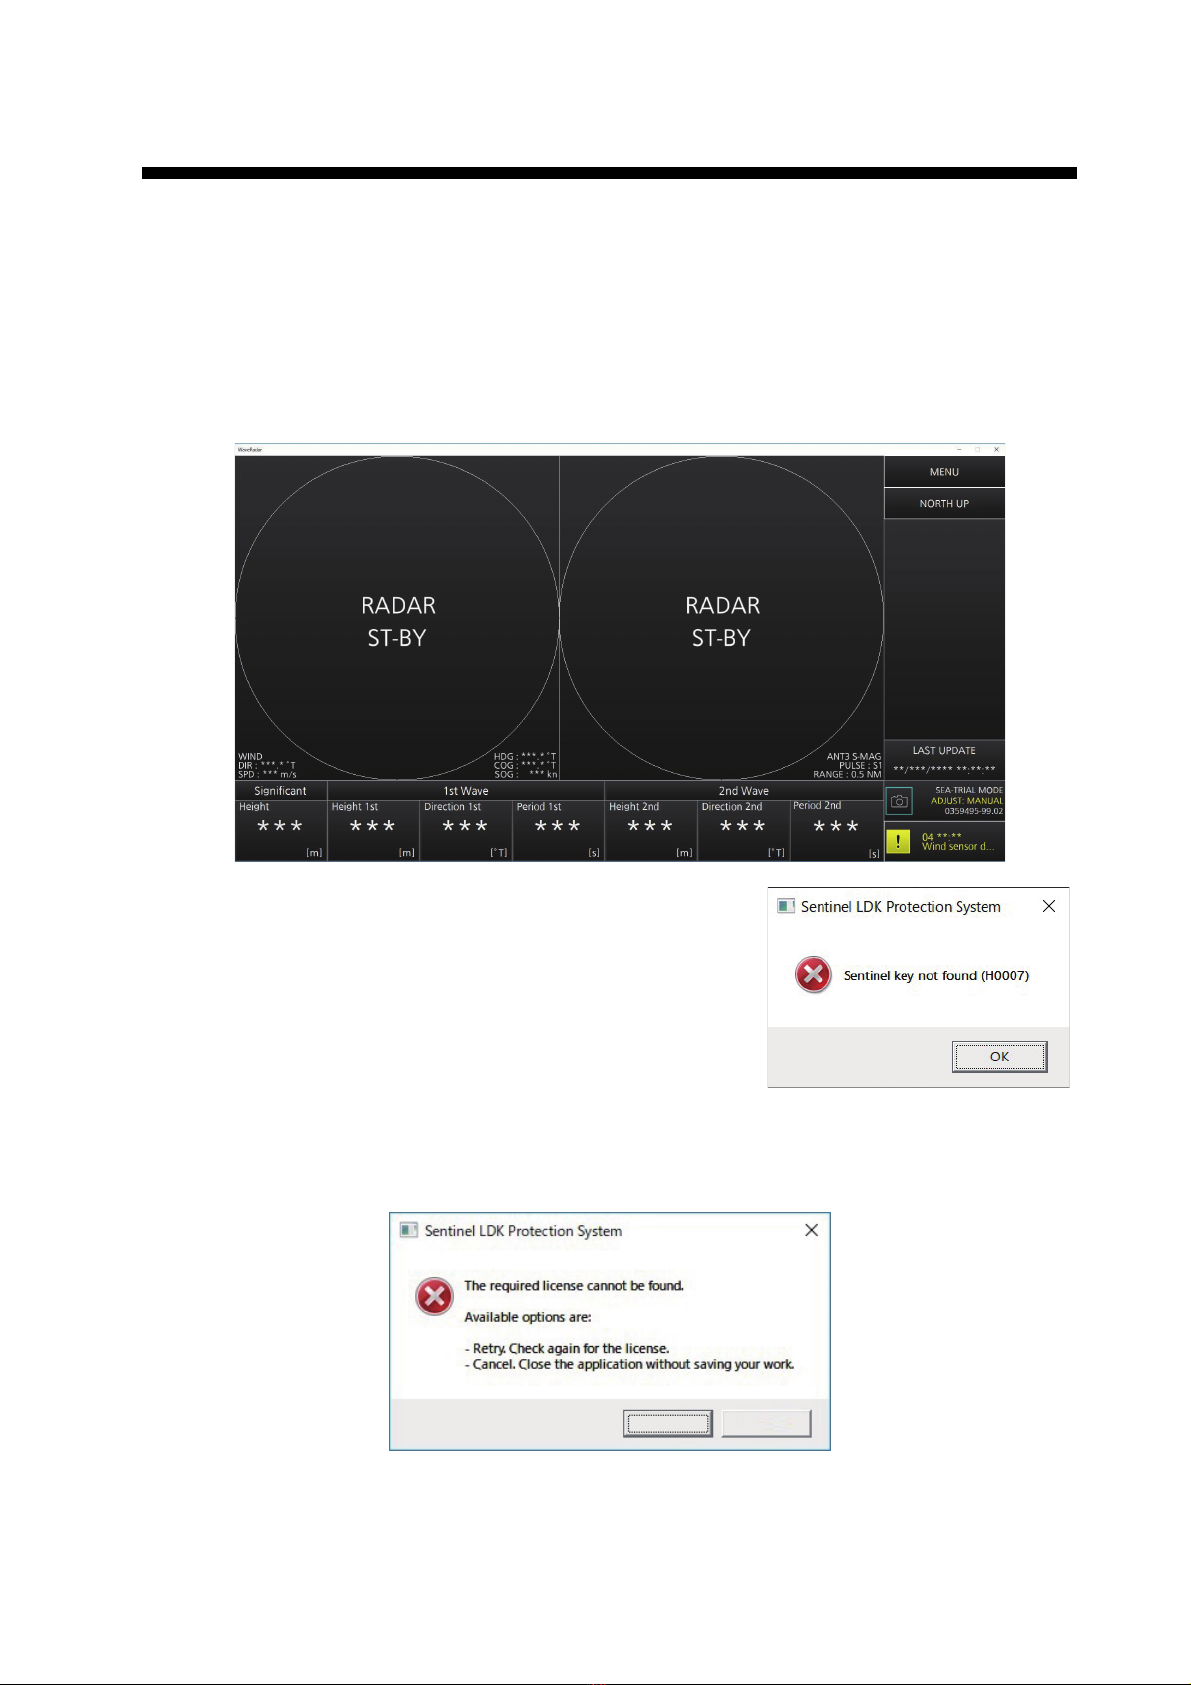
1.1 How to Start and Quit the Software............................................................................ 1
1.2 Display Screen Overview ........................................................................................... 3
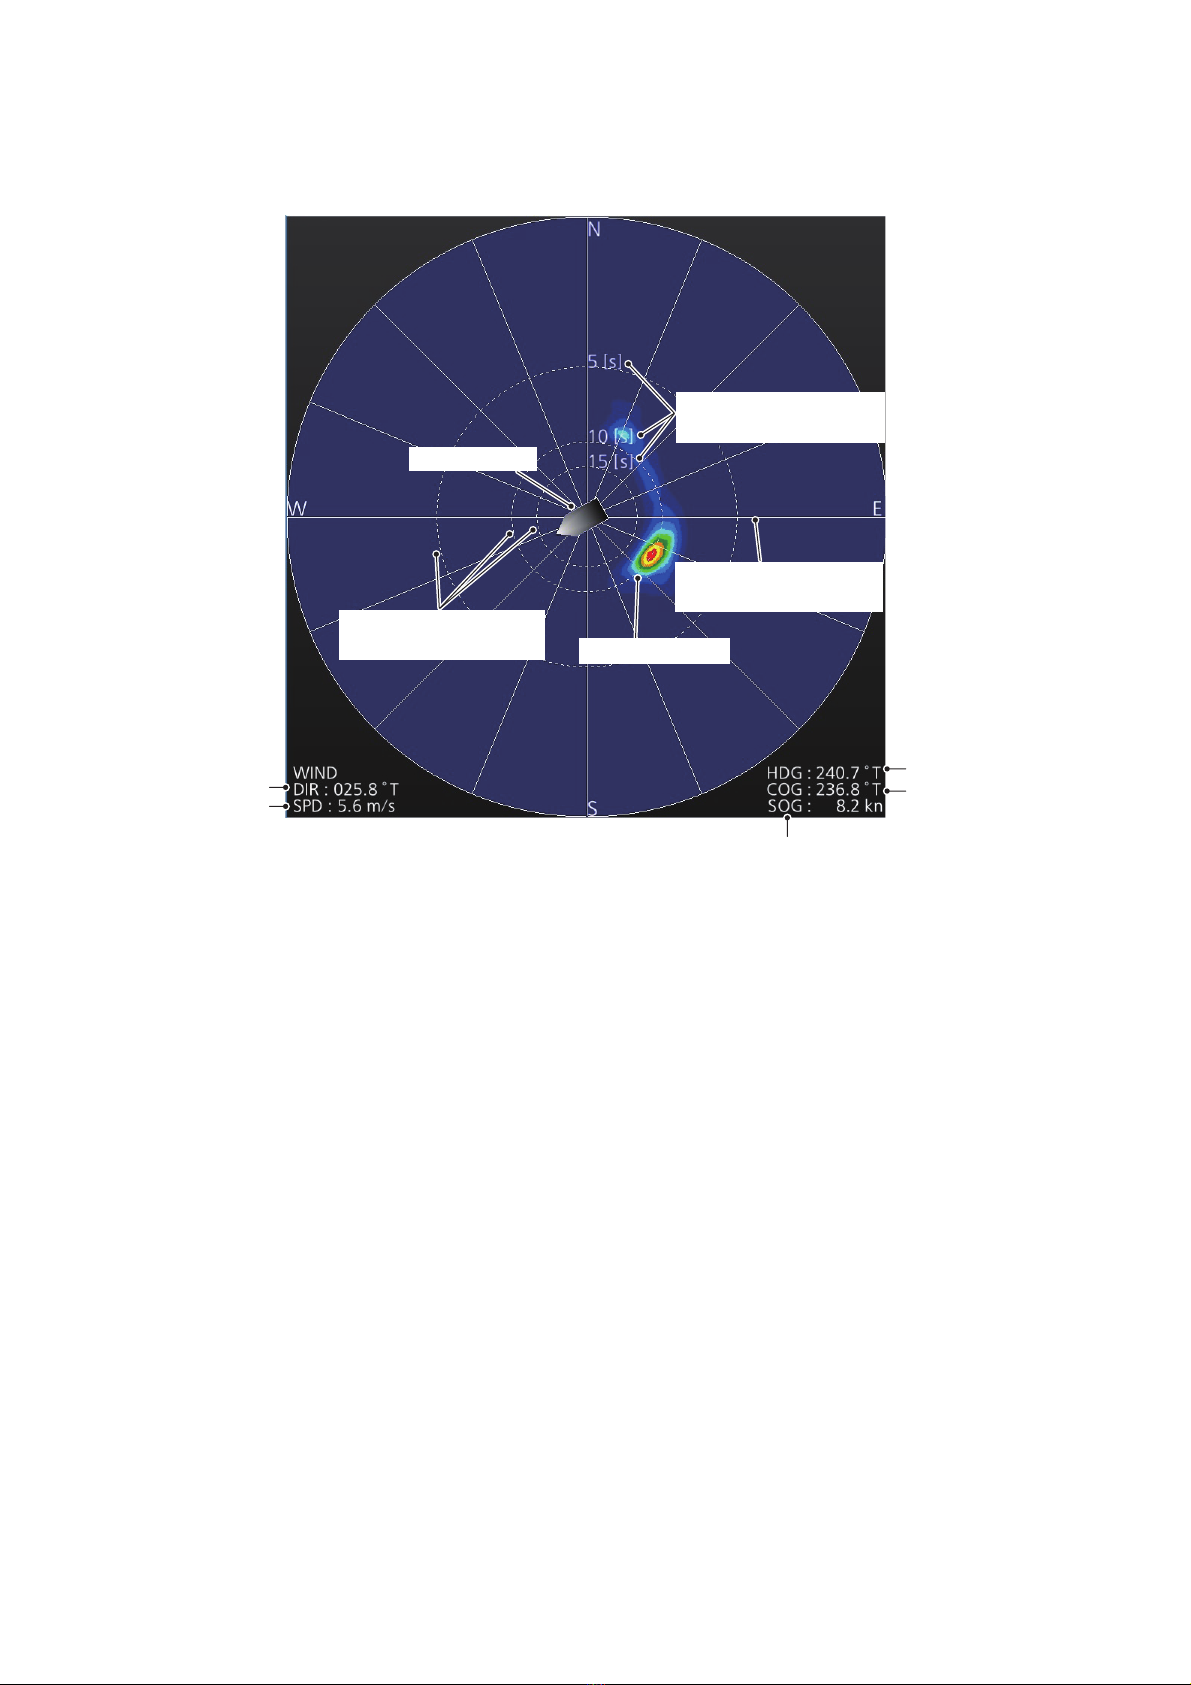
1.2.1 Wave spectrum display area............................................................................... 4
1.2.2 Radar echo display area ..................................................................................... 5
1.2.3 Significant wave height, wave information .......................................................... 5
1.3 Keyboard Operations.................................................................................................. 6
1.4 Orientation Mode ........................................................................................................ 6
1.5 Analysis Update Time................................................................................................. 7
1.6 Menu Overview........................................................................................................... 7
1.7 How to Take a Screenshot of a Display Screen......................................................... 7
1.8 System Information..................................................................................................... 7
1.9 How to Update the Software....................................................................................... 8
2. PRINCIPLE OF OPERATION, HOW TO INTERPRET THE DISPLAY ............... 10
2.1 Principle of Measurement......................................................................................... 10
2.2 Reliability of Analysis Results................................................................................... 10
3. ALERTS ............................................................................................................... 12
4. TROUBLESHOOTING......................................................................................... 13
4.1 Troubleshooting........................................................................................................ 13
4.2 System Information................................................................................................... 14
APPENDIX1 MENU TREE...................................................................................... AP-1
APPENDIX2 ALERT LIST ...................................................................................... AP-2
APPENDIX3 SERIAL OUTPUT DATA ................................................................... AP-3
APPENDIX4 SEA-TRIAL MODE (For WV-100ST) ................................................ AP-5
63(&,),&$7,21663

ii
FOREWORD
Congratulations on your choice of the FURUNO Wave Analyzer WV-100/WV-100ST. We are con-
fident you will see why the FURUNO name has become synonymous with quality and reliability.
Since 1948, FURUNO Electric Company has enjoyed an enviable reputation for innovative and
dependable marine electronics equipment. This dedication to excellence is furthered by our ex-
tensive global network of agents and dealers.
Please carefully read and follow the recommended procedures for operation and maintenance.
Features
This software, installed in a PC, analyzes and displays the wave radar data obtained from the FU-
RUNO model chart radar FAR-3xx0 or marine radar FAR-2xx8 series.
• Automatic wave height adjustment.
• Wave analysis for both X-band and S-band radars.
• Equipped with sea trial mode (WV-100ST only).
• Always connect the PC to the Navigation network via a firewall device, as shown in the System
Configuration diagram.
Usage Precautions
To prevent potential damage to your radar, follow the below precautions:
• Only connect the analysis PC for wave analysis. Do not connect the PC for any other purpose.
• Do not install any other software on the PC, other than this analysis software.
• Always connect the PC to the Navigation network via a firewall device, as shown in the System
Configuration diagram.
• Do not connect the analysis PC to the ship-board network, or other networks, directly. Always
perform updates to Windows and anti-virus software while offline.
• Before connecting a USB Flash Memory or other USB storage device to the PC, preform a virus
check on the device and confirm that the storage can safely be connected to the PC.
• Only authorized personnel (PC administrator or users with administrative privileges) should use
this software.
• Anti-virus and security software can prevent this software from working correctly. Adjust your
anti-virus and security settings so that this software is white-listed. This software is designed to
be compatible with Windows Defender.
• Before using the PC for a purpose other than wave analysis, or before discarding the PC, unin-
stall this software.

FOREWORD
iii
Restrictions on wave analysis
The following restrictions apply to wave analysis.
Radar settings
• Pulse width: Must be set between S1 and M1 (S1 has the highest measurement accuracy.)
• The wave analysis is not available when using the interswitch function. (The slave echo for the
interswitch is used for the wave analysis. The wave setting is canceled at the interswitch.)
Operational specification of wave radar
• This software analyzes wave data using the radars specified beforehand.
• To enable wave analysis, access the settings on the connected radar and switch [WAVE
MODE] to [ON].
In both cases, an error display appears when the analysis results are outside the capabilities of
this software.
Program version no.
0359495-01.**
* denotes minor modifications.
Software used in this product
This product includes software to be licensed under BSD, MIT, zlib, FTL, NVIDIA CUDA Toolkit
License Agreement. Please refer to the OSS directory in the supplied CD-ROM for details on the
terms of the software.

iv
SYSTEM CONFIGURATION
LAN1
Antenna Unit Gyrocompass,
GPS Navigator Wind Sensor*1
Intelligent HUB
HUB-3000
Processor Unit
Control Unit Monitor Unit
CHART RADAR FAR-3xx0 series
or
MARINE RADAR FAR-2xx8 series
PC*2 for wave analysis
(Local supply, wave analyzer
software installed in PC)
*1: For wave analysis, required wind
direction/speed data from the
wind sensor. The data should be
directly input to the radar, or
available on the network via
sensor adapter.
*2: The PC should be connected to the
LAN1 port during wave analysis.
Firewall
Wave analysis PC

1
1. OPERATIONAL OVERVIEW
1.1 How to Start and Quit the Software
1. Power the FAR-3xx0 or FAR-2xx8 series.
2. Insert the USB dongle into a USB port on the PC. The LED in the dongle lights red.
Note: The USB dongle is required to use this software. Take care not to lose it.
3. Power the PC. The software automatically starts up and the following screen appears.
Note 1: If the message shown to the right figure appears,
click [OK] to delete the message and then re-insert the
USB dongle.
Note 2: If the message for software error appears, click
[OK] to delete the message and then re-insert the USB
dongle. Double-click the shortcut icon for the software on
the desktop to start up the software.
Note 3: If the USB dongle is removed after starting the software, the following message ap-
pears.
Click [Cancel] to quit the software. Insert the USB dongle and double-click the shortcut icon
for the software on the desktop to restart the software.
Retry Cancel

1. OPERATIONAL OVERVIEW
2
Note 4: If the firewall is not configured, the error message to the below-left appears. Click
[OK], the message to the below-right then appears.
Click [OK] to delete the message, then open the [Enable Firewall for Wave Analyzer] shortcut
on your desktop. If the [User Account Control] dialog appears, click [Yes].
4. To quit the software, click the close button (x) at the upper right corner of the screen. The con-
firmation message "Are you sure you want to exit?" appears.
5. Click [YES] to quit the software.
Check of the setting file at startup
This software checks if the setting file can be read at startup. If the setting file is corrupted, the
following message appears.
• Click [YES] to restore the default settings, then start up the software. The saved settings are
deleted.
• Click [NO] to cancel and close the software.
Attention!
Startup failed because setting file can not be read.
Restore all default settings and restart the software?
NO
(Cancel and exit)
YES
(Restore and restart)

1. OPERATIONAL OVERVIEW
3
1.2 Display Screen Overview
The screen looks something like the one shown below when the radar is transmitting pulses and
waves are being analyzed.
While wave analysis is stopped, the PC screen looks like the following depending on the radar
state.
• Radar is in stand-by: "RADAR ST-BY" is displayed at the center of the left and right screens.
• Radar is disconnected: "NO RADAR" is displayed at the center of the left and right screens.
When the wave analysis contains an error, the message "Wave analysis is not available." appears
at the center of the left screen.
No. Name Description
1 Wave spectrum display area Shows 2D wave spectrum.
2 Radar echo display area Shows radar echo for wave analysis from the specified ra-
dar.
3 Wind sensor information Shows wind direction and wind speed.
4 Own ship information Shows HDG (heading), COG (Course Over Ground), and
SOG (Speed Over Ground).
5 Radar information Shows antenna ID, band width, transceiver type, pulse
width, display range of the connected radar.
6 Significant wave height Shows significant wave height.
7 First wave information Shows wave height, wave direction and wave period for first
wave.
8 Second wave information Shows wave height, wave direction and wave period for
second wave.
9 Software display state Selects the software display state. (Minimize, Maximize
(grayed out, no use), Close from the left)
10 [MENU] Opens/closes the menu.
11 Orientation mode box Selects the orientation mode.
12 Update time box Shows the time of the most recent wave analysis.
13 Camera icon/System informa-
tion box
• Camera icon: Takes a screenshot.
• System information: Shows sea-trial mode*, manual ad-
justment mode of wave height, and software version.
*: No indication for normal mode.
14 Alert information box Shows active alerts (alert icon and alert message).
99
11
33
44
22
55
1010
1111
1414
667788
1313
1212
13
25

1. OPERATIONAL OVERVIEW
4
1.2.1 Wave spectrum display area
The 2D analyzed wave spectrum is displayed on the left side of the screen.
• Wave period: The wave periods, or time between waves, appear in the wave spectrum display
area as dashed circles and numerical values (numerical positions are fixed). The wave period
is 15 seconds, 10 seconds, 5 seconds in order of increasing distance to own ship. The farther
away from own ship, the shorter the waves (wind waves), the closer to own ship, the longer the
waves (swells). The periods displayed on the screen are not proportionally displayed due to fre-
quency being used as a distance substitute.
• Wind waves: Waves generated by the wind blowing on the sea.
• Swells: Waves that remain after the waves developed by the wind disappears, or waves that
are detected from a distance and attenuate as they approach.
• Bearing line: The 360° azimuth is divided into 16 with solid lines at 22.5° intervals to make the
waves’ approach easier to understand.
• Wave spectrum: The color of the wave spectrum indicates the relative intensity of the wave on
the wave spectrum display. The intensity of the wave increases in order of dark blue, light blue,
light green, dark green, orange, yellow, red.
• Own ship icon: The own ship icon is displayed at the center of the screen.
Own ship icon
Wind speed
Wind direction
Speed over ground
Course over
ground
Heading
Wave periods displayed
in dashed circles
Wave periods displayed
as numerical values
Wave spectrum
Bearing lines displayed
in 16 solid lines

1. OPERATIONAL OVERVIEW
5
1.2.2 Radar echo display area
The radar echo for wave analysis from the specified radar is displayed on the right side of the
screen.
• Bearing line: The 360° azimuth is divided into four with solid lines at 90° intervals to make the
direction easier to understand.
• Radar echo (for the wave analysis): The absolute intensity of the radar reflection from the wave
increases in order of dark blue, light blue, light green, dark green, orange, yellow, red.
• Own ship icon: The own ship icon is displayed at the center of the screen.
1.2.3 Significant wave height, wave information
The significant wave height and wave information are displayed at the bottom of the screen.
• [Significant]: Shows the significant wave height. The significant wave height is a statistical value
obtained by averaging the top 1/3 highest waves when observing the specified area. Although
its value is different from the maximum value or the simple average value, it is the closest value
to the wave height visually observed by a skilled observer.
• [1st Wave], [2nd Wave]: Among the observed waves, the two most outstanding waves are se-
lected and assigned as [1st Wave] and [2nd Wave] for reference. There is no distinction made
between wind waves and swells for this selection.
Own ship icon
Bearing lines displayed
in four solid lines
Display range
Radar echo
Pulse width
Antenna ID, Band width,
Transceiver type
First wave information Second wave information
Significant
wave height
“***” appears when there is no calculation data.
- Height: Wave height
- Direction*: Wave direction
- Period: Wave period
*: °T for North Up mode,
°R for Head Up mode

1. OPERATIONAL OVERVIEW
6
The reliability (degree of trust) of the analysis result of the first or second wave is indicated with a
numerical index of 0 to 100. The character color changes according to the degree of trust.
Note: It is recommended to use the analysis result with a reliability of “High” or “Middle”. For “Mid-
dle”, take care of the precision.
*: Set these values in the [INITIAL SETTINGS] menu at installation.
1.3 Keyboard Operations
This software uses the Tab key, Enter key and Space key in the following manner:
• Tab: Cycles through [MENU] →Orientation mode box →Camera icon →Alert information box
→… in order.
• Enter/Space: Confirm selection.
1.4 Orientation Mode
Click the orientation mode box at the top right position of the screen to switch between North UP
mode and Head UP mode.
Reliability Index*
(default) Color/display example Description
High 70 or more White The sea weather condition is suit-
able for wave analysis. The preci-
sion and accuracy of the analysis
result is high.
Middle 45 or more and
less than 70
Yellow The sea weather condition is
slightly unsuitable for wave analy-
sis. The precision of the analysis
result is low and there is variation,
but the accuracy is great.
Low Less than 45 Orange The sea weather condition is not
suitable for wave analysis. The
precision and accuracy of the anal-
ysis result is low.
The head-up mode is a display in which the
line connecting own ship and the top of the
display indicates own ship's heading.
North bearing is maintained at the top of the
screen. The heading line changes its direc-
tion according to the ship's heading.
North marker Heading line
Heading line
North marker
North UP Head UP

1. OPERATIONAL OVERVIEW
7
1.5 Analysis Update Time
The time (UTC) of the most recent wave analysis is displayed at the bottom right of the screen.
When wave analysis is not done immediately after software startup or date and time information
is not input, the indication appears as "**/***/**** **:**:**".
1.6 Menu Overview
1. Click [MENU] to open the menu.
2. Click the desired menu item to highlight it.
3. Click [MENU] to close the menu.
1.7 How to Take a Screenshot of a Display Screen
Click the camera icon at the bottom right of the screen to take a screenshot. Screenshots are
saved in the folder “C: \ Users \ User name \ Documents \ FURUNO \ WaveAnalyzer \ screenshot”.
When the folder becomes full, the message "Storage size is full." appears. Delete unnecessary
data to make room. Also, you can not take a screenshot while the menu is open.
1.8 System Information
The system information is displayed at the bottom right of the screen.
Menu item Description
[1. SYSTEM MONITOR] Opens the system monitor window.
[2. ALERT STATUS] Opens the alert status window.
[3. INITIAL SETTINGS] Opens the initial settings window (for qualified technician, required
the password).
LAST UPDATE
01/JAN/2019 15:10:27
Day
Month
Year
Hour
Minute
Second
1. SYSTEM MONITOR
2. ALERT STATUS
3. INITIAL SETTINGS
Shown in the sea-trial mode.
(No indication in the normal mode.)
Shown in yellow when setting the wave height analyzing
mode to Manual. (No indication for Auto mode.)
Program version no. of this software.
㻜㻝㻚㻜㻝

1. OPERATIONAL OVERVIEW
8
1.9 How to Update the Software
Make sure the software is closed before attempting to update the software. Also, log into the PC
with administrator privileges before updating the software.
1. Turn the PC on.
2. Insert or connect the update media to the PC. Consult your local dealer regarding the media.
3. Double-click [WaveAnalyzer_setup].
4. Double-click [WaveAnalyzerInstaller msi]. The following screen appears.
Note: When running the installer with the same version as the current software, the following
screen appears. Click [Cancel] to finish the installer and then install the new version software.
5. Click [Next].
x.x
Re-install the software.
Uninstall the software.

1. OPERATIONAL OVERVIEW
9
6. Click [Next]. To change the installation folder, click [Browse] and select the folder before click-
ing [Next].
7. Click [Next] to start the installation.
Note: If the dialog box [UserAccountControlSettings] appears, click [Yes] to start the installa-
tion.
When the installation is completed, the dialog box shown below appears.
8. Click [Close] to finish. The shortcut icons for the manual and related software are created on
your desktop.
Software for
wave analyzer
Operator’s
manual
Firewall-related software

10
2. PRINCIPLE OF OPERATION,
HOW TO INTERPRET THE DIS-
PLAY
2.1 Principle of Measurement
This software analyzes sea waves by using the received radar signal. When observing the waves
with the radar, sea clutter echoes appear as stripes.
The amplitude of the sea reflection echo depends on the roughness caused by the wind acting on
the sea reflection. (It is not the height of the wave.) This software obtains multiple echoes, pro-
cesses the data, and calculates the wave spectrum, wave height, wave direction, and wave peri-
od.
2.2 Reliability of Analysis Results
When the sea reflection echoes are displayed with stripes, the analysis results are more reliable.
When the sea reflection echoes are not displayed in stripes (lull, rain), the analysis results are less
reliable.
Example image for high reliability
Wave spectrum Radar echo

2. PRINCIPLE OF OPERATION, HOW TO INTERPRET THE DISPLAY
11
The figure below is an example of echo during rainfall. This image is less reliable because no
stripes are visible, that is, the spectrum is broadened and there are no outstanding waves.
Example image for low reliability
Difference for the wave result between this software and visual observation
The waves that can be detected by this software are gravity waves with a wave period of 4 sec-
onds or more. The waves with a short period, that is, the waves blown by the wind may not be
observed. Therefore, the visual wave direction and the analysis result may be different (see the
figure below).
Wave spectrum Radar echo
Detection
sensitivity
4 sec. 15 sec.
Wave period
: Wave radar (Detection sensitivity
for long period is high.)
: Visual observation (Detection
sensitivity for short period is high.)

12
3. ALERTS
Alerts are displayed at the bottom right of the screen, with the alert icon, alert number, alert mes-
sage, and time of alert.
The [Alert Status] displays the number and message of triggered alerts, including the time and
date triggered.
How to display the [Alert Status] screen
1. Click the alert icon to display the [Alert Status] screen. You can also display the [Alert Status]
screen by clicking [MENU] – [2 ALERT STATUS].
The alerts currently active are shown on the screen. When there is no alert, "No Alert" appears
at the center of the screen.
2. Click [Close] to close the [Alert Status] screen.
For details, see "ALERT LIST" on page AP-2.
05 17:20
Rada comm...
A
lert icon
Alert number
Alert message
Time of alert*
*: “**:**” appears when
there is no time input.
Alert Status
Close
15/JAN/2019 17:22
15/JAN/2019 16:37
15/JAN/2019 10:51
07 INT-SW status error.
05 Radar communication error.
03 Ship speed data error.
Date and time
of alert
Alert number
and message

13
4. TROUBLESHOOTING
4.1 Troubleshooting
This section provides simple troubleshooting procedures which the user can follow to restore nor-
mal operation. If you cannot restore normal operation, contact your dealer.
Problem Possible cause Remedy
Software does not start. The components (VisualC++
runtime) are not installed.
Install the supplied file “setup.exe”.
The USB dongle is not inserted. Check if the USB dongle is firmly in-
serted. The LED in the dongle lights
red when the dongle is recognized
correctly.
Software is already open. Since this software can not start mul-
tiple times, quit the software that is al-
ready activated.
Pictures are not updated
or freeze.
The memory for CPU or GPU is
insufficient.
• Restart the software.
• If there is software running other
than this software, exit it.
Reliability of analysis re-
sult remains “low”.
The sea weather conditions do
not meet the measurement con-
ditions of the wave radar.
In case of rainfall, switch to an S-band
radar.
GPU is highly loaded (high tem-
perature, power saving mode).
• Check if power is supplied to the
PC (the battery is not running).
• Check if the vents on the PC are
blocked.
The radar pulse width is not ap-
propriate.
Change the radar pulse width to S1
since S1 is the highest in measure-
ment accuracy.
The software does not
start if you click [Retry] af-
ter a USB dongle authen-
tication error occurs.
The USB dongle is not recog-
nized.
Restart the software.
The COM port does not
open.
The PC does not recognize the
COM port.
• Check if the port is recognized by
the device manager.
• Check the COM port driver.
The COM port is in use by other
software.
• Close if the COM port is opend by
another software.
• Quit the other software.
• Restart the PC.

4. TROUBLESHOOTING
14
4.2 System Information
The system information is displayed from the menu.
1. Click [MENU] to open the menu.
2. Click [1 SYSTEM MONITOR].
The results for items which fail the system monitor test appear in yellow text with the indication
"NG" (No Good).
Click [<]. Click [>].
Page 1
Page 2
Page 3
Click [<]. Click [>].
SYSTEM MONITOR 1/3
Close >
Wave Analyzer software version: 0359495-01.01
IP address: 192.168.31.226
Subnet mask: 255.255.255.0
Host name: RWV001
Primary Radar No.: RAS001
Radar ANT Speed: 24rpm
Wave height analyzing mode: Auto
SYSTEM MONITOR 2/3
Radar connection: OK(ANT1)
Sensor data
DATE: OK $GPZDA,042843.40,02,04,2019,00,00*67
COG/SOG: OK $GPVTG,30.0,T,0.0,M,10.0,N,10.0,K,A*10
POS: OK $GPGNS,042843.40,3442.019,N,13521.735,E,DDD,00,0.0,0.0
WIND: OK $WIMWV,0.0,T,10.0,K,A*11
HDG: OK
Pulse width < M2: OK (M1)
INT-SW status: OK
Data accurency: 1st OK(41) 2nd OK(39)
Storage size: OK
Dongle: OK
SYSTEM MONITOR 3/3
PC system information
OS: Microsoft Windows 10 Home 64-bit (10.0.15063, Build 17134)
Processor: Intel(R) Core(TM) i7-7700HQ CPU @ 2.80GHz
Memory: 8192MB RAM
GPU: NVIDIA GeForce GTX 1050
OpenGL version: 4.5.0 NVIDIA 376.74
Display memoty: 2048MB RAM
Display resolution: 1920 X 1080
<Close >
<Close
Other manuals for WV-100
1
This manual suits for next models
1
Table of contents
Languages:
Other Furuno Measuring Instrument manuals