greenTEG gSKIN Heat Flux User manual

Instruction Manual
for
gSKIN®Heat Flux Kit

gSKIN®Heat Flux Kit: Instruction Manual
2 / 7
greenTEG AG
Hofwisenstr. 50A
8153 Rümlang, Switzerland
T: +41 44 515 09 15
Content
1. Overview of gSKIN Heat Flux KIT content..................................................................................................................................2
2. General overview of the gSKIN®Heat Flux software .............................................................................................................2
3. Ready to measure in 5 minutes by following these steps ......................................................................................................3
1. Overview of gSKIN Heat Flux KIT content
By post:
1 gSKIN®Heat Flux Sensor
1 gSKIN®DLOG Data Logger
1 USB cable (PC to data logger)
By email:
Customers receive the link to the software and the password by
Email.
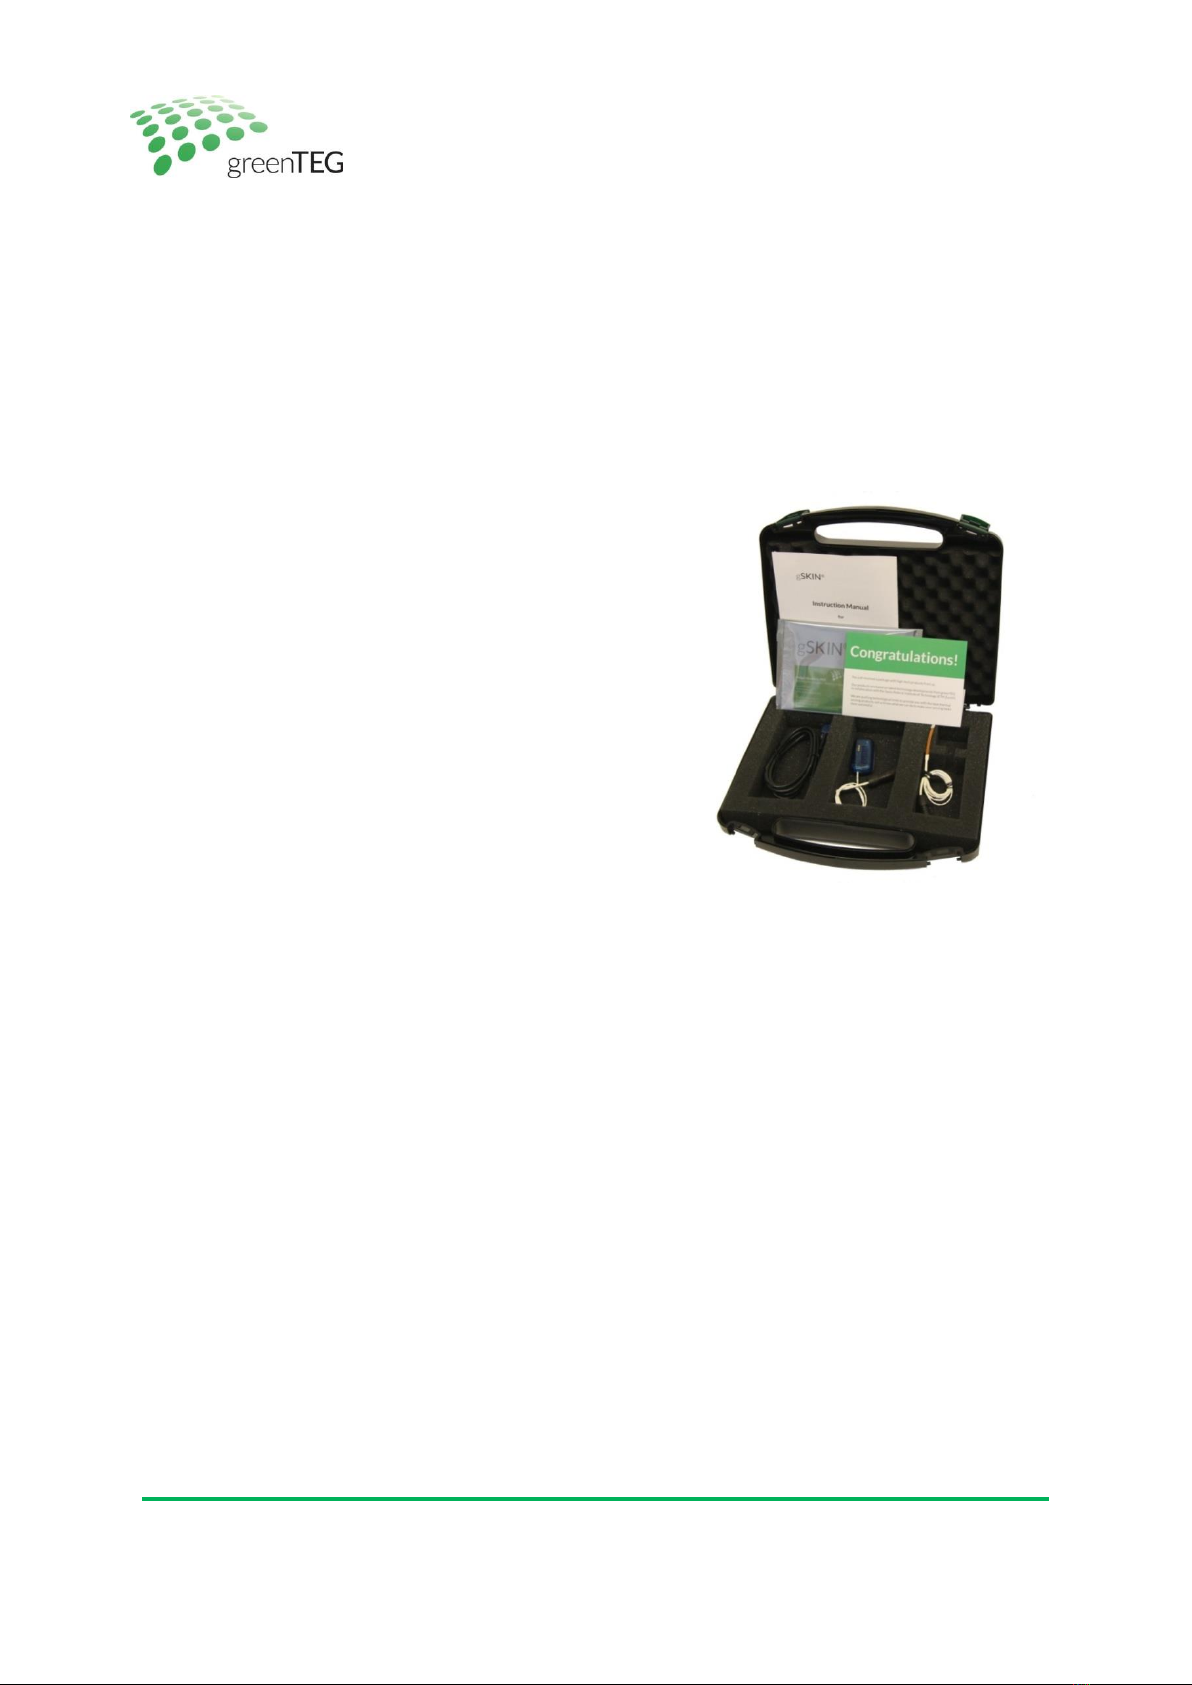
Figure 1: Heat Flux KIT in transport box
2. General overview of the gSKIN®Heat Flux software
The gSKIN® Heat Flux software is built upon a home screen with 7 functional buttons (see figure 2):
5 buttons in the centre of the home screen.
1. Real time measurement: This button allows the user to review in real-time all data points measured by the
gSKIN®Heat Flux sensor. With this menu-screen, one cannot start a new heat flux measuring process, it
can only be used for reviewing once the sensor is working and to show their real-time values
2. Start logging: From here, you can start your measuring process. Before starting, please select the
frequency at which you would like to log your data points (e.g. Sampling rate: every 1 second) and when you
want to start the measurement process (e.g. Start mode: immediately) (see figure 3)
3. Read record: Via this button, you can select measurement files which have been saved on your logger for
further analysis (e.g. export raw data, print PDF reports, etc.)
4. Analyse record: Here, you can search for other logger protocol files (*.msr) which have been saved on your
desktop
5. Exit: This button will close the program
Menu-button “File“ on the top left corner of the home screen can be used to end the program (“Exit”) and to
export data while you review data points in the “Read record”tab
Menu-button “Logger”on the top left corner of the home screen can be used to stop your measurement process

gSKIN®Heat Flux Kit: Instruction Manual
3 / 7
greenTEG AG
Hofwisenstr. 50A
8153 Rümlang, Switzerland
T: +41 44 515 09 15
greenTEG.com
and to delete all measurement files from the data logger (“Delete all stored data!”)
Figure 2: Home screen view with data logger connected to your laptop
3. Ready to measure in 5 minutes by following these steps
1. Connect the data logger to your computer via the delivered USB cable
2. Allow all drivers to be installed
3. The necessary read-out software was sent to you by email or can be downloaded here (use the
password provided to you by greenTEG). Follow the instructions to install the software onto your
computer. You need to have admin rights to follow all necessary steps (right click on option "Execute as
Administrator")
If you use a Mac please have a look on our FAQ
4. When you open the software the home screen will appear (see figure 2). Under “File” > “Language” you can
change the language settings from English to German or vice versa
5. Please verify that the sensor is displayed correctly by reviewing its graphs under ”Real-time
measurement“. Here you can also directly review the approximate heat flux (the heat flux will still fluctuate
but some early indications can be reviewed already)
6. Place the heat flux sensor onto the surface you would like to investigate. For detailed instructions on
mounting the gSKIN® Heat Flux Sensors, see the Manual for Heat Flux KIT in R&D applications and also the
application notes which can be found at www.shop.greenTEG.com

gSKIN®Heat Flux Kit: Instruction Manual
4 / 7
greenTEG AG
Hofwisenstr. 50A
8153 Rümlang, Switzerland
T: +41 44 515 09 15
greenTEG.com
7. On the home screen, push the ”Start logging“ button. And then do the following steps:
−Check the sensitivity1
−Select the frequency for data logging (under ”Sampling rate”, e.g. 10 min or 30 min)
−Select start time (under “Start mode“, e.g. “immediately“)
−Add a comment e.g. specifications about measurement location
After you push the “Start measurement“ button, your data logging process begins. In the lower part of your
screen, you will see the text switches from “save settings..“ to “Measurement running..“. While logging the
LED of the logger flashes in blue (while charging in yellow).
Figure 3: Measurement setup and information window
8. You can stop the measuring process by selecting the “Logger“ tab and there the “Stop measurement“
function. We recommend that you first review your current measurement process before you stop your
ongoing measurement
1Adapt the sensitivity of your sensor by selecting the “calibrate” function. Please make sure that the sensitivity shown
here matches the sensor’s sensitivity on your product sheet. Please change these settings only if you use another heat
flux sensor; the value stored here should match with the sensor`s sensitivity shipped to you.

gSKIN®Heat Flux Kit: Instruction Manual
5 / 7
greenTEG AG
Hofwisenstr. 50A
8153 Rümlang, Switzerland
T: +41 44 515 09 15
greenTEG.com
9. You are now ready to analyse your logged data. To do so, please select “Read Record“ (on home screen). In
the next window, you need to select the data set you want to have displayed and analysed (the latest data
set will be preselected, all data sets are ordered by the measurement start time)
10. By selecting the latest logging file, you can review the logged data set. In the newly opened window named
“Analyse record“, you will find the last measured data points (see figure 4).
Explanation of the sections:
−“Last measured values“, shows you the last heat flux and total time of data logging
−A graphical review is given for measured heat flux (blue lines)
−“Comments’’ section shows the comments made regarding your latest measurement activity
(see step 7), you can change the comment2
Figure 4: Analysis window showing heat flux output
11. To save the graph as a PDF or printing it directly, push the “Generate report” button (see figure 4). The
“Generate PDF” button generates a PDF file, “Print” leads you to your printing settings.
2In order to save this comment, you need to save the report as a pdf (see step 11), otherwise this comment will be overwritten by
your next comment. So, be aware that if you are reviewing an old data set, it does not show the original comments anymore. You
can correct this again by simply revising the text in the box after “comments”

gSKIN®Heat Flux Kit: Instruction Manual
6 / 7
greenTEG AG
Hofwisenstr. 50A
8153 Rümlang, Switzerland
T: +41 44 515 09 15
greenTEG.com
12. On the “Read Record” > “Analysis” window, you can select under the “File” menu to “Export data…” and
save the raw data as a CSV file to your laptop (Note: If you need further advise in exporting data have a
look at our FAQ)
Figure 5: Software screen for saving data as a PDF file
13. To review other data logger files stored on your laptop, you can select these files via your home screen by
using the “Analyse record“ button (see figure 2)
14. For erasing stored data on your data logger, you can ONLY erase/delete all data saved on the data logger
by selecting in the top menu “Logger” and “Delete all stored data!”. There is no option to retrieve deleted
data, unless you have stored it before as a CSV file on your desktop (see step 12).
15. To close the Heat Flux KIT software, you can select the “Exit“ button on your home screen or the tab “File”
and “Exit” function. In case you have already started a heat flux measuring process, this activity will not be
stopped. Only by selecting the “Logger“ function on your home screen and there selecting “Stop
measurement“ can one end a heat flux measuring process (see step 7

gSKIN®Heat Flux Kit: Instruction Manual
7 / 7
greenTEG AG
Hofwisenstr. 50A
8153 Rümlang, Switzerland
T: +41 44 515 09 15
greenTEG.com
Please note that we are currently still improving minor layout and functional aspects of this software. Let us know if you
have any suggestions for improvements. We will send you all software updates and a detailed installation guideline by
email and free of charge.
Disclaimer
The above restrictions, recommendations, materials, etc. do not cover all possible cases and items. This document is
not to be considered to be complete and it is subject to change without prior notice.
RevisionHistory
Date
Revision
Changes
1.0
Initial version
28. October 2015
17.October 2019 1.1New address, minor changes

Table of contents
Other greenTEG Measuring Instrument manuals