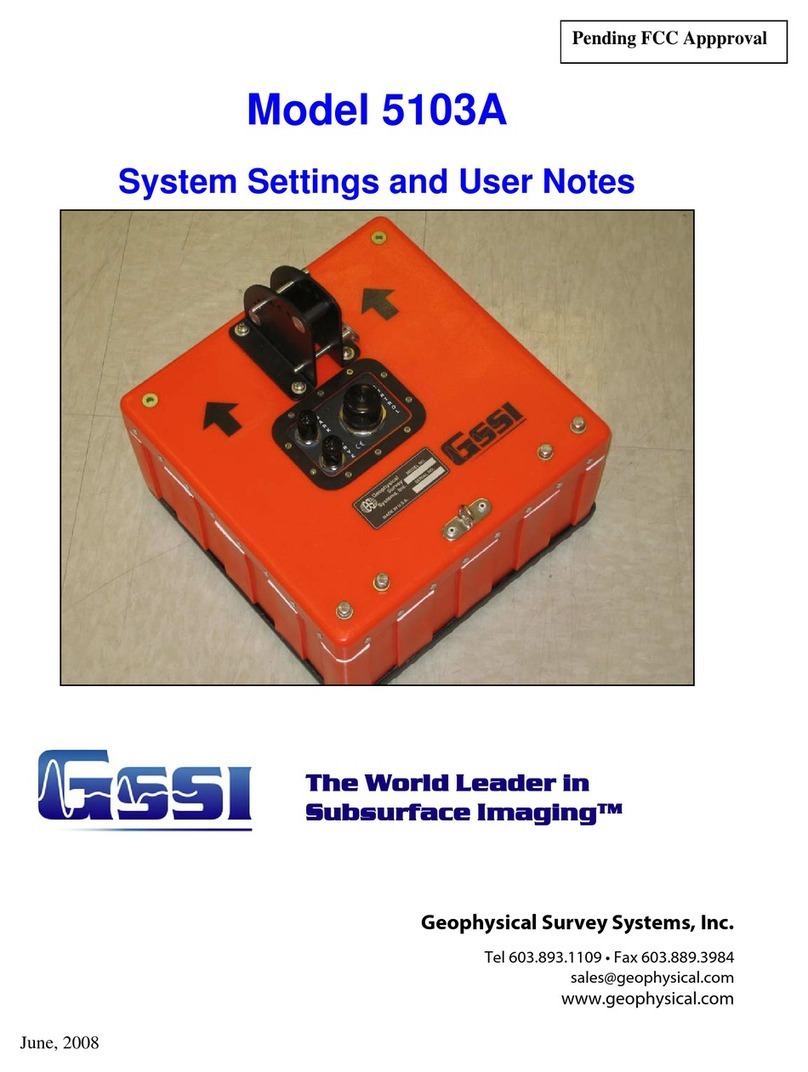
GSSI UtilityScan 50350HS User manual

MN27-151 Rev A
MN71-307 Rev B

Copyright © 2022 Geophysical Survey Systems, Inc.
All rights reserved
including the right of reproduction
in whole or in part in any form
Published by Geophysical Survey Systems, Inc.
40 Simon Street
Nashua, New Hampshire 03060-3075 USA
Printed in the United States
SIR, RADAN, UtilityScan, HyperStacking, LineTrac and PaveScan RDM are registered trademarks
of Geophysical Survey Systems, Inc.

Geophysical Survey Systems, Inc. UtilityScan with GS Software
Manual
Limited Warranty, Limitations of Liability and
Restrictions
Geophysical Survey Systems, Inc. hereinafter referred to as GSSI, warrants that for a period of
24 months from the delivery date to the original purchaser this product will be free from defects in
materials and workmanship. EXCEPT FOR THE FOREGOING LIMITED WARRANTY, GSSI
DISCLAIMS ALL WARRANTIES, EXPRESS OR IMPLIED, INCLUDING ANY WARRANTY OF
MERCHANTABILITY OR FITNESS FOR A PARTICULAR PURPOSE. GSSI's obligation is limited to
repairing or replacing parts or equipment which are returned to GSSI, transportation and insurance pre-
paid, without alteration or further damage, and which in GSSI's judgment, were defective or became
defective during normal use.
GSSI ASSUMES NO LIABILITY FOR ANY DIRECT, INDIRECT, SPECIAL, INCIDENTAL OR
CONSEQUENTIAL DAMAGES OR INJURIES CAUSED BY PROPER OR IMPROPER OPERATION
OF ITS EQUIPMENT, WHETHER OR NOT DEFECTIVE.
Before returning any equipment to GSSI, a Return Material Authorization (RMA) number must be
obtained. Please call the GSSI Customer Service Manager who will assign an RMA number. Be sure to
have the serial number of the unit available
Regulatory Information
The use of GSSI antennas is governed by different regulatory agencies around the world. Specific antenna
models must be certified for legal operation in your country. Please read and understand the following
regulatory passages that pertain to your antenna. A listing of certified antennas by region can be found
www.geophysical.com/regulatoryinformation.htm.
Notice
Operation is subject to the following two conditions: (1) this device may not cause interference, and (2)
this device must accept any interference, including interference that may cause undesired operation of the
device.
Survey Wheels
All of GSSI’s antennas are designed to operate with survey wheels. Some antennas have built-in survey
wheels, including the 62000 Palm Antenna and the Mini-SIR. The series of concrete antennas, including
the 5100, 5101 and 52600, have survey wheels built in to their special carts, the 614 and 615. The larger
antennas, including the 3101D, 5103, 50400 and 5104 are used in the larger carts, the 623 and 643, which
have survey wheels built into them. Various sizes of survey wheels can also be attached directly to these
antennas. This includes the 611, 620 and 622. For highway surveys we use the 630 Distance measuring
Instrument (DMI).

Geophysical Survey Systems, Inc. UtilityScan with GS Software
Manual

Geophysical Survey Systems, Inc. UtilityScan with GS Software
Manual
Table of Contents
Introduction.....................................................................................................................................1
What Comes in the Box.............................................................................................. 1
A Note about HyperStacking®Technology........................................................ 1
About this Manual........................................................................................................ 1
Setting Up Your System for the First Time.......................................................................3
Playback/Collect & Navigating the Menu Interface......................................... 3
Configuring One-Time and Global Settings ....................................................... 4
Connecting to the Antenna....................................................................................... 7
Setting Up for Data Collection ...............................................................................................9
Control Bar ....................................................................................................................12
Status Bar.......................................................................................................................16
Collecting Data............................................................................................................................ 17
Playing Back Data ...................................................................................................................... 18
File Maintenance and Data Transfer................................................................................. 19
Overview of Menu Items and their Functions..............................................................21
The Global/Project Menu Stack.............................................................................21
The File Parameters Menu Stack...........................................................................24
Appendix A: GPS......................................................................................................................... 30
Appendix B: Pre-Loading Maps to Use in Map Mode............................................31
Appendix C: File Formats........................................................................................................ 32
Appendix D: Loading the App on a Windows Tablet PC........................................33
Appendix E: System Specifications.................................................................................... 34
Appendix F: Dielectric Constant.......................................................................................... 35
Appendix G: Updating Software Version and System Firmware ........................37
Appendix H: Export to KMZ Function ..............................................................................38

Geophysical Survey Systems, Inc. UtilityScan with GS Software
Manual

Geophysical Survey Systems, Inc. UtilityScan with GS Software
Manual
MN71-307 Rev B 1
Introduction
Thank you for purchasing the GSSI UtilityScan®(Panasonic G2 Tablet). GSSI is re-imagining the
standard in underground utility locating by pairing cutting-edge sensors with a powerful Windows-based
user interface to create a high-performance product at an affordable cost. The UtilityScan is designed with
today’s busy subsurface professional in mind. It’s a tool that packs a ton of simple-to-learn functionality
into a ruggedly reliable package.
What Comes in the Box
•UtilityScan system, pre-assembled
•Panasonic G2 control tablet
•Two (2) rechargeable lithium ion UtilityScan batteries with charger
•Ethernet cable (2 meters long)
•AC power adaptor and set of international plugs for the tablet
•AC power supply for charging the tablet
•USB drive for data transfer
•Mount for the Tablet
•Sunshade
•UtilityScan Panasonic G2 Quick Start Guide
A Note about HyperStacking®Technology
The GPR data displayed on your UtilityScan starts as received pulses of electromagnetic energy that have
reflected off objects or interfaces in the ground. The reflected signals generate electrical charges in the
receive antenna element that are digitized by the antenna’s onboard sampler. They are then converted into
digital values and displayed as a colorized linescan profile or an oscilloscope trace. Traditional GPR
systems send out one pulse at a time and record one small piece of reflected information (a sample) from
that one pulse. It takes many samples to make a single scan and many scans to make a reflection profile.
HyperStacking (HS for short) technology represents a generational leap in GPR. HS antennas record
many samples from a single pulse. This allows an HS antenna to record data at speeds up to an order of
magnitude faster than conventional systems. In practice, the HS antennas use that extra data to average, or
stack, individual samples. This helps to reduce the random noise present in the signal and results in
cleaner and deeper data.
An added benefit is that we randomize the timing of the transmit pulse. This is called “dithering” and
means that we automatically average out manmade noise from nearby radio transmitters. This patented
technique enables you to work more confidently in high-noise environments like urban areas or airports.
About this Manual
This document provides important information for operating the UtilityScan (Panasonic G2) and
collecting, reviewing, and transferring GPR data to a PC. It is available for free download at
www.geophysical.com. This manual is not necessarily a substitute for a full training class. Purchase of a
UtilityScan system includes complimentary access to GSSI’s regularly scheduled curriculum of
professionally led training classes. We encourage you to take advantage of the opportunities for
instruction and networking with other professionals. Please visit www.geophysical.com or contact
training@geophysical.com for more details.

Geophysical Survey Systems, Inc. UtilityScan with GS Software
Manual
MN71-307 Rev B 2

Geophysical Survey Systems, Inc. UtilityScan with GS Software
Manual
MN71-307 Rev B 3
Setting Up Your System for the First Time
This section describes how to configure basic settings such as language and units of measurement,
connect to the antenna via Wi-Fi or ethernet, and navigate the control software. For this section we are
assuming the use of a Panasonic G2 tablet computer.
1Place a battery inside the UtilityScan antenna battery bay, press the power button,
and wait for a flashing blue light before proceeding.
2Turn on the Panasonic G2 tablet and double tap the GS Software shortcut from
the Windows desktop. You will briefly see the application loading image before
landing on the Playback/Collect screen.
•The right side of the window will show a list of detected antennas which are transmitting a
Wi-Fi signal. Note that you are not yet connected to your antenna, the system is just
displaying available connections.
•The left side of the window will show project folders.
•If this is the first time you are using the system, the only folder shown will be the factory
default, COMMON.
Playback/Collect & Navigating the Menu Interface
There are three control menu groupings that you will interact with: the Global Stack in the upper left, the
File Stack in the upper right, and the Control Bar at the bottom.
•In order to maximize the visible data image, these menus can be collapsed into the sides of the
screen and opened when needed.
•The Global Stack and the File Stack can be accessed by tapping the collapsed menu icon in the top
left and top right corners respectively.
•Once in Playback or Collect mode, the Control Bar is always present. Control Bar functions will
vary depending on which mode you are in. See the Control Bar section of this manual for an
explanation of each function.

Geophysical Survey Systems, Inc. UtilityScan with GS Software
Manual
MN71-307 Rev B 4
Interface with all menus open
Configuring One-Time and Global Settings
It is important to configure one-time settings such as language and units of measurement, as well as
global settings like designating the correct project folder to save individual profiles to, prior to connecting
to your antenna.
If you have already clicked through to Collect or Playback, tap the Back arrow ( ) in the lower left
corner to return to the Playback/Collect screen.
1Tap the Global/Project stack button in the top left corner. This will expand the portion
of the menu pertaining to global settings, which do not vary from file to file in a single
project.
2Scroll to the Project section of the stack.
3Tap the current Project folder name (this will be called “COMMON” if using the system for the
first time) next to Project to select or create a new project folder. This will designate the folder
in which your data files will be saved.
•You can create a new folder by tapping the New Project Name field and typing the desired
name of your new folder. Press the Enter key ( ) on the keyboard to save the new
folder. Each data file you collect while in that project will take the new project name as its
root name.
•When playing back data remember that you are only viewing files stored in the currently
selected project folder.
•To select an existing project, simply tap it from the list of saved folders. You many need to
swipe left/right if you have more project folders than can be displayed on the screen at once.

Geophysical Survey Systems, Inc. UtilityScan with GS Software
Manual
MN71-307 Rev B 5
Add a new project
4Navigate to the GPS option in the Project menu. To change your GPS setting click None then
scroll and select the name of the GPS you would like to use.
a) If you do not plan to use GPS, leave this set to None.
b) If you plan to use the Panasonic G2 internal GPS, select G2-GPS.
c) For an external GPS connection, follow the GPS connection instructions in Appendix A, then
reopen the GS Software application to have your GPS appear as an option on the list.

Geophysical Survey Systems, Inc. UtilityScan with GS Software
Manual
MN71-307 Rev B 6
5Next, navigate to the GPS Offset option. This is the distance that your GPS is offset from the
threading on the top portion of the antenna near the handle attachments.
a) If yours GPS is mounted on a pole using the threading on the antenna, your GPS Offset value
will be zero.
b) If your GPS centered closer to the front of the antenna, your offset (cm/in) will be positive. If
your GPS is centered closer toward the handles of the antenna, your offset (cm/in) will be
negative.
c) If you are using the Panasonic G2 internal GPS, measure the horizontal distance from the
threads on the antenna to the center of the tablet.
d) If you are not using GPS, this value can be zero.
6If you plan to collect data with GPS and would like a KMZ file to be exported, toggle the Export to
KMZ option on. For more information on exporting KMZ files see Appendix H.
7Navigate to the System menu to Units and Language options.
8Tap the selected parameter to change. For example, if you wish to change the Units from
Imperial to Metric, tap the word Imperial. These settings will remain from session to session
unless changed.
Zero Offset

Geophysical Survey Systems, Inc. UtilityScan with GS Software
Manual
MN71-307 Rev B 7
Connecting to the Antenna
Connecting to the antenna via Wi-Fi:The Panasonic G2 tablet communicates with the antenna via a
Wi-Fi network. To ensure a successful connection, turn on the antenna and wait for a flashing blue light
before proceeding with the pairing process. Turn on the tablet and confirm that Wi-Fi is turned on and
that the tablet is not in Airplane mode.
1Tap on the icon of the antenna that you want to connect with. An antenna
broadcasting animation will be shown while the antenna is attempting to connect.
A successful connection will bring you to the Playback/Collect screen.
1If your tablet network settings have changed and you are having connection issues, you can restore
them to connect to your UtilityScan. To do so, close the GS Software application and tap the
Windows icon ( ) in the bottom left of the Windows control bar. Select the application icon ( ) and
navigate to the GSSI folder. Click on the folder to expand and select GS Network Defaults. Your
network settings are now configured to be compatible with connecting to the UtilityScan antenna and
you can connect normally.
Connecting to the antenna via ethernet:
1Make sure the UtilityScan antenna is powered off and that the GS Software app is not launched on the
tablet.
2Unscrew the protective cap covering the antenna Ethernet connector and connect the Ethernet cable
to the antenna. Connect the other end of the Ethernet cable to the tablet.
3Power on the antenna and wait for the blue light around the antenna power button to flash.
4Verify the ethernet connection by pressing the network icon on the Windows taskbar. The network
should show an Ethernet icon with “No Internet” listed under the network name.
5Launch the GS Software application.

Geophysical Survey Systems, Inc. UtilityScan with GS Software
Manual
MN71-307 Rev B 8

Geophysical Survey Systems, Inc. UtilityScan with GS Software
Manual
MN71-307 Rev B 9
Setting Up for Data Collection
This section will get you set up to collect data with your UtilityScan system in distance, time, or point-
based mode.
For more thorough information about individual menu items and settings, see the “Overview of Menu
Items and their Functions” below.
To begin, you will need to insert a battery into the antenna’s battery port and press the power button on
the antenna. Wait for the power light to flash before starting the GS Software.
1Once in the GS Software, connect to your antenna using the instructions provided in the
“Connecting to the Antenna” section above.
2After connecting to your antenna, the setup/preview screen will load. Data will scroll continuously
as you make adjustments, but the system will not begin collecting a data file until you press the
Record icon ( ). After two minutes the data on the preview screen will stop scrolling to save
tablet battery. It is important to spend some time making adjustments in the setup screen to reach
your desired collection parameters prior to collecting a data file.
3Tap on the Global/Project Menu Stack to check your Project parameters.
•Check the Project Folder and adjust the title if needed.
•Check the Save Prompt and adjust if needed.
4Next, tap on the File Parameters Menu Stack. In the Scan area, we are most concerned with:
•Collect Mode
•Time: No survey wheel, emitting scans/second continuously
•Distance: Using a survey wheel, transmitter triggered by wheel movement
•Point: Collecting one scan at a time when prompted, able to stack many scans together
to reduce noise.
•Vertical Scale:Depth or Time
•When the vertical scale is displayed as depth, you will set the depth of signal
penetration. Note that the depth displayed is calculated by converting time (in
nanoseconds) to depth using the dielectric value you have set. The accuracy of your
depth scale is dependent on how accurate your dielectric value is. For more information
on dielectric, see Appendix F.
•When the vertical scale is displayed as time, you will set the time range (in
nanoseconds) for which the system will “listen” for returns. The time value input will
impact the depth of penetration as the subsurface material will depend how quickly or
how slowly the radar energy can travel through it. If the energy travels slowly, the depth
of penetration will be shallower as the system will only record returns within the
specified time range. Conversely, if the radar energy travels quickly through the
subsurface material, the depth of penetration will be greater.
Regardless of the method you use to set penetration depth, you’ll want to look at the scan to set it
properly. Observe the scan trace displayed in the O-Scope window (O-Scope can be toggled on and off by
pressing the icon in the control bar). When the scan trace gets to a depth/time where there is more
noise/interference than signal strength, you’ll see the scan trace jump from negative to positive and appear

Geophysical Survey Systems, Inc. UtilityScan with GS Software
Manual
MN71-307 Rev B 10
craggy. To setup the system so that you’re collecting the maximum range of data possible you’ll want to
see some of that noise in the scan trace. If no noise is apparent, then you should increase your depth or
time range until about 25% of the scan trace consists of noise. The noise to signal ratio will change as you
move across your survey area. Keeping some noise on the screen will help ensure that you always collect
the full range of quality signal.
Dielectric:this value is used to convert the RADAR two-way-travel-time into a depth on the screen. It is
crucial to set this accurately to obtain accurate depths to features. If your vertical scale is set to Depth,
you can use the preset Soil Types to help get you within range of an appropriate dielectric for your
subsurface conditions. There are ways to calibrate it further in the field with focus and ground truth.
•Depth/Time Range: See Vertical Scale above for details.
•Samples/Scan: Multiply your Time Range by 10 and divide by 2.5. Use a Samples/Scan set higher
than this value. If your Vertical Scale is set to Depth, toggle it to Time to see this value. Feel free to
switch it back after. GSSI recommends sampling at 512 or 1024 samples/scan for most applications.
•Scans/Second
•For Collect Mode: Time, this is your data collection speed. Calculate this value by
considering how many scans/ft or scans/m traveled are required to resolve your targets, as
well as your movement speed. A good default is 50 scans/second.
•For Collect Mode: Distance and Point, this number represents the maximum possible collect
rate. If you exceed this maximum rate the overspeed beeps will sound. It is recommended
that the scans/second be set lower as lower scan rates will auto stack and improve the signal
to noise ratio. The ideal value for a 350HS antenna is 100 scans/second.
•Scan Density
•For Collect Mode: Distance, this is your horizontal data density. A good starting value is 12
scans/ft or 50 scans/m. A lower scan density will result in your data looking more
horizontally condensed, while a higher scan density will result in your data taking up more
horizontal space as more scans are being collected and stacked next to each other per unit of
distance travelled.
•For Collect Mode: Point, this will control your horizontal scale display. It is not required to
change this value, but if you are aware of how far you will move the antenna during each file
collection you can set this to display the horizontal scale accurately.
•Scans/Point
•For Collect Mode: Point only. The higher this value is, the cleaner your data will be.
However, note that higher values will slow down your data collection speed. A good starting
point is 512 samples/point.

Geophysical Survey Systems, Inc. UtilityScan with GS Software
Manual
MN71-307 Rev B 11
In the Filters Area
Low Pass/High Pass Filters: These filters are crucial to
reducing external signal interference in the field. Without
any filtering, the antenna’s receiver will record anything in
the frequency range of radiation that it encounters. By
applying an IIR frequency filter, you can filter out any
frequencies outside the range specified. For the 350MHz
antenna, the frequency range of interest is around 100 –
1000MHz. The High Pass allows anything higher than the
entered frequency to stay in the data, and the Low Pass
allows anything lower than the entered frequency to remain
in the data.
Stacking (Scans): This is optional. It can help reduce the
amount of noise visible in data. If you decide to use it,
smaller values are crucial. Large stacking values will cause
scans to average to the point of erasing targets of interest.
GSSI recommends a stacking value between 3-11 if you
choose to use the stacking function.
Background Removal: This is an optional filter that can
help to remove external low-frequency noise and may improve target visibility in high dielectric, wet,
and/or conductive materials. The background removal filter removes any reflector that appears for more
than the input scan value at the same time, depth, and amplitude across scans. External low-frequency
noise often manifests as horizontal banding, and conductive materials can produce a fair amount of
ringing or horizontal banding. This filter removes horizontal banding that may be overprinting features of
interest. GSSI recommends a scan value of at least 100-200 scans to prevent erasing features of interest.
A good rule of thumb is to set this filter to a value greater than your target length times your scans/ft or
meter. Using very large values may cause a lag in data population on the screen, as the system must
record the number of scans input before displaying the filtered data.
Noise Band Removal:This is also an optional filter. Enabling Noise Band Removal applies a smart
background removal that is weighted to remove horizontal banding while minimally impacting hyperbolic
features.
Signal Floor: This is also an optional setting. When Signal Floor is turned on a green field is overlaid on
the Linescan display. This green field is an estimate of the effective depth of each scan based on an
analysis of the noise to signal loss (attenuation).

Geophysical Survey Systems, Inc. UtilityScan with GS Software
Manual
MN71-307 Rev B 12
In the Gain Area
Auto Gain:Auto Gain causes the system to re-
initialize and adjust the time-variable gain curve
based on the current scan and the selected
number of gain points. This is useful if you find
that your data is clipped (over-gained) or too
weak to see (under-gained) over a particular
section of your survey area. Just place the
antenna on the area where the data is clipped or
weak and turn Auto Gain off and then back on
again. This will cause the system to reset the
gains to a lower level to prevent clipping or a
higher level to strengthen weak reflections. If
Adaptive Gain is off and then you turn Auto
Gain off, you can manually adjust the gain
curve. Use the # of Points setting to add or
delete points along the gain curve. Modify the
Gain Value (in dB) applied to each point by
increasing or decreasing the value. Toggle
between points to adjust by using the Current
Point # setting. Point 1 will be at the top of the
scan, and points will be counted consecutively
down the scan. It is recommended to have your
O-Scope view open while adjusting gains so
you can see how the waveform is impacted by
increasing or decreasing gain values.
Adaptive Gain:If adaptive gain is toggled on,
a gain compensation algorithm designed to counteract attenuation will be applied. The algorithm factors
in ground conductivity and the dielectric constant to edit the gain curve and accentuate targets. No
adjustments can be made to adaptive gain.
Control Bar
Once you enter Collect mode or open a previously recorded file in Playback mode, the control bar will
appear along the bottom of the screen. It contains functions that you will access while collecting or
reviewing data.
The Back Arrow ( ): Tapping this will return you to the Playback/Collect screen. This is not available
while you are actively collecting data.
Contrast ( ): Tapping this will show the display gain and color table controls. Shallow, level, and
deep will manipulate the display gain while color table, stretch, and slide adjust the distribution of colors
within a particular color table. You can hide this menu by tapping Contrast again while open.
•Level: This control will increase (brighten) or decrease (dim) the display gain in increments of 3 dB.
Changes here will apply to the entire vertical scale. Changes to the display gain level are not saved
with the DZX file and are for display purposes only.

Geophysical Survey Systems, Inc. UtilityScan with GS Software
Manual
MN71-307 Rev B 13
•Shallow/Deep: These control the display gain for the top or bottom 50% of the
time range only. They are useful if you want to brighten/dim only the top or
bottom half of your data.
•Color Table: Use the carousel wheel or +/- buttons to select from 31 different
color tables. The color distribution is shown in the color bar above the numerical
selector. Positive amplitudes will be assigned the color on the right, negative on
the left, and zero amplitude will be at the center.
•Stretch: This control allows you to use a single color palette to accentuate
different portions of the amplitude scale. Setting this to 1 will compress more
colors near to zero amplitude which will accentuate weaker reflections. A setting
of -1 will compress color values at the positive and negative extremes to
accentuate high amplitude reflections.
•Slide: Shifts the center of the color table associated with zero amplitude in
either the positive or negative direction. This can help to accentuate either the
positive or the negative amplitude values.
Calibrate SW( ): The calibrate survey wheel icon will only be visible when you
pause the data preview in collect mode or pause while actively collecting a data file.
Once selected you will have the option to use the factory default survey wheel value,
use the last calibration value, or recalibrate the survey wheel. To recalibrate the
survey wheel:
1Select Recalibrate SW.
2Set the desired calibration distance.
•For Imperial units the distance options are 5, 10, 15, 30, or 100 feet.
•For metric units they distance options are 1, 5, 10, 15, 20, or 30 meters.
3Press Start Calibration.
4Move the system the desired distance (it is helpful to mark out the distance on the ground, or to
walk alongside a measuring tape).
5Press Stop Calibration.
6Press Accept.
It is recommended that you recalibrate your survey wheel every time the antenna is switched to a different
cart, or if you are working on terrain that is drastically different from the last collection site’s terrain. You
can check the accuracy of your survey wheel calibration by collecting a data file and walking the length
of your calibration distance, then looking at the distance readout in the top right of the collection screen.
If the distance is the same as your calibration distance, you have successfully recalibrated. If the distance
is drastically different than your calibration distance, it is recommended that you recalibrate the survey
wheel again.

Geophysical Survey Systems, Inc. UtilityScan with GS Software
Manual
MN71-307 Rev B 14
1
2
3
4
Table of contents
Other GSSI Radar manuals
Popular Radar manuals by other brands

Axis
Axis D2210-VE Repainting instructions

Endress+Hauser
Endress+Hauser Micropilot FMR62B PROFINET with Ethernet-APL Brief operating instructions

Adaptive Micro Systems
Adaptive Micro Systems FAST 350 user manual

Simrad
Simrad R5000 installation manual

Raven
Raven SCS 700 PGM Series installation manual

Keysight
Keysight E8718A user guide

Raymarine
Raymarine Quantum 2 installation instructions

Analog Devices
Analog Devices ADAR1000-EVALZ user guide

Guideline Geo
Guideline Geo MALA MIRA HDR user guide

Decatur Electronics
Decatur Electronics RAILMASTER-VP user manual

Nova Electronics
Nova Electronics NOVA77GB-C Pro user manual

nanoradar
nanoradar CAR28T user manual