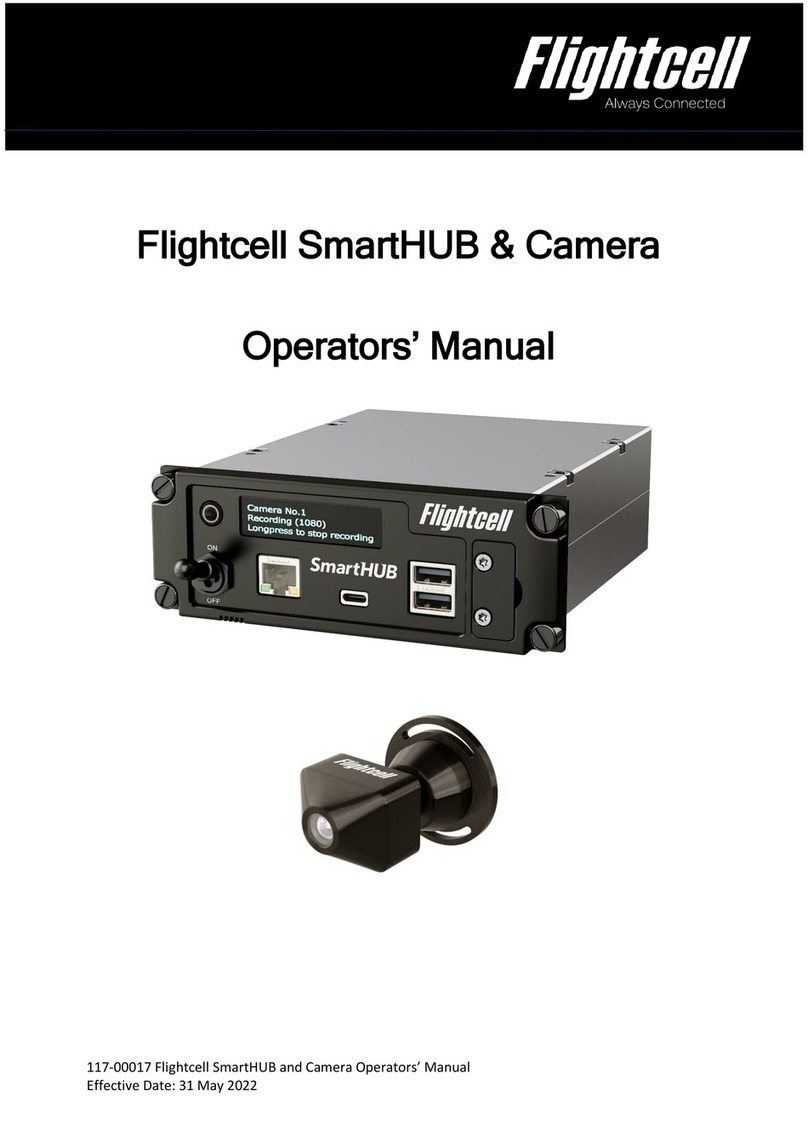
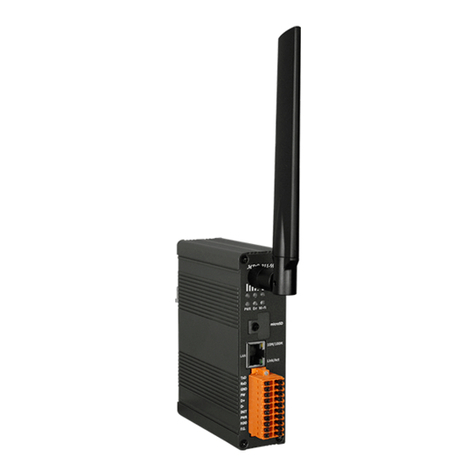
infoAgro THI User manual

Operating Instructions
THI · THIP · TCO LAN data loggers
BA-THI-THIP-TCO-01-EN

Operating Instructions data logger 2
EN
This publication replaces all previous publications. o part of this publication may be reproduced, processed using
electronic systems, replicated or distributed in any way without prior written authorisation by us. Subject to technical
modifications. All rights reserved. ames of goods are used without guarantee of free usage and used for the most part
according to the manufacturers‘ syntax. The names of goods used are registered and should be considered as such.
We reserve the right to modify the design in the interest of ongoing product improvement, such as shape and colour
modifications. The scope of delivery may vary from that in the product description. All due care has been taken
in compiling this document. We accept no liability for any errors or omissions.
Please read this manual carefully. These instructions are designed to ensure
that your data logger is used for the purpose for which it was intended and to
guarantee that you get the maximum benefit from your product.
These operat ng nstruct ons describe the functions of the hardware.
There is also a separate software manual available. This manual shows you
how to configure your data logger and how to use the software. The manual
can be accessed using the Help function as soon as it has been installed.
Your new data logger was designed and manufactured in line with the latest
technological advancements and complies with the requirements as laid down
in existing European and national guidelines. Conformity has been certified. The
relevant declarations and documents are in the possession of the manufacturer.
As the user you must read and adhere to the following safety instructions in
order to ensure that this condition is maintained and that no danger results
from the use of this device:
1. Safety Instructions
We do not accept any liability for any damages which might occur as a result of
improper use or the non-observance of these instructions. The guarantee expires
with immediate effect in any such case!
These instructions must be read in full before this measuring
device is put into operation for the first time !
For reasons of safety and CE compliance you may on no account carry out any
changes or modifications on either the device itself or any other components
which may be used in connection with this measuring device!
The following instructions must be adhered to before
the device is ta en into use :
• Do NOT carry out measurements on live components.
• Please o serve the sensor measuring range.
• Please o serve the operating and storage conditions.
• The user is solely responsi le for determining whether he or she
considers the measuring results to e valid and for any conclusions that
are reached or any measures that are taken as a result thereof. We can
neither guarantee the validity of any measuring results nor can we accept
lia ility for any such results. We are on no account a le to accept lia ility
for any damage which may e caused as a consequence of the use
of these measuring results.
2. Intended Purpose and Use
The data logger is designed to determine and log a variety of different measuring
values which can be measured using the sensors as described in the technical
specifications. The measuring data can either be logged, called up or saved to
a connected PC in randomly selectable intervals.
This measuring device may only be used within the specified technical specifi-
cations for the purpose for which it was intended.
Any other use is considered to be improper and constitutes a violation of these
conditions.
This product should not be disposed of in your general waste. Please
ensure that it is disposed of in an orderly manner in accordance with
existing regulations.
Contents Page
1. Safety Instruct ons 2
2. Intended Purpose and Use 2
3. Features 3
4. Scope of Del very 3
5. Preparat ons Pr or to Use 4
5.1. Software . . . . . . . . . . . . . . . . . . . . . . . . . . . . . . . . . . . . . . . . . . . .4
5.1.1. Installation Requirements . . . . . . . . . . . . . . . . . . . . . . . . .4
5.1.2. Installing the SmartGraph Software . . . . . . . . . . . . . . . . .4
5.1.3. Preparing the Data Logger Configuration . . . . . . . . . . . . .4
6. Operat ng the Data Logger 4
6.1. Powering O /OFF . . . . . . . . . . . . . . . . . . . . . . . . . . . . . . . . . . . . .4
6.2. Basic Settings and Operating Modes . . . . . . . . . . . . . . . . . . . . . . .4
6.2.1. The Four Operating Modes . . . . . . . . . . . . . . . . . . . . . . . .4
6.2.2. Network Function (M51) . . . . . . . . . . . . . . . . . . . . . . . . . .5
6.2.3. Factory Settings (M52) . . . . . . . . . . . . . . . . . . . . . . . . . . .5
6.2.4. Acoustic Function (M53) . . . . . . . . . . . . . . . . . . . . . . . . . .5
7. Measur ng Value D splay and Data Logg ng 6
7.1. Sensors, Channel Groups and Measuring Channels . . . . . . . . . . . .6
7.2. Displaying Measuring Values . . . . . . . . . . . . . . . . . . . . . . . . . . . . .6
7.3. Data Logging . . . . . . . . . . . . . . . . . . . . . . . . . . . . . . . . . . . . . . . .6
8. Alarm Funct on 7
8.1. Alarm Configuration . . . . . . . . . . . . . . . . . . . . . . . . . . . . . . . . . . .7
8.2. Alarm Symbol on the Display . . . . . . . . . . . . . . . . . . . . . . . . . . . .7
8.3. Acoustic Alarm . . . . . . . . . . . . . . . . . . . . . . . . . . . . . . . . . . . . . . .7
8.4. Using the Alarm Hysteresis . . . . . . . . . . . . . . . . . . . . . . . . . . . . . .7
9. Clean ng and Ma ntenance Instruct ons 8
9.1. Replacing the Batteries . . . . . . . . . . . . . . . . . . . . . . . . . . . . . . . . .8
9.2. Installation During Mobile Operation . . . . . . . . . . . . . . . . . . . . . . .8
9.3. Mounting the Logger on a Wall . . . . . . . . . . . . . . . . . . . . . . . . . . .8
9.4. Changing Locations . . . . . . . . . . . . . . . . . . . . . . . . . . . . . . . . . . .8
10. Techn cal Data 9
able of Contents

Operating Instructions data logger 3
EN
Battery compartment
Battery compartment lid
USB micro B port
RJ45 network connection
Mounting rail
LCD display :
Measuring value line 1
Measuring value line 2
Measuring value line 3
Display sym ol acoustic signal active
Display sym ol network connection active
Display sym ol USB connection active
Display sym ol power supply via mains
Display sym ol power supply via USB
Display sym ol attery capacity
Display sym ol mode marker
Display sym ol logging active
Display sym ol logging inactive
Date display
Time display
Mode selection key
Data loggers with internal sensors (THI / THIP / TCO)
4. Scope of Delivery
The following components are contained in the standard scope of delivery:
• Data logger
• USB cable
• CD-ROM with operating instructions, SmartGraph software
and software manual
• 4 x AA batteries
• Factory certificate
3. Features

Operating Instructions data logger 4
EN
6. Operating the Data Logger
The SmartGraph PC software forms the central configuration interface for your
data logger. All further changes to the configuration or display can only be
carried out using the software.
You can use the mode selection eys on your data logger
to carry out basic settings directly.
You can also use the software to lock the mode selection keys. In such a case
the data logger cannot be configured via the mode selection keys.
6.1. Powering ON / OFF
The data logger cannot be switched off completely when connected to a func-
tioning power supply. It can, however, be switched to a low-energy power mode
(M1) which allows it to consume as little power as possible. The data logger is
inactive in this mode and therefore unable to carry out measuring or logging or
display any values. You will find an overview of the four different modes in the
following chapter.
6.2. Basic Settings and Operating Modes
You can use the mode selection key of your data logger to
configure seven basic settings. These settings include the
four operating modes, the network function, a global setting
reset and the acoustic function.
Press the mode selection key briefly to access the settings
level which you have currently selected.
Press the mode selection key again to navigate from on setting
mode to another.
The selected mode will appear on the display for four a maxi-
mum of four seconds. During this time the mode can be se-
lected.
The mode marker (M1, M2, M3, M4, M51, M52, M53) blinks
in the bottom left-hand corner of the display for the duration
of this period.
Press the mode selection key longer (approx.1 second) to
confirm your selection.
The data logger will then change into the selected mode.
If you do not confirm your selection within this four-second period, then the
device will leave the settings level and return to the mode that had previously
been selected.
6.2.1. he Four Operating Modes
Operating mode M1
The logging function is inactive. The word “OFF” appears in measuring value
line 1. The “STOP” symbol is active.
In this mode (data logger factory setting), the energy consumption is low, because
there are not yet any measuring values which could be called up or displayed.
M53
M52
M51
M4
M3
M2
M1
Select operating mode M1 Display operating mode M1
5. Preparations Prior to Use
5.1. Software
5.1.1. Installation Requirements
Your SmartGraph software has to be installed on to a PC that fulfils the following
requirements in order for you to be able to configure your data logger and read
out the measuring results that have been recorded.
Supported operating systems:
• Windows XP from Service Pack 3 (32 bit or 64 bit version)
• Windows Vista (32 bit or 64 bit version)
• Windows 7 (32 bit or 64 bit version)
Hardware requirements:
•Processor speed: at least 1.0 GHz
• CD ROM drive
• USB or RJ45 network connection
• at least 512 MB main storage
• at least 4 GB free hard disk storage
• Adobe Acrobat Reader software
5.1.2. Installing the SmartGraph-Software
Place the CD ROM in the drive of your PC and follow the instructions of the
installation assistant to install the software.
5.1.3 Preparing the Data Logger Configuration
Connect your data logger to your PC with the USB cable included in the scope
of delivery. The operating system recognises the data logger automatically.
Alternatively, you may wish to connect your data logger via LAN via your local
network. Please make sure that the network function is activated. You will find
more information on the network function in chapter 6.2.2.
Start the SmartGraph software. The program recognises the connected data log-
ger automatically and adds the data logger to the existing data logger list. The
data logger can now be configured using the software.
You will find more detailed information on the software in the software
manual which you can call up using the Help function of your
SmartGraph software.
Functions of the professional version
You will find information on the possibility of upgrading your SmartGraph software
to the professional version (Device Licence Upgrade) in the software manual.

Operating Instructions data logger 5
EN
A signal transmitted by the data logger via UDP enables the SmartGraph soft-
ware to find the data logger in the local network automatically.
When the data logger is connected to the network for the first time (add network
device), you may have to use the SmartGraph software to adapt the data logger
network settings to conform with the existing network configuration. The factory
setting is DHCP.
You will find more detailed information on the software in the software
manual which you can call up using the Help function of your SmartGraph
software.
The professional version of the SmartGraph software also allows you to call up
and log current measurements and measuring values that have been saved in
the data logger at random intervals via the network.
Use in Networ Mode
If you intend to use the network card over a longer period, the data logger
must be mounted on a wall. It must be ensured that the air can circulate freely
within a minimum distance zone of 50cm around the data logger. This mini-
mum distance zone should also be kept free of external convection sources
(fans, lamps etc.).
Power Supply in Networ Operation
The data logger consumes more power when the integrated
network card is used.
When the network function has been activated, the data logger checks the
network status automatically in regular intervals. If an active local network
cannot be identified, the data logger deactivates the network function independ-
ently after 12 minutes.
The is also an optionally available PoE model. This model can be powered
directly from the mains.
6.2.3. Factory Setting (M52)
6.2.4. Acoustic Function (M53)
The data logger has an acoustic signal which can be turned on or off by
activating or deactivating the acoustic function. A symbol appears on the display
when the acoustic function is activated.
When the acoustic function is activated, an alarm signal alerts the user when
an alarm incident occurs. The alarm for one or more than one measurement
must have been previously set using the SmartGraph software.
When the acoustic function is activated, the data logger also emits a tone each
time the mode selection key is pressed while navigating through the individual
levels or when a specific mode is selected. The data logger also emits a tone
when you leave the settings level without a previous selection having been made.
This function allows you to reset all
the settings of your device to the fac-
tory settings.
Select reset function M52
Select acoustic function M53 Display example of the acoustic function M53
Operating Mode M2
The measuring function is active. The measuring values that were configured
using the SmartGraph software are displayed in all three measuring value lines
together with the previously selected sampling rate. The logging function is not
active in this operating mode. The displayed values are not saved into the mem-
ory. The word “STOP” (data logging inactive) appears where the saved measuring
values are normally displayed.
Opearting Mode M3
The measuring and logging functions are active. The measuring values that
were configured using the SmartGraph software are displayed in all three meas-
uring value lines together with the previously selected sampling rate.
In addition a total of 20 measuring channels that have all been previously
selected using the SmartGraph software can be saved into the measurement
memory. The message “REC” (data logging active) appears where the saved
measuring values are normally displayed.
Operating Mode M4
The measuring and logging functions are active. The display is deactivated.
o values are displayed in either of the three lines that normally display meas-
urements. Up to a total of 20 measuring channels, which have all been previously
selected using the SmartGraph software, can be saved into the measurement
memory. The message “REC” (data logging active) appears where the saved
measuring values are normally displayed.
6.2.2. Network Function (M51)
If the data logger is connected to a local network and the network function is ac-
tive, then the software can be configured and the data can be read out from the
data logger via this network.
Select operating mode M2 Display example for operating mode M2
Select operating mode M3 Display example for operating mode M3
Select operating mode M4 Display operating mode M4
Select network function M51 Display example of the network function M51

Operating Instructions data logger 6
EN
7. Measuring Value Display and Data Logging
7.1. Sensors, Channel Groups and
Measuring Channels
THI data logger
The THI data logger has two internal sensors with which it can measure values
from a total of six channel groups. The channel groups (measured variables)
are as follows: air temperature in °C, air temperature in °F, dew point in °C,
dew point in °F, relative humidity in % and absolute humidity in g/m³.
Each channel group has four measuring channels with which logging can be
performed: current measuring value (act), minimum measuring value (min),
maximum measuring value (max) and the average value (avg). This means that
your THI data logger has a total of 24 measuring channels, as shown in table 1.
THIP data logger
The THIP data logger has three internal sensors with which it can measure values
from a total of eight channel groups. The channel groups (measured variables)
are as follows: air temperature in °C, air temperature in °F, dew point in °C, dew
point in °F, relative humidity in % and absolute humidity in g/m³, relative air
pressure in hPa and absolute air pressure in hPa.
Each channel group has four measuring channels with which logging can be
performed: current measuring value (act), minimum measuring value (min),
maximum measuring value (max) and the average value (avg). This means that
your THIP data logger has a total of 32 measuring channels, as shown in table 1.
TCO data logger
The TCO data logger has three internal sensors with which it can measure values
from a total of seven channel groups. The channel groups (measuring variables)
are as follows: air temperature in °C, air temperature in °F, dew point in °C, dew
point in °F, relative humidity in % and absolute humidity in g/m³ and CO2
concentration in ppm.
Each channel group has four measuring channels with which logging can be
performed: current measuring value (act), minimum measuring value (min), maxi-
mum measuring value (max) and the avearge value (avg). This means that your
TCO data logger has a total of 28 measuring channels, as shown in table 1.
7.2. Displaying Measuring Values
Each one of the channel groups as specified in Table 1 can be configured to dis-
play measurements in each of the three measuring value lines on the display.
The display always shows the current measurement.
7.3. Data Logging
The data logger is in logging mode (REC) when the operating modes M3 or M4
have been selected. The measuring values of the previously selected measuring
channels are saved into the logger.
Up to a total of 20 of the measuring channels as specified in Table 1 can be
logged into the data memory at the same time.
Logging begins as soon as one of the logging modes M3 or M4 has been
selected and continues in ring mode. This means that logging is neither inter-
rupted nor discontinued, because there is no memory limit. The data logger
simply writes the latest measurements over the oldest values.
R Tip: The current, minimum, maximum and average measuring values
of a channel group represent one individual channel. If these values
are to be made available for later assessment and documentation, then each
of these measuring channels must be selected for logging while you are
determining where you would li e your data to be saved, as these values
cannot be calculated by the software at a later point in time.
The specifictions for the type, duration and scope of data logging in logging
mode can be selected individually via the software. You will find more detailed
information in the software manual.
Ta le 1 : Overview of sensors, channel groups (measuring varia les) and data logger measuring channels
Sens r /
Measuring element
Channel gr up
(measuring
variable)
Unit
Measuring channels available f r data l gging
(max. 20 channels can be saved)
and f r display* (max. 3 channels can be displayed)
Can be dis-
played in meas-
uring value line
all
m dels
internal
temperature sensor
temperature [°C] act min max avg 1, 2, 3
temperature [°F] act min max avg 1, 2, 3
dew point [°C] act min max avg 1, 2, 3
dew point [°F] act min max avg 1, 2, 3
internal
humidity sensor
rel. humidity [%] act min max avg 1, 2, 3
abs. humidity [g/m³] act min max avg 1, 2
nly
THIP
internal
air pressure sensor
rel. air pressure** [hPa] act min max mitt 1, 2, 3
abs. air pressure [hPa] act min max mitt 1, 2, 3
nly
TCO
internal
carbon dioxide sensor CO concentration** [ppm] act min max mitt 1, 2, 3
* When a channel is selected to e shown on the display, the current measuring value (act) is always displayed automatically.
** In order to e a le to determine the measuring value accurately, the height of the location must first e entered using the SmartGraph software.

Operating Instructions data logger 7
EN
8. Alarm Function
8.3. Acoustic Alarm
When an alarm is triggered when the acoustic function is active (see chapter
6.2.4. Acoustic Function), an alarm tone sounds in addition to the alarm symbol
on the display. The logger stops emitting the tone when the measured value is
within the corridor.
8.4. Using the Alarm Hysteresis
If you use the alarm function with an alarm hysteresis, the alarm will be trig-
gered and recorded every time the alarm thresholds are exceeded.
If the corridor between the selected alarm thresholds is very narrow, the alarm
will be triggered more often.
If, for example, you have selected 24 °C as your upper alarm threshold for the
room temperature and 10 °C for your lower alarm threshold and the room tem-
perature fluctuates between 23.5 and 25 °C during the entire measuring period,
then this would lead to the alarm being triggered and recorded much more often
than would perhaps otherwise be the case during a normal measuring period.
In order to prevent this from happening, you can set an alarm hysteresis. By
doing so you are defining a value which has to be reached in the selected value
corridor, the so-called “good sector” to switch off the alarm.
The alarm hysteresis is set to 1 °C in the previous example. This means that the
alarm will be triggered when the measured value has exceeded 24 °C and then
switched off again when it reaches 23 °C.
HYSTERESIS
Alarm display without hysteresis
Alarm display with hysteresis
Logging mode
Logging mode
Upper alarm
threshold value
Set value
corridor –
“Good sector”
Lower alarm
threshold
value
Blinking
Static
Upper alarm
threshold value
Set value
corridor –
“Good sector”
Lower alarm
threshold
value
Blinking
Static
8.1. Alarm Configuration
The data logger management can be used to configure an alarm for each indi-
vidual measuring channel which has been selected for display or logging.
First you must define both an upper and a lower alarm threshold so as to set a
corridor within which the values are deemed to be good. The data logger trig-
gers the alarm as soon as the measured value is outside this corridor, i.e. one
of the thresholds has been exceeded.
Please note: The alarm function will only be displayed for the channel groups
of the three measuring channels which have been previously selected to be
displayed and only in the operating modes M2 and M3 !
Alarm incidents of further selected measuring channels in logging mode are
saved regardless whether they have been selected to be displayed or not. This
means that alarm incidents of measuring channels that have not been selected
for display but which have been selected for logging will be saved.
All selected alarm incidents are also recorded when the display has been deac-
tivated in operating mode M4.
8.2. Alarm Symbol on the Display
The alarm will only appear on the dis-
play for measuring values which have
been selected to be displayed and
which have been configured with an ac-
tive alarm function. When an alarm has
been triggered on one of these measur-
ing channels, an alarm symbol appears
next to the measuring value for this spe-
cific hannel. The symbol continues to
blink until the measured value returns
to the preset corridor.
The alarm symbol stops blinking as soon as the measured value is within the se-
lected thresholds. The alarm symbol remains on the display.
This is to show the user that an alarm has been triggered and that an alarm in-
cident has occurred. If the threshold values are exceeded again, then the alarm
symbol starts to blink again.
The alarm symbol disappears when the memory is read out.
A hysteresis can also be set which switches off the alarm when the measured
value is once again within the corridor.
Display example for an alarm incident of
the measuring channel displayed in the
first measurement line.
Alarm display
Upper alarm
threshold value
Set value
corridor –
“Good sector”
Lower alarm
threshold
value
Blinking
Static
Logging mode
Reading out the value memory

Operating Instructions data logger 8
EN
9.1. Replacing the Batteries
When the message “LO bAtt” appears on the display,
the batteries have to be replaced.
The data logger cannot log data while the batteries are being
replaced. If you have to interrupt a logging process, please ensure
that the data logger is set to operating mode M1 or M2 before the
batteries are replaced.
Open the battery compartment and remove the used batteries. Place the new
batteries in the battery compartment. Make sure that the poles are properly
aligned.
The cloc continues to give the correct time for at least a minute while the
batteries are being replaced.
Only use batteries which are permissible according to the technical specifications.
Other battery types can cause faults. Do OT use rechargeable batteries !
Do OT dispose of used batteries in your household waste. Do OT throw into
an open fire or water. Please dispose of these batteries in a proper manner in
accordance with existing regulations.
9. Cleaning and Maintenance Instructions
9.2. Installation During Mobile Operation
The data logger can be placed at any random position during mobile operation.
Please make sure that the permissible environmental conditions are observed
(see Technical Data). Because of its compact size, the data logger can be easily
concealed during mobile operation.
9.3. Mounting the Logger on a Wall
If stationary logging is to be carried out, the data logger can be mounted
on wall or fixed to a mounting rail. There is a mounting rail included
in the scope of delivery.
The wall mount must be used if the logger is being used in
networ operation. You will find more information on
networ operation in chapter 6.2.2.
9.4. Changing Locations
A change of location, i.e. from a cold to a warm place (for example when the de-
vice has been left in a car overnight before being brought into a warm room for
measuring), can lead to condensation forming on the printed circuit board.
This physical phenomenon, which cannot be avoided through any change in the
construction of such a measuring device, will invariably lead to incorrect read-
ings. Please wait approximately 5 minutes to give the device enough time to
adapt to its new surroundings before carrying out measuring.

Operating Instructions data logger 9
EN
10. echnical Data
Technical Data THI THIP TCO
Air temperature
Principle NTC
easuring range -20 °C to + 50 °C
Accuracy ± 0.3 °C (0…40 °C), otherwise 0.5 °C
Display resolution 0.1 °C
Rel. humidity
Principle capacitive
easuring range 10 to 95 % RH
Accuracy ±2 % RH
Display resolution 0.5 % RH
Air pressure
easuring range – 300…1,300 hPa abs. –
Accuracy – 700…1,100 mbar
at 25 °C ±0.5 hPa –
Display resolution – 0.1 hPa –
CO concentration
Principle – – NDIR
easuring range – – 0 … 5,000 ppm
Accuracy – –
±50 ppm +3 measuring
value at 20 °C
and 1,013 mbar
Display resolution – – 1 ppm
long-time stable – – 20 ppm / a
emory organisation
Sampling interval 10 / 30 s, 1 / 10 / 12 / 15 / 30 min, 1 / 3 / 6 / 12 / 24 h
emory interval 1 / 10 / 12 / 15 / 30 min, 1 / 3 / 6 / 12 / 24 h
Data memory 16 B, 3,200,000 measuring values
Data logging up to 20 measuring channels parallel
Features and
dimensions
LCD display W 90 x H 64 mm
Casing Synthetic material
Dimensions L 166 x W 32 x H 78 mm
Weight approx. 250 g
Interface USB, LAN
Power supply internal 4 x LR6 AA mignon batteries, battery life > 1 year
external USB, LAN (PoE model)
Permissible operational
environmental conditions
Air temperature -20 °C to +50 °C
rel. humidity 0 to 95 % RH, < 20 g / m³ (non-condensing)
Height 10,000 m above SL
Scope of delivery Standard
Data logger, CD RO with SmartGraph 3 PC software
for graphic and numerical display of measurement assessments
and operating instructions, USB cable, batteries
Optional PoE model
This manual suits for next models
2
Table of contents
