JBL Room Mode Correction User manual

RMC™ Room Mode Correction
User Guide

Table Of Contents
RMC™ Room Mode Correction System 3 - 5
What Is RMC 3
What is Included in the RMC Calibration Kit 4
How To Use The RMC Kit 4 - 5
Speaker Placement 6 - 7
Where To Place The Loudspeakers 6 - 7
- Smooth Response 6
- Mounting Options 6
- How Close Should The Loudspeaker Be To The Listener 7
- What About Setting Up In Small Spaces 7
Boundary Compensation 7
Calibrating Your System 8 - 13
I. LSR6328P System 8 - 13
Taking Measurements 8 - 9
Analyze Your Measurements 10 - 11
Adjusting The RMC System 12 - 13
II. LSR6328P Systems with LSR6312SP Subwoofer 14 - 17
Taking Measurements 15
Analyze Your Measurements 16 - 17
Adjusting The RMC System 17
III. LSR6332, or Other Passive, Systems with LSR6312SP Subwoofer 18 - 19
Method One 18
Method Two 19
IV. LSR25P Systems with LSR6312SP Subwoofer 19
V. Surround Systems 20
VI. Multi-Channel Systems with Bass Management 21 - 22
JBL Professional Contact Information 24
2

The Room Mode Correction™ System
What Is RMC?
Developed by JBL Professional, RMC™ is a system designed to calibrate and correct low
frequency (LF) response in typical listening rooms and production facilities. The LSR6328P
full range monitor and LSR6312SP Subwoofer contain a single section parametric equaliz-
er that can be adjusted to compensate for the major low frequency response peak caused
by standing waves in a particular listening space. The LSR6332, LSR25P and other sys-
tems can experience the benefits of RMC when an LSR6312SP is used in the system.
The RMC process allows you to optimize the low frequency response of your system in
your work environment. Using the tools provided in the RMC Kit, simply follow the instruc-
tions step-by-step and allow approximately 30 minutes to perform the adjustment process
for a stereo system. You will experience a noticeable improvement in the sound quality of
your system.
What are Room Modes? Room modes are low frequency resonances caused by standing
waves involving the geometry of the room and its boundary surfaces. The most prominent
modes are the ones that occur between opposite surfaces. If response peaks due to these
modes are not corrected, your mixes may be bass-shy, because you will tend to overcom-
pensate for what may sound like too much bass in the program. Response peaks due to
room modes can be accurately removed by introducing a carefully-tailored inverse
response, which RMC provides. You may also encounter response dips, which are due to
local reflections and interferences between the loudspeaker and listening position. The
most common reflections are from the floor. You should be aware that no system of equal-
ization can correct for a response dip. Dips can only be compensated for by repositioning
loudspeakers and/or listeners in the playback environment. Figure 1 illustrates the typical
situation as it exists in most production rooms. The measured response at the listener is
shown in the right portion of the figure. In most rooms, the response rise due to the domi-
nant mode will usually be in the range from about 40 Hz to 60 Hz, and the response dips
due to floor reflections will be seen in the range from 50 Hz to about 90 Hz.
RMC provides a method for equalizing the peak shown in Figure 1, but the dip, if it is
severe, must be corrected through rearrangement of loudspeaker and listening positions.
In most cases however, "floor bounces" are not problematic.
Listening Position
Peak Null Peak
Mode Structure
dB
Speaker Position Most Modes: Most Floor Dips
25 - 60 Hz 65 - 90 Hz
Peak Due to Axial Mode
Dip Due to Floor Reflection
Frequency (Hz)
dB
3
Figure 1

What Is Included In The RMC Calibration Kit
•Specialized Sound Level Meter
•Calibration CD
•User Guide
•Measurement Chart Paper (make additional 1-to-1 copies for future use)
•Width Template
•RMC Adjustment Tool
•RMC Remote Bypass Control
•9 Volt Alkaline Battery
How To Use The RMC Kit
Using the calibration CD, warble tones spaced approximately on one-tenth octave centers
are played over the speaker systems, and the room response is measured and plotted
point-by-point on chart paper. The center frequency of a response peak is identified, and,
using the Width Template, the width of the peak is determined. The height of the peak in
dB is also measured. These three values are then entered into the RMC equalizer section
located on the rear electronics panel of the LSR6328P or LSR6312SP and, using a look-up
table in this manual, an inverse frequency response curve is introduced into the system.
The RMC Meter: Two views of the RMC sound level meter are shown in Figure 2. The
meter has a press and hold switch to incease battery longevity. Full-scale on the meter
corresponds approximately to a sound pressure level of 86 dB. The meter's scale covers a
range of 16 dB, the same as that of the chart paper you will use to record your measure-
ments. Here is a list of meter status indications:
•Power-On/Low Signal: This is indicated by the
illumination of any LED on the bar graph. If
the sound level in the listening space is below
the measurement range of the meter, a green
LED near the bottom of the bar graph will light.
•Overload: If the sound level in the listening
space exceeds the range of the meter, 0 dB
through -5 dB will all light simultaneously.
•Normal Measurements: When the sound level
is within the range of the meter, the green LED
will be off and one of the red LEDs on the bar
graph will be illuminated, indicating the relative
sound level in decibels (dB).
•Low Battery: When the battery voltage is too
low for accurate measurements, an LED at the
bottom of the bar graph will be illuminated. At
this point, replace the battery. (We recommend
that you keep a spare battery on hand.)
-1
-2
-3
-4
-5
-6
-7
-8
-9
-10
-11
-13
-15
-18
U-R
Ball
Power
Side
Front
Figure 2
4

Chart Paper: As you play test tones on the CD through the system, you will plot the read-
ings on the chart paper. A calibration procedure will ensure that the signals you read will
fit within the window of the meter. Any signals that appear below -16 dB will simply be
entered along the bottom edge of the chart. We recommend you make photo copies of the
chart paper for your use, and keep the original master for future duplication. When dupli-
cating, do not enlarge or reduce the size of the chart.
A view of the chart is shown in Figure 3, with the level scale at the left and the frequency
scale at the bottom. Below the chart are areas for you to enter your collected data:
Frequency (Hz), Level (dB), and Width (%).
The 9-Volt Battery: should be installed in the Sound Level Meter prior to use.
The RMC Remote Bypass Control: when connected to an LSR6328P or LSR6312SP, allows
you to bypass the RMC system from the listening position for before-and-after compar-
isons. You may use mono (tip-sleeve) 1/4” cables such as guitar cables to make the con-
nections as shown below.
0dB
-1 dB
-2dB
-3dB
-4dB
-5dB
-6dB
-7dB
-8dB
-9dB
-
10dB
-
11dB
-
12dB
-
14dB
-
16dB
20Hz 22 24 25 26 28 31 35 41 45 47 50 53 57 62 68 76 85 90 95 105 115 126
Frequency Hz Level dB Width %
Figure 3
Y-Cable
1/4" Cable
Connect to RMC Bypass Control
1/4" Cable
1/4" Cable
1/4" Cable
Y-Cable Y-Cable
Y-Cable
RMC™
5

Speaker Placement
Where To Place The Loudspeakers
A basic question is “where should I place my loudspeakers in the room?” Here are some
pointers for you.
A. Smooth Response: Place the loudspeakers where their frequency response will be the
smoothest and most uniform. The best locations are fairly close to a wall (no more than
about 10 inches from the wall), or out in the room and positioned on ear-height loudspeak-
er stands. Figure 4 and Figure 5 show options for both stereo and surround setups.
Boundary surfaces create reflections from the loudspeakers that will, to some extent, inter-
fere with the direct sound from the loudspeaker to the listener, and these will cause peaks
and dips in response, primarily in the mid-bass range and lower (roughly 250 Hz and lower).
When the loudspeakers are placed within about 10 inches of the wall, the reflected sound
at mid and low frequencies will be largely in phase, or in step, with the direct sound from
the loudspeakers, and interferences will be reduced.
LCR
LR RR
L
C
R
LR RR
Figure 4
Figure 5
6
Near The Wall
Free-Standing Loudspeakers

Generally, the best place to locate a subwoofer is on the floor against a wall, or within a few
inches of the wall. You should avoid the center of the wall, and you should also avoid placing
the sub directly in a corner. What you are looking for is response that is generally uniform and
free from a severe dip or a pair of peaks, and even slight side-to-side adjustments (6 or 8 inch-
es) can materially affect these. A single peak of course you can adjust through RMC, resulting
in the flattest possible LF response.
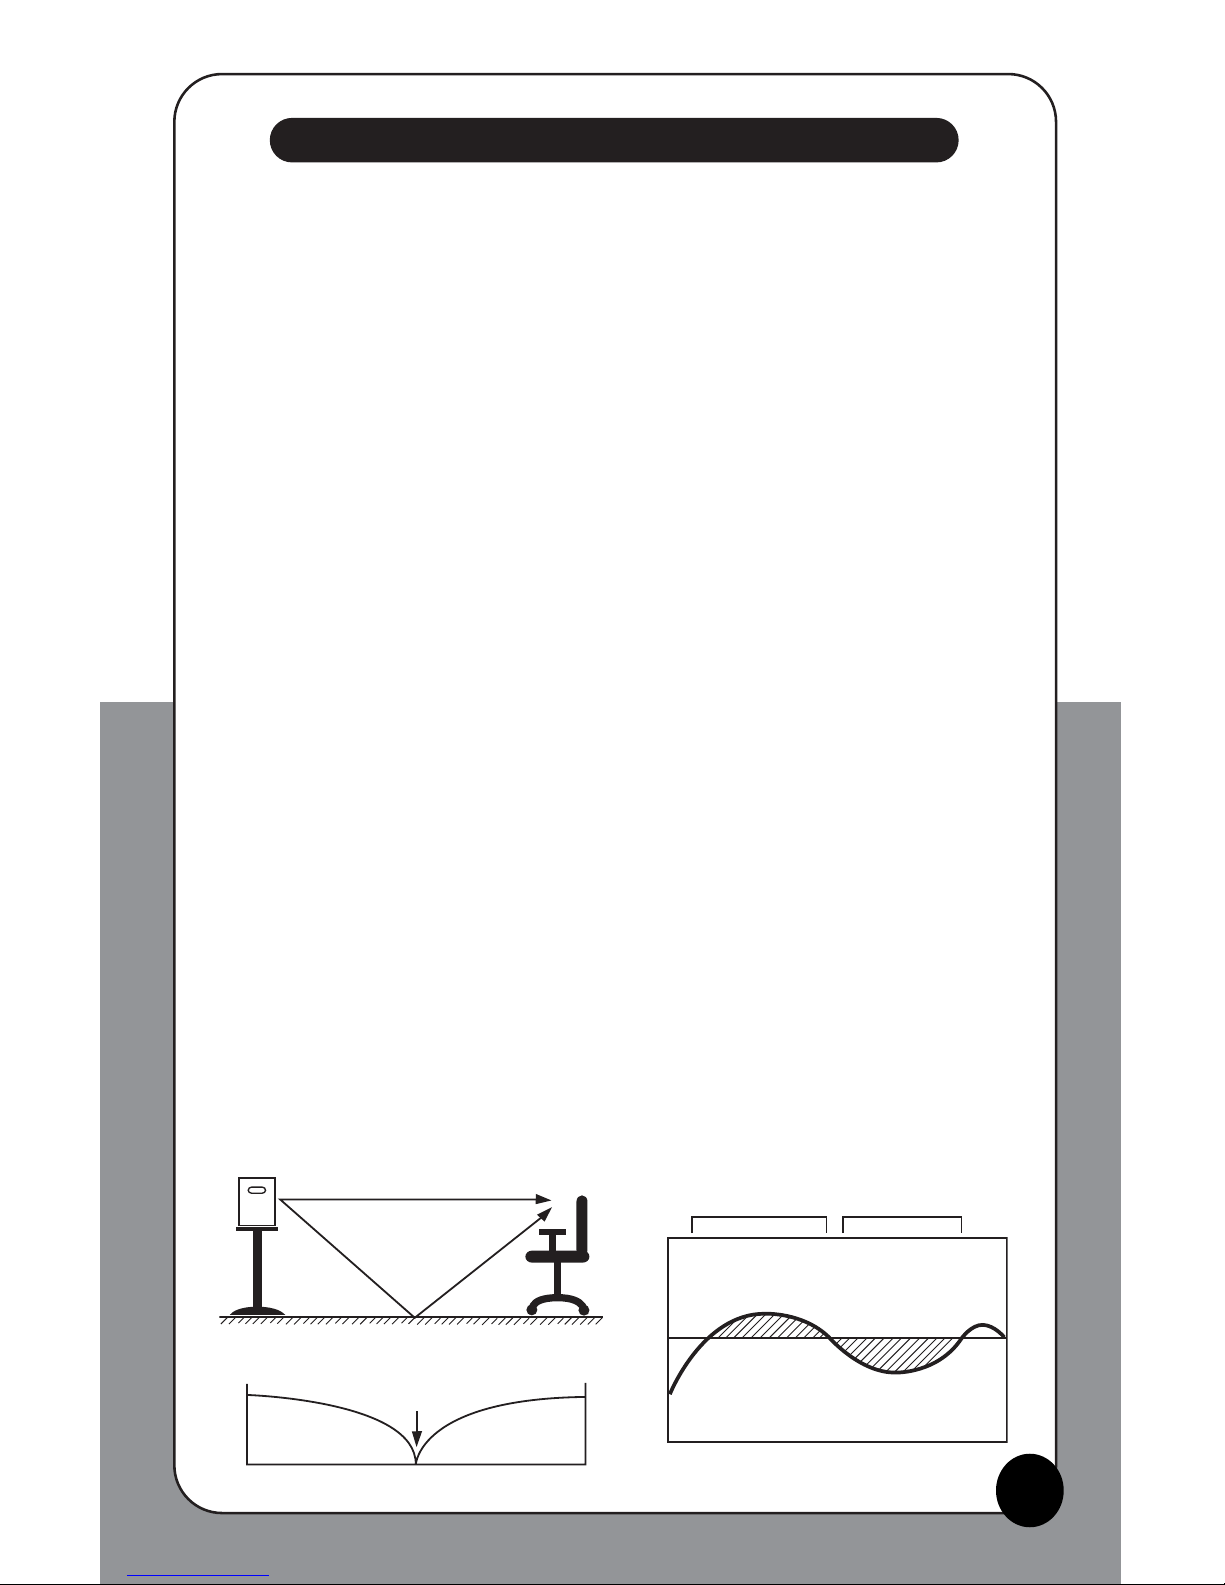
Alternately, when loudspeakers are placed on stands well out into the room, the path traveled
by the reflected signals from the walls will be much longer than the direct path from the loud-
speaker to the listener, and the level of the wall reflections will be much lower than direct
sound. The result is less interference.
B. Mounting: When positioning loudspeakers on a wall, always follow mounting recommenda-
tions provided by the manufacturer of the mounting hardware and aim the principal axes of
the loudspeakers at the primary listening position. If your loudspeakers have ports on the
back, make sure that there are at least 3 to 4 inches between the port opening and the wall.
Caution:
Unsafe mounting or overhead suspension of any heavy load can result in serious injury and equipment
damage. Mounting of speakers should be done by qualified persons in accordance with all applicable local safety and
construction standards. Be certain to follow the instructions providied by the manufacturer of the mounting bracket,
be certain that it is capable of supporting the weight of the speaker to be mounted.
Space your loudspeakers so that the listening angle is symmetrical with the listening posi-
tion. For stereo, the normal included angle between loudspeakers and listener should be in
the range of 35 to 50 degrees. For surround sound applications, follow the recommendations
as shown in Figure 5.
C. How Close Should The Loudspeakers Be To The Listener: Ideally, the loudspeakers should be
far enough away from the primary listening position so that normal head movements don’t
interfere with stereo or surround imaging. Also, the loudspeakers should ideally be placed
up to 8 feet away from the listening position, which would be ideal. If space is not well
damped, you may be required to operate in a “near-field” environment with the loudspeak-
ers no greater than about 4 feet away.
D. What About Setting Up In VerySmall Spaces: The first thing you should do in a very small
space is ensure that it is as acoustically “dead” as possible. Problems will arise both from
boundary reflections as well as from standing waves in the room, and the more heavily
damped the room is, the better it will sound. You may also be forced to place your left and
right channel loudspeaker virtually at the corners of the space, which compounds
response problems. This leads us directly into the next section on boundary compensation.
Boundary Compensation
Your LSR6328P loudspeakers are designed to operate most effectively in relative free space -
away from the walls of a room. Internally, they have been equalized to produce the flattest
low frequency (LF) response under this free-standing condition. When you move the loud-
speaker toward the wall, the LF response below about 150 Hz will rise, reaching a boost of
about 3 dB. If you move the loudspeaker toward a corner (the intersection of two walls), the
LF response will build up even more. There are two DIP switches on the back panel of the
LSR6328P that engage various values of LF attenuation and compensate for these LF build-
ups of response, and graphic below shows the settings you should use in order to make
these changes. The general rules are as follows:
Free-Standing 0 dB attenuation
Near A Wall 1.5 to 3 dB attenuation
Near A Corner 3 to 4.5 dB attenuation
Use no more attenuation than required to reduce any tendency for the system to sound
boomy or bass-heavy. This adjustment should be made before you proceed with the RMC
equalization process. 7

I. LSR6328P System
If your CD player has an output volume control, we strongly recommend that you patch
directly from one output of your CD player to the input of the LSR6328P system.
If your CD player does not have an output volume control, patch into a console fader then
go directly from the console output to the LSR6328P, bypassing any further controls or
functions. These options are shown in Figure 6.
The loudspeakers will be measured one at a time. Set the DIP switches on the back panel
of the system to the OFF position. If you are using boundary compensation setting
Switches 5 and 6, leave these settings on. Make sure that all controls are set to their
counter-clockwise position and that the RMC ENABLE switch is in the OUT position and
that the GREEN RMC “Active” LED is OFF.
Calibrating Your System
out
CD Player
LSR6328P
Volume
Control
Figure 6
Input Trim Active
+
4 dBu Input Sensitivity
+
8 dBu Input Sensitivity
VLF Protect Off
HF Level +1 dB (2 kHz - 20 kHz)
HF Level -1 dB (2 kHz - 20 kHz)
-3.0 dB
-1.5 dB -4.5 dB LF Boundary Com
p.
Figure 7
8
Taking Measurements
1. Place your speakers in the desired position and wire the system together. For assis-
tance with wiring, see the LSR6300 Series owners manual. Connect the RMC Remote
Bypass control to each speaker using “Y” adaptors supplied with each LSR6328P and
LSR6312SP. Turn on the speakers.
2. Setting the reference level: Hold the RMC Meter vertically in front of you at ear level
with display facing you and microphone facing the speakers. Press and hold the ON
button. Play Track 2 on the test CD, adjusting the CD program source level so that the
wide-band noise signal will read -7 on the sound level meter. The purpose here is to
establish a reference level baseline for your measurements.
out
CD Player
LSR6328P
Console:
Direct-to-Fader In/Out out

3. Now advance to Track 3. This track contains a set of warble tones beginning at 126 Hz,
moving downward to the lowest frequencies. As this track is played, keep your eye on
the meter. If none of the tones on Track 3 causes an over-reading, draw a horizontal
line on the chart paper at a level of -7 dB. (See Figure 3) This will be your baseline
reference level.
4. If any of these tones causes an over-load reading on the meter, stop the CD player and
adjust the CD source volume downward slightly. Begin the test again, making sure that
none of the segments in Track 3 will cause an overload. Once you have set a playback
level that causes no overloads, return again to Track 2 and note the new level as
observed on the sound level meter; draw a horizontal line on the chart at the indicated
level. For example, let's assume that your new level setting from the CD source results
in a reading of, say, -9 on the meter; then you would mark the chart paper with a line
at -9, which would become your new baseline reference level. (See Figure 8 below)
5. For now, let's assume that your initial setting of -7 dB was OK and that there were no
overloads when you played Track 3.
6. Beginning with Track 4 and proceeding on to Track 26, make entries on the chart paper
for each warble tone. Before each tone plays, an announcer names the frequency of the
tone. You will note that the warble tone sequence begins at the highest frequency of
126 Hz, progressing downward to the lowest frequency of 20 Hz. Make your entries by
putting a dot on the intersection of the announced frequency and the level as you read
it on the sound level meter. This process is shown in Figure 9. Note that the test tracks
are about 35 seconds long -
probably longer than you will
actually need to make an
entry. You may speed up the
measurement process by
pressing the skip button on
the CD player once you have
made your entry on the chart.
During the course of making
your entries, you may observe
that the meter reading shows
a uniform flickering between two adjacent values. If this occurs consistently, it indi-
cates a value halfway between the two LED's, and you may make your entry according
ly at a half-dB step.
7. After you have finished plotting the sequence of readings, simply connect the dots. You
are now ready to interpret the plotted data with the help of the following sample plots.
-5dB
-6dB
-7dB
-8dB
-9dB
-
10dB
-
11dB
-
12dB
-
14dB
-
16dB
20Hz 22 24 25
26
28 31 35 41 45 47 50 53 57 62 68 76 85 90 95 105 115 126
9
Figure 8
0dB
-1 dB
-2dB
-3dB
-4dB
-5dB
-6dB
-7dB
-8dB
-9dB
-
10dB
-
11dB
-
12dB
-
14dB
-
16dB
20Hz 22 24 25 26 28 31 35 41 45 47 50 53 57 62 68 76 85 90 95 105 115 126
Frequency Hz Level dB Width %
Figure 9

Analyze Your Measurements
Most of your measurements for LSR6328P systems will fall within one of the six examples
which follow. Here are detailed descriptions of each example:
Example A:
Absence of a floor interference dip indicates the loudspeaker was probably mounted
against a wall in a well-damped room, and not too far away from the monitoring position.
You may proceed to equalize the LF room mode for flat response.
Example B:
There are no room mode effects here, but there is a dip due to floor or possibly wall
reflections. If the dip is no greater than about 4 or 5 dB, you can ignore it - and let this
response remain as is. If the dip is greater than about 6 dB, you might try moving your lis-
tening position forward just a bit. This may alleviate the dip somewhat. Otherwise, no
equalization is required
Example C:
This is a very common pattern you will see in fairly live small to moderate size spaces.
The dip may result from both floor and wall reflections and as such may be fairly wide. Try
moving the monitor and/or your listening position to minimize the dip's width before pro-
ceeding. Equalize the peak.
0dB
-1 dB
-2dB
-3dB
-4dB
-5dB
-6dB
-7dB
-8dB
-9dB
-
10dB
-
11dB
-
12dB
-
14dB
-
16dB
20Hz 22 24 25 26 28 31 35 41 45 47 50 53 57 62 68 76 85 90 95 105 115 126
One Low Frequency Peak
10
0dB
-1 dB
-2dB
-3dB
-4dB
-5dB
-6dB
-7dB
-8dB
-9dB
-10dB
-11dB
-12dB
-14dB
-16dB
20Hz 22 24 25 26 28 31 35 41 45 47 50 53 57 62 68 76 85 90 95 105 115 126
One Dip
0dB
-1 dB
-2dB
-3dB
-4dB
-5dB
-6dB
-7dB
-8dB
-9dB
-
10dB
-
11dB
-
12dB
-
14dB
-
16dB
20Hz 22 24 25 26 28 31 35 41 45 47 50 53 57 62 68 76 85 90 95 105 115 126
One Peak and Dip Exceeding 6 dB

Example D:
This is a near-ideal case, and the recommendation is to do nothing. Your system will be
fine as it is.
Example E:
Two interference response dips; no peaks due to room modes. This pattern may be seen
in small spaces where two different delay paths are evident, such as from the floor and a
wall. The absence of a mode peak indicates that the listener is located toward the center
of the room. Slight repositioning of both listener and loudspeaker may change the situa-
tion markedly. Otherwise, no equalization is required.
Example F:
Two LF peaks. In general, you should equalize the peak that has the greater area between
the curve and baseline. You may wish to engage the boundary compensation to lower the
level below 150 Hz, and then repeat the RMC measurement process.
0dB
-1 dB
-2dB
-3dB
-4dB
-5dB
-6dB
-7dB
-8dB
-9dB
-10dB
-11dB
-12dB
-14dB
-16dB
20Hz 22 24 25 26 28 31 35 41 45 47 50 53 57 62 68 76 85 90 95 105 115 126
Variations Within ±3 dB
0dB
-1 dB
-2dB
-3dB
-4dB
-5dB
-6dB
-7dB
-8dB
-9dB
-
10dB
-
11dB
-
12dB
-
14dB
-
16dB
20Hz 22 24 25 26 28 31 35 41 45 47 50 53 57 62 68 76 85 90 95 105 115 126
Two or More Sharp Dips
0dB
-1 dB
-2dB
-3dB
-4dB
-5dB
-6dB
-7dB
-8dB
-9dB
-10dB
-11dB
-12dB
-14dB
-16dB
20Hz 22 24 25 26 28 31 35 41 45 47 50 53 57 62 68 76 85 90 95 105 115 126
Two Low Frequency Peaks
11

Adjusting The RMC System
When you have identified the peak you wish to equalize, 1.) enter its center frequency in
the space provided at the bottom of the chart paper; 2.) in the space provided, enter the
level of the peak which is the distance in dB between the peak value and your baseline;
finally, in the space provided, enter the width as determined by the width template.
Figure 10a shows the Width Template. To
adjust, pull the tab at the top of the width
template. As shown in Figure 10b, the tem-
plate is placed over the peak in a plotted
curve and adjusted so that the shape of the
template matches that of the plot. The corre-
sponding percentage value of width is then
read directly from the vertical index of the
template. 3.) Enter the width value in the
space provided on the chart paper.
PULL
Figure 10a
12
0dB
-1 dB
-2dB
-3dB
-4dB
-5dB
-6dB
-7dB
-8dB
-9dB
-
10dB
-
11dB
-
12dB
-
14dB
-
16dB
20Hz 22 24 25 26 28 31 35 41 45 47 50 53 57 62 68 76 85 90 95 105 115 126
Frequency Hz Level dB Width %
PULL
5%
15%
25%
40%
10%
20%
30%
50%
Figure 10b

4.) Enter your tabulated values into the LSR6328P RMC equalizer using the table below:
Data Entry in RMC Equalizer Table:
Control Position Width (%) Frequency (Hz) Depth (dB)
0 (CCW) 4.5 24 0.0
1 5.0 25 0.0
2 7.5 26 0.0
3 10.0 28 0.5
4 12.5 31 1.1
5 16.5 35 1.9
6 20.5 41 2.9
7 23.0 45 4.4
8 26.0 47 6.4
9 28.0 50 7.9
10 29.5 53 8.3
11 31.0 57 8.9
12 34.0 62 9.5
13 39.0 68 10.2
14 41.5 76 11.0
15 43.5 85 11.7
16 45.0 90 12.7
17 46.5 90 13.1
18 48.0 95 13.5
19 49.0 95 13.9
20 (CW) 50.0 95 14
(CCW) counter-clockwise
(CW) clockwise
Begin with the three controls in their far left (CCW) counterclockwise position and adjust
each one, a click at a time, until you have reached the values entered at the bottom of
your measurement chart. See Figure 11.
Making these entries requires carefully counting the clicks. If you make a mistake, or have
lost count, turn the control to the full counter-clockwise position and start over.
Rechecking the system: After you have made the equalizer entries it is time to re-measure
the system, using Tracks 4 through 26 just as you did when making your first sequence of
measurements. Turn on the LSR6328P RMC function by engaging the ENABLE switch, the
green LED will illuminate. Perform the same calibration procedure for the other speakers
in the system. Use the RMC Remote Bypass control to compare before and after settings.
At this point you may make any fine adjustments by ear. When you are satisfied with your
settings, the RMC Remote Bypass Switch can be disconnected from all loudspeakers.
Figure 11
13

II. LSR6328P Systems With LSR6312SP Subwoofer
First, make sure that you have completed steps for a stereo LSR6328P system. Signal for
the left and right LSR6328P speakers should be fed through the main LSR6312SP unit and
the calibration of the left and right LSR6328P units must have been done with the
LSR6312SP powered off or in Bypass mode (See LSR6300 owner’s manual). Now, to cali-
brate the RMC system of the LSR6312SP, power up the unit and make sure the Bypass is
not active. (See Figure 12) Ensure the RMC system on the LSR6328P units are active.
After the system is connected and levels have been calibrated according to the proce-
dures that follow, the contribution of the subwoofer will match that of the main channel
loudspeaker (Figure 13), resulting in smooth response over the crossover region between
the two.
14
L in
R in
Signal
Source
L out
R out
out
out
Right
Left
in
in
Subwoofer
100 Hz 1 kHz 10 kHz
Subwoofer
Contribution Main Channel
Contribution Summation
Crossover Region
Figure 12
Figure 13

Feed one channel from the CD player into the left or right channel input on the rear of the
LSR6312SP and proceed with the following steps:
1. Set both the LSR6328P and LSR6312SP to the same input sensitivity, using the DIP
switches on the back panels of each unit, as shown in Figure 14. Make sure that the
gain trim pot on the LSR6312SP has been disabled.
2. Make sure the LSR6312SP RMC system is OFF; the defeat is active with dip switch #6
in the UP position.
3. Play Track 27 and adjust the output level of the CD player to get a baseline reading of
-7 dB.
Taking Measurements
4. This section has the same measurement procedure as referenced earlier for the
LSR6328P on page 8.
5. Play Track 3 to determine if there are any meter overloads. If there are, reduce the
signal level from the CD player to ensure that there will be no overloads. If you do
reduce the CD playback level, you will need to adjust your baseline. Play Track 27
again and record the reading as your baseline. Then go to step 6.
6. Using Bands 2 through 26, plot your readings on chart paper and then make these
settings on the rear panel of the LSR6312SP. Recheck the system's equalized
response by playing Track 3.
Input Trim Active
+
4 dBu Input Sensitivity
+
8 dBu Input Sensitivity
VLF Protect Off
HF Level +1 dB (2 kHz - 20 kHz)
HF Level -1 dB (2 kHz - 20 kHz)
-3.0 dB
-1.5 dB -4.5 dB LF Boundary Com
p.
Input Trim Active
+4 dBu Input Sensitivity
+8 dBu Input Sensitivity
Signal Polarity Inverted
164
32 5
-4 dB Bass Alignment
RMC Defeat
Figure 14
15
LSR6328P
LSR6312SP

Analyze Your Measurements
Because of the extended LF response of the LSR6312SP system and its normal location at
the intersection of floor and wall, you may see a variety of response conditions, such as
the ones shown in Figures 15 and 16.
0dB
-1 dB
-2dB
-3dB
-4dB
-5dB
-6dB
-7dB
-8dB
-9dB
-
10dB
-
11dB
-
12dB
-
14dB
-
16dB
20Hz 22 24 25 26 28 31 35 41 45 47 50 53 57 62 68 76 85 90 95 105 115 126
Frequency Hz Level dB
Width %
0dB
-1 dB
-2dB
-3dB
-4dB
-5dB
-6dB
-7dB
-8dB
-9dB
-
10dB
-
11dB
-
12dB
-
14dB
-
16dB
20Hz 22 24 25 26 28 31 35 41 45 47 50 53 57 62 68 76 85 90 95 105 115 126
Frequency Hz Level dB Width %
Figure 15
Figure 16
Two Pronounced Peaks
Sharp Dip Adjacent to a Peak
Two pronounced peaks: Figure 15 shows response with a large peak at about 31 Hz and a
lesser one at 47 Hz. The first recommendation is that, if the sub is in a corner, move it
away from that position along the front wall. The 31 Hz peak will probably diminish signifi-
cantly as you do this. The 47 Hz peak is then the one you should equalize, since it is clear-
ly in the range where it can affect your judgement of program content and balances.
If the 31 Hz peak does not diminish when you move the sub, you should reduce the overall
sub level, bringing the 47 Hz peak down about 5 dB. You can then proceed to equalize the
31 Hz peak with RMC.
16

A very sharp dip adjacent to a peak: Figure 16 shows a peak at 41 Hz with an adjacent
sharp dip at 57 Hz. A deep response dip such as this is caused by destructive interfer-
ence, and such peaks can occur either above a dominant or strong response peak, as
shown here, or below a response peak. Sometimes, moving the test microphone a short
distance will virtually eliminate the dip. (Actually, you are not eliminating the dip, but
merely moving away from it.) If this appears to be the case, you should make slight
rearrangements in the subwoofer location and even move your working space slightly.
Remember that you cannot equalize the dip - but you may be able to avoid it altogether by
rearranging your workspace.
Another possible alternative here is to engage the polarity switch on the LSR6312SP
Subwoofer. Sometimes, this is all that it takes to get rid of - or alleviate - a response dip.
Do not worry about which setting of the polarity switch is "correct." Use the setting that
results in the most uniform response.
You will soon find out that relatively small changes in the position of a subwoofer along a
floor-wall boundary will make significant changes in the measurements you make. Ideally,
you would like to make the smallest correction necessary, so do not hesitate to experi-
ment with subwoofer placement. While corner locations are often touted as being the best
place to get good bass, that position usually results in fairly wide swings in measured
response. This is because of differences in distances and how the room modes are stimu-
lated. The switch setting which produces the most output also assures the phase
response is optimal.
Important Note:
The crossover frequency between the LSR6312SP and LSR6328P is
roughly 80 Hz. If you have carried out equalization at that frequency, or fairly close to it,
you may find that the overall response peak that you reduced in the subwoofer's response
may still be partially present. The reason is that there are two loudspeakers contributing at
that frequency. So do not hesitate to reduce the peak further using the RMC section of the
LSR6312SP. This can be done by advancing the RMC Depth Control one click at a time.
Adjustments
If you have more than one LSR6312SP in your system, you must equalize each one sepa-
rately, in its own position and with the others turned off. In carrying out this procedure,
you must feed each LSR6312SP directly with the input measurement signal; however,
once the equalization process has been accomplished, you can feed all of the subwoofers
in a chain by using the SUMMED OUT of one unit into the input of the next. See Owner’s
Manual for additional details.
Enter settings into the RMC Equalizer on the electronics panel of the LSR6312SP
Subwoofer. Enable the RMC System by setting the RMC Bypass Dip Switch to the OFF or
DOWN position. When you have finished equalizing the subwoofer portion of your system,
it is time to put the finishing touches on the overall system. You may want to make slight
changes in loudspeaker location, as well as adjust the subwoofer level(s) relative to the
main channels. Play a variety of music, both stereo and surround sound, before you make
any final adjustments. You can adjust the level of each subwoofer using the RMC make up
gain on the LSR6312SP electronics panel. You can play Track 27 on the RMC Calibration
CD and use the meter to calibrate the subwoofer level. Repeat the procedure for each
subwoofer in the system. You can also compare the level of the LSR6328P satellite speak-
ers using Track 2. Normally the subwoofer and satellite levels should be equal, however,
you may prefer the balance when the subwoofer output is 1-3 dB greater than the main
channel speakers.
17

III. LSR6332 Or Other Passive Systems With LSR6312SP Subwoofer
Many engineers will want to use the LSR6312SP subwoofer in stereo or surround activi-
ties using passive loudspeaker systems such as the LSR6332. There are two ways you
can do this:
Method One
Feed the Left, Center and Right channel power amplifiers through the three sets of signal
inputs and outputs on the rear panel of the LSR6312SP, as shown in Figure 17. This will
insert 80 Hz high-pass filters ahead of the external power amplifiers driving the Left,
Center and Right channels. At the same time, the LF content of each input will be low-
passed at 80 Hz, summed, and fed to the integral subwoofer amplifier.
1. Taking Measurements, refer back to LSR6328P Taking Measurements section on page 8
2. After you have made these connections, play Track 2 over the center loudspeaker and
set the volume level to read -7 dB on the sound level meter.
3. Now, play Track 4 and adjust the level at the subwoofer to achieve a reading of -7 dB
on the sound level meter. We suggest that you make this adjustment on the rear panel
of the LSR6312SP by engaging Switch 1 (S1) and using the makeup gain trim control.
4. You are now ready to play Track 3, to check for any over-readings. Make any level
adjustments if necessary by engaging Switch 1 (S1) and using the makeup gain trim
control, and then proceed to play Tracks 4 through 26, making your entries on chart
paper.
5. Analyzing Your Measurements, refer back to LSR6328P Analyzing Your Measurements
section on page 10 and 11.
6. By now, you are familiar with the equalization procedure. Enter the frequency, level and
width values at the bottom of the chart and proceed to make the RMC settings on the
rear panel of the LSR6312SP.
7. Recheck the overall sub and main system balance by playing tracks 2 and 27 as well
as a track of music that you know well. Make any small changes in subwoofer balance
that seem appropriate.
L in
R in
Source
L out
R out
out
out
Right
Left
in in
amplifier amplifier
Subwoofer
Figure 17
18

Method Two
Many engineers are quite happy with the response of their existing stereo or surround
loudspeakers. They may only want to add a subwoofer to their system for more extended
bass. In this case, the hookup shown in Figure 18 should be used. You can get a sub-
woofer feed by sending a parallel or “multed” feed of the LCR front channels - or by using
the Direct In to the subwoofer if your signal source has a SUB or 0.1 (point-one) output.
Measurements, Analysis and Adjustments - The next step is to play Tracks 4 through 26
for correcting the major room mode, and then to make final adjustments to your taste.
Note: When using full-range satellites not high-passed using the LSR6312SP bass man-
agement system, it is recommended a low-pass filter be applied to the feed to the sub-
woofer so the sub does not produce the same bass frequency as the satellite speakers,
which could possibly cause bass cancellation. JBL Professional recommends Method One
which will generally produce the best results except in special cases.
IV. LSR25P Systems With LSR6312SP Subwoofer
Setup procedures, measurements, analysis and adjustments for LSR25P systems with a
LSR6312SP Subwoofer is the same as the LSR6312SP with LSR6328P system. Refer to
this section on page 14. Figure 19 shows a wiring diagram of the LSR25P system.
Note: Do not enable the high pass filter dip switch on the LSR25P system.
L in
R in
Source
out
out
Right
Left
in in
amplifier amplifier
Subwoofer
Figure 18
19
L out
Right
Left
L in
R in
Source R out
out
out
Subwoofer
Figure 19

20
V. Surround Systems
Figure 20 shows a setup in which 3 LSR6328P units and one LSR6312SP unit comprise
the front channels. The rear channels are completely independent of the front set and may
even be different loudspeaker models. For example, a pair of LSR25s may be used in the
rear.
The front channels and subwoofer have been discussed earlier in this User Guide. If you
choose to use a pair of LSR6328Ps for the rear channels, treat them as discussed in
Section II on page 14. After connecting the system, refer to pages 8-13 for measurements,
analysis and adjustment procedures.
L out
Right
Left
L in
R in
Center
Source C out
R out
C in
Right Rear
Left Rear
LR out
LFE Direct in
RR out
LR in
RR in
out
out
out
Subwoofer
Figure 20
Table of contents
Other JBL Test Equipment manuals
Popular Test Equipment manuals by other brands

TESTO
TESTO 826-T2 instruction manual

Dostmann Electronic
Dostmann Electronic PH CHECK 5040-0301 Operating instruction

PCE Instruments
PCE Instruments PCE-HDM 7 user manual

Lovibond
Lovibond Scuba II instruction manual

MULTI MEASURING INSTRUMENTS
MULTI MEASURING INSTRUMENTS 290RMS instruction manual

Nidec
Nidec Shimpo DT-315AEB-230V-NIST instruction manual