LD Didactic CASSY User manual

R
USB
A B D
OK
FUSE=FF 16 A
690 V A
>30 kA
nicht ohne Maske
in Betrieb nehmen
do not use
without mask
250 VA
1 A
0
+
-
+
-
+
+
+
+
+
+
-
-
-
-
-
-
I
UA
I
UB
I
U
I
UD
AT III
300 V
A : 700 V / 16 A
D : 1000 V / 25 A
AT III
300 V
A : 700 V / 16 A
D : 1000 V / 25 A
ASSY POWER ANALYSER+
727 110
U
V
W
X
Y
1
2
3
4
5
67
8
9
10
11
1
1
1
12
13
14
13
13
13
Instruction sheet 721 100
Power Analyser ASSY (727 100)
Power Analyser ASSY Plus (727 110)
1 Measuring channels Uand I
2 Mask
3 Display
4 Rotary selector and OK button
5 ursor buttons
6 Start button
7 hannel selection
8 USB- connector
9 Power switch
10 LEDs
11 Relay
12 Potential equalisation connection
13 Output channels (only 727 110)
14 Output, function generator output (only 727 110)
1 Safety notes
Please read first
This device has been designed for use in LD Didactic
experiments, and is therefore only intended for use in
dry rooms. If the device is used for other measurements,
the user is responsible for the risk assessment and must
take the necessary safety precautions.
All users should be instructed about the risk of electric
shock. The user of the measuring instrument must en-
sure compliance with the guidelines of the trade associa-
tion or other insurance carriers, country-specific require-
ments, as well as regulations for schools and universi-
ties.
The Power Analyser ASSY meets the following stan-
dards:
EC/EN61010-1-2001
• Safety regulations for electrical equipment for
measurement, control, and laboratory use, Part 1:
General requirements
• Rated voltage range: 700 V A and 1000 V D
• AT III 300 (see table of permitted types of mains).
• Pollution degree 2.
• Use the analyser and accessories only as speci-
fied in the operating instructions. Failure to follow
these instructions may affect the protective func-
tions provided by the analyser.
Warning!
A "Warning" indicates circumstances and actions that
represent one or more sources of risk to the user.
Warning!
• To avoid electric shock and fire hazard:
• Read this entire manual carefully before using the
analyser and accessories.
• Read all instructions thoroughly.
• Do not work alone.
• Do not use the product near explosive gases,
vapours, or in humid or wet environments.
• Use the product only as intended. Otherwise, the
protection offered by the product may be affected.
• Only use safety leads that are approved for the
maximum values of the Power Analyser ASSY.
• If measuring tips are used, keep your fingers be-
hind the finger guards on the measuring tips.
• Inspect the analyser, voltage probe heads, mea-
surement leads, and accessories for any mechan-
ical damage before use, and replace them if nec-
essary. heck for cracks in the insulation (housing,
cable sheath) or if parts are missing. Pay special
attention to the insulation on the plugs.
• heck the function of the measuring device by
measuring a known voltage.
© by LD DIDA TI GmbH · Leyboldstraße 1 · D-50354 Hürth · www.ld-didactic.com
Tel: +49-2233-604-0 · Fax: +49-2233-604-222 · Email: [email protected] · Technical alterations reserved

• Remove all unused probe heads and measuring
tips, test leads, and accessories.
• Always first connect the Power Analyser ASSY
to the mains socket before connecting it to the test
setup.
• Do not touch voltages > 25 V A , effective, or
60 V D .
• Use potential equalisation only for grounding the
Power Analyser ASSY. Make sure that no volt-
age is present here.
• The voltages to be measured must not exceed the
maximum value of 1000 V D and 700 V A , and
the currents must not exceed the maximum value
of the current of 16 A A and 16 A D , continu-
ous, or pulses of 24 A.
• The voltages used must not exceed the specified
rated data of the probe heads and measuring tips,
test leads, and accessories.
• When measuring, only use the correct measure-
ment category ( AT), voltage and current-tested
test leads and adapters.
• Never exceed the rated values of the measure-
ment category ( AT) for the lowest rated individual
component of a product, test lead, or accessory.
• Follow the local and national safety regulations.
• Use personal protective equipment (approved rub-
ber gloves, face shield, and flame-retardant cloth-
ing) to prevent electric shock and burn injury in
case dangerous live electrical conductors are ex-
posed.
• Do not work with the device if the covers are re-
moved or the case is open. You might make con-
tact with dangerous voltages.
• Do not use bare metal BN or banana plugs.
• Never insert any metal objects into the connectors.
L1/ P1
L2/ P2
L3/P3
PE/E
N/ N
L1/P1
L2/P2
L3/P3
PE/ E
L1/P1
L2/P2
L3/P3
PE/ E
L1/P1
L2/P2
PE/E
L1/P1
L2/P2
PE/E
N/N
VV V V V V
12,5 bis 48 30 / 60 50
60 100 / 200 10066 / 115 66 100
110, 115 110 / 220 150
110, 115
115 / 230
120 / 240
120, 127
120 / 208
120, 127
127 / 220
220 / 380
230 / 400
240 / 415
260 / 440
277 / 480
220, 230, 240
260, 277, 347
380, 400, 415
440, 480
200 220
230
240
220 / 440
240 / 480
300
347 / 600
380 / 660
400 / 690
417 / 720
480 / 830
500
577
600
480 480 / 966 600
660, 690
720, 830
1000
1000 1000
Three-phase
4-conductor systems
with grounded
neutral conductor
Three-phase
3-conductor systems
ungrounded
Three-phase
3-conductor systems
phase grounded
Single-phase
2-conductor
system, A or D
voltage
Single-phase
3-conductor
system, A or D
voltage
grounded
Voltage conductor
to neutral conductor,
taken from rated A
voltage or rated D
voltage up to
and including
Rated voltage of power supply systems
Fig. 1: Voltages and types of mains for AT.
2 Description
Power Analyser ASSY and the Power Analyser ASSY Plus
are measuring devices for use in experiments in electrical en-
gineering, in the areas of drive technology, power electronics,
electrical machines, and power engineering.
Measurements are performed in 4 isolated channels, according
to AT III 300. The channels are marked by the letters A, B,
, and D. They can each measure the current or the voltage,
or current and voltage at the same time.
2.1 Voltage and current U,I
• Instantaneous values: U,I
• Mean values: UAV,IAV
• RMS values (A +D ): UTRMS,ITRMS
• RMS values (A ): UTRMSA ,ITRMSA
The measuring methods can freely choose for all channels.
2.2 Phase shift 1
The phase shift φ(channel), indicates the angle between the
effective power and the apparent power of the fundamental
wave. This function is only active if voltage and current are se-
lected and the measurement method is set to RMS value.
2.3 Active power
Measures the effective power. This function is only active if
voltage and current is selected.
2.4 Frequency
Frequency of the voltage for waveforms that pass through the
zero axis. This frequency measurement is suitable for measur-
ing the mains frequency in energy grids.
2.5 Phase shift 2
The phase shift φ(channel A / channel X), measures the angle
between channel A and the selected channel, e.g., φAA,φAB.
3 Technical Specifications
Graphic display: 9 cm (3,5"), QVGA, colour, high
brightness (adjustable up to 400 cd/m2)
Operation: Push-button and rotary selector with
push-button
Inputs: 4 isolated measuring channels, each with
Uand Imeasurement (max. 8 usable
simultaneously)
Input A-D : Uand Iconnection
Output U-X: Voltage outputs ±10 V, 200 mA (only for
727 110)
Output Y: Voltage output as function generator,
0.01 Hz to 20,000 Hz (only for 727 110)
Sockets for Uand I: 4-mm safety sockets
Voltage ranges U: 25.0/70/250/700 VRMS
±36/±100/±360/±1000 VAV
urrent ranges I: 0.7/1.6/7/16 ARMS
±1/±2.4/±10/±16 AAV
Sampling rate: Max. 1,000,000 values/s per channel,
for Uand I, max. 500,000 values/s
2 / 14 Instruction sheet 721 100
© by LD DIDA TI GmbH · Leyboldstraße 1 · D-50354 Hürth · www.ld-didactic.com
Tel: +49-2233-604-0 · Fax: +49-2233-604-222 · Email: [email protected] · Technical alterations reserved

Resolution of the
analogue inputs
and outputs: 16 bits
Loudspeaker: Error message when the measuring
ranges are exceeded
Data memory: 10,000 values for each set of
measurements, built-in Micro-SD card
(4 GB) for more than a thousand
measurement files and screenshots
WLAN 802.11 b/g/n as access point or client
(WPA/WPA2) – A client connection to an
Internet-enabled router/hotspot also
enables the Internet connection of
connected tablets or smartphones
HTTP server: integrated (display of multimeter, table,
and diagram in a browser)
WebSocket server: integrated (distribute current
measurement data to up to three clients)
VN server integrated (remote operation by
transmitting the display content to a
client)
USB ports: onnection of a USB-
Mains voltage: 230 V, 50-60 Hz
Dimensions: 300 mm x 300 mm x 185 mm
Weight: 2700 g
3.1 Equipment included
• Power Analyser ASSY (727 100) or Power Analyser
ASSY Plus (727 110)
• Power cord DE and GB
4 Assembly description
4.1 Measuring channels (1)
• Each channel can measure the voltage Uand the cur-
rent I.
• Each channel is isolated against every other channel
and against the control unit in accordance with AT III.
• The measuring resistors in the circuit are designed as
specified on the imprint of the screen.
• The polarity of voltage Uand current Iis arranged such
that the power Pis positive (consumption) if the power
flows from left to right.
• When voltage measurement of an A voltage is activat-
ed, its frequency fcan also be measured.
• When the voltage and current measurement is activated,
the power Pand for alternating values (RMS value), the
load angle φand the frequency fcan also be measured.
• For alternating values (RMS value), if more than one
channel has been activated, the shift angle can be mea-
sured with respect to the reference value of channel A.
4.2 Mask (2)
• Each channel is protected by a 16 A gR, which can be
replaced by removing the mask.
• It can only be replaced after all test leads have been re-
moved and the device has been switched off (see safety
note).
• The fuses can be pried out by using a screwdriver in the
slot on the side.
• The device must not be operated with an open mask.
4.3 Display (3)
Fig. 2: Display for manual measurement.
Menu bar
ontains all sub-menus that have been activated (27 maxi-
mum). The selection is made with the rotary selector , and
activated with OK.
Display field
• Individual measured values and settings of the output
channels
• All measured values of a measuring channel A to D with
the settings of the associated output
• All measured values (no more than 24 values)
• Vector diagram
• Table
• Diagram
Status bar
• Information about the measurement
• WiFi status
• Time of day
4.4 Rotary selector and OK button (4)
Turn the rotary selector to make a selection in
• the menu bar (move left – right),
• the settings menus (move up – down),
• the range menus (move up – down),
• value lists (move up – down).
In some settings menus, it is necessary to move to the right.
This can only be done with the cursor buttons (e.g., trigger
menu).
• Only the rotary selector can activate a selection by
pressing OK. A setting is saved or opened in a sub-
menu.
4.5 Cursor buttons (5)
• The buttons cannot be used in the menu bar as
they can only select the display field in normal view.
• The buttons are only active in a few settings menus.
• The buttons can jump from the menu bar to the set-
tings menu and back.
• The buttons can make a selection in the settings
menu, area menu, or value list, but cannot activate it.
Instruction sheet 721 100 3 / 14
© by LD DIDA TI GmbH · Leyboldstraße 1 · D-50354 Hürth · www.ld-didactic.com
Tel: +49-2233-604-0 · Fax: +49-2233-604-222 · Email: [email protected] · Technical alterations reserved

4.6 Start button (6)
Starts and stops the measurement and simultaneously jumps
to in the menu bar.
4.7 Channel selection (7)
Jumps directly to the first active value of the selected channel
in the menu bar. If the selected channel is not yet active, the
voltage Uis automatically activated.
4.8 USB-C plug (8)
onnection for the supplied USB cable or a suitable USB stick.
4.9 Power switch (9)
Switches the device on and lights up when it is switched on and
mains voltage is present.
4.10 LEDs (10)
Lights up during start-up, firmware update, and saving.
4.11 Relay (11)
Allows measuring of switch-on and switch-off processes.
4.12 Potential equalisation sockets (12)
• Enables the meter to include potential equalisation in
measurements that may require it, such as in frequency
converter circuits.
• The user is responsible for setting up potential equalisa-
tion as it depends on local conditions.
5 Operation
5.1 On first use
• Switch on the Power Analyser ASSY with the power
switch.
• On delivery, the display shows the language selection
menu in the tab . After the language has been select-
ed, the display shows the activated channel UAas it will
after each subsequent start-up.
• If the language has been set incorrectly, use the rotary
selector or the cursor button to go to , and press the
rotary switch OK. Select the language with rotary selec-
tor and activate it with OK.
5.2 Selecting and configuring values to measure
• Use the buttons A to D to select a channel. If not yet ac-
tive, the voltage measurement of the selected channel is
activated at the same time.
• If the desired measurand is not displayed automatically,
select the measurand in the displayed menu bar and ac-
tivate or deactivate it with OK. An activated measured
variable is marked with a small red bar in its list entry
(see fig. 3).
• Press OK or to open the menu of the measurand. The
selection is preferably made via the rotary selector .
• The setting options depend on measurand:
◦ Measuring range (including automatic)
◦ Acquisition of instantaneous values, mean values,
and RMS values
◦ Tare (→ 0 ←) to zero the measured value
Fig. 3: Display with measured variables switched on.
◦ Zero point left, centre, or right for analogue display
and diagram scale for current values and mean
values
◦ orrection (for special applications)
Notes regarding displayed values
By default, values to be displayed are averaged over 100 ms.
This can be modified by setting the recording mode to instan-
taneous values or RMS values, if necessary. Values in red indi-
cate that the configured measuring range has been exceeded.
Notes on power measurements
Power Analyser ASSY is optimised for the simultaneous
measurement of U,I,P, and f. In particular, the measuring
range setting for Pis always automatic and only depends on
the measuring ranges of Uand I.
If Uand Iare active and display RMS values, the phase shift
angles φmay be activated as well.
For the frequency measurement fthe measurement quantity U
must be activated. It requires an A voltage that runs through
the zero line.
5.3 Switching between measured quantities
The quantities which have been activated for measurement are
indicated by a small red bar above their listing and all of them
are measured simultaneously. It is not necessary to switch
back and forth between them.
For demonstrations and for the control of the measured values,
the display of the measured values may, however, be switched
over. That's possible only via the buttons. By pressing the
buttons in the desired direction, you can switch between the
side-by-side displays (see fig. 5).
5.4 Starting a set of measurements
Once all the quantities to be measured have been activated,
selecting is sufficient to start the measurements and to stop
them when you are finished. Standard settings for duration
of measurement (measuring time) and measuring interval are
used. These can be altered before measurements are started.
5.5 Setting measurement parameters
Fig. 4 shows a typical configuration of measurement parame-
ters. Measurements recorded can be saved or deleted via the
menu (see section 5).
4 / 14 Instruction sheet 721 100
© by LD DIDA TI GmbH · Leyboldstraße 1 · D-50354 Hürth · www.ld-didactic.com
Tel: +49-2233-604-0 · Fax: +49-2233-604-222 · Email: [email protected] · Technical alterations reserved

Fig. 5: To the right of the displayed measurement, there may be other displays indicating any other quantities that are activated, as well as a table
of the measurements and, on the far right, a plot of those measurements. You can switch between the various displays with the keys
and .
Fig. 4: Typical measurement parameters of an automatic voltage
measurement with trigger (here 0 V rising) and possibly pre-
trigger (here start of the measurement 10 ms before the trig-
ger).
The recording of measurements can either be controlled man-
ually or automatically:
• Manual: when → Start Measurement is activated,
one set of measurements only is recorded with the pre-
sent measurement values.
• Automatic: measurements are recorded over a pre-set
duration at pre-set intervals It is possible to configure
trigger and (pre-trigger) settings for this. It is not essen-
tial to stipulate a measurement duration. If no duration
is configured, the measurement will continue until it is
stopped manually or until the internal memory for the set
of measurements in question is full (10,000 values).
• Repeating: This is similar to automatic mode but the
measurements are repeated continuously. A duration
must be stipulated for this mode.
Notes regarding measurement intervals
For rapid measurements made at an interval of less than
100 ms, please take the following into account:
• Even if the display is showing average or RMS values,
the actual measurements in the set are still instanta-
neous. The same settings can then be used for evaluat-
ing the results (e.g. RMS values and curves). Averages
and RMS values are only measured and displayed be-
fore or after such rapid measurements.
• Automatic setting of measuring ranges is disabled during
rapid measurements to ensure that no values are omit-
ted.
Notes regarding measuring times
The unit selected for the duration of the measurement (mea-
suring time) will also be used as the unit for the time axis. If
the duration is given in hours, then the time axis will also be
scaled in hours. In such cases, though, the time axis will not
start from 0 but from the time of day when the measurements
starts. When making measurements, for example, this means
it is possible to see the time of day when the measurements
were recorded. If this is not what is wanted, it is possible to re-
set the measurement time to minutes after the measurement
has been made, from where it can then be set back to hours.
Notes regarding automatically deleted measurements
Measurements are not usually deleted without a confirmation
prompt being displayed. When a new measurement is started,
there is also a prompt asking whether the existing measure-
ment values should be deleted.
But: If a USB cab e is p ugged in or a WiFi connection to
CASSY Lab 2 or the CASSY App is estab ished, a measured
va ues a ready recorded wi be ost in the process because the
data acquisition wi then be comp ete y taken over by CASSY
Lab 2 or the CASSY App.
5.6 Evaluations within the table
The table is shown to the right of the displayed measurements
and can be accessed with the arrow keys and (see fig. 5).
The menu for the table is always selectable via (View: Table)
or from the table view itself by pressing .
All activated measured values are stored internally. However, a
maximum of 4 measured values and the time axis can be dis-
played. The columns can be freely selected via the table menu.
To scroll in large tables, you need to set Scrolling to manual
in the table menu set; you will then immediately jump into the
table where you can scroll in the table with . For Scrolling
set to automatic, the last measured line is always displayed as
the bottom line.
5.7 Evaluations within the diagram
A diagram showing a plot of the values is displayed to the right
of the table and can be accessed with the arrow key (see
fig. 5).
Normally, values of all quantities activated for measurement
will be shown on the diagram. This can, however, be modified
with the help of the diagram menu.
The diagram menu is always selectable via (View: Diagram)
or from the diagram view itself by pressing .
The menu contains various evaluation functions which may be
selected (e.g. zoom, line fitting, integrals). These are applied to
the currently selected region of the plotted curve.
Instruction sheet 721 100 5 / 14
© by LD DIDA TI GmbH · Leyboldstraße 1 · D-50354 Hürth · www.ld-didactic.com
Tel: +49-2233-604-0 · Fax: +49-2233-604-222 · Email: [email protected] · Technical alterations reserved

By default, the selected region is the full length of the first
(black) curve. This can be altered by selecting Range and then
selecting the desired curve.
After this range function has been selected from the diagram
menu, the start and end of the range can be selected via the
rotary knob and OK, either until both ends of the range have
been defined or a cursor key has been clicked to cancel the ac-
tion.
If more than one curve is to be displayed at once, a second y-
axis will automatically be displayed if the display range of the
second curve differs from that of the first. The colour of the
scale divisions for that axis will match the colour of the curve to
which they belong.
Notes on evaluation functions
As long as no ranges have been selected, the zoom function
will zoom into all of the y-axes but not the x-axes. You can only
zoom in on the x-axes as well by selecting a range.
Multiple subsequent evaluations can be made without deleting
any previous ones. The most recent result of any evaluations
will be displayed in the status bar at the bottom of the diagram.
5.8 Switching off
The Power Analyser ASSY and the Power Analyser ASSY
Plus are switched on and off via the power switch.
When the device is switched off, the current set of measure-
ments and the present settings are erased. Any sets of mea-
surements which have been saved are, of course, retained.
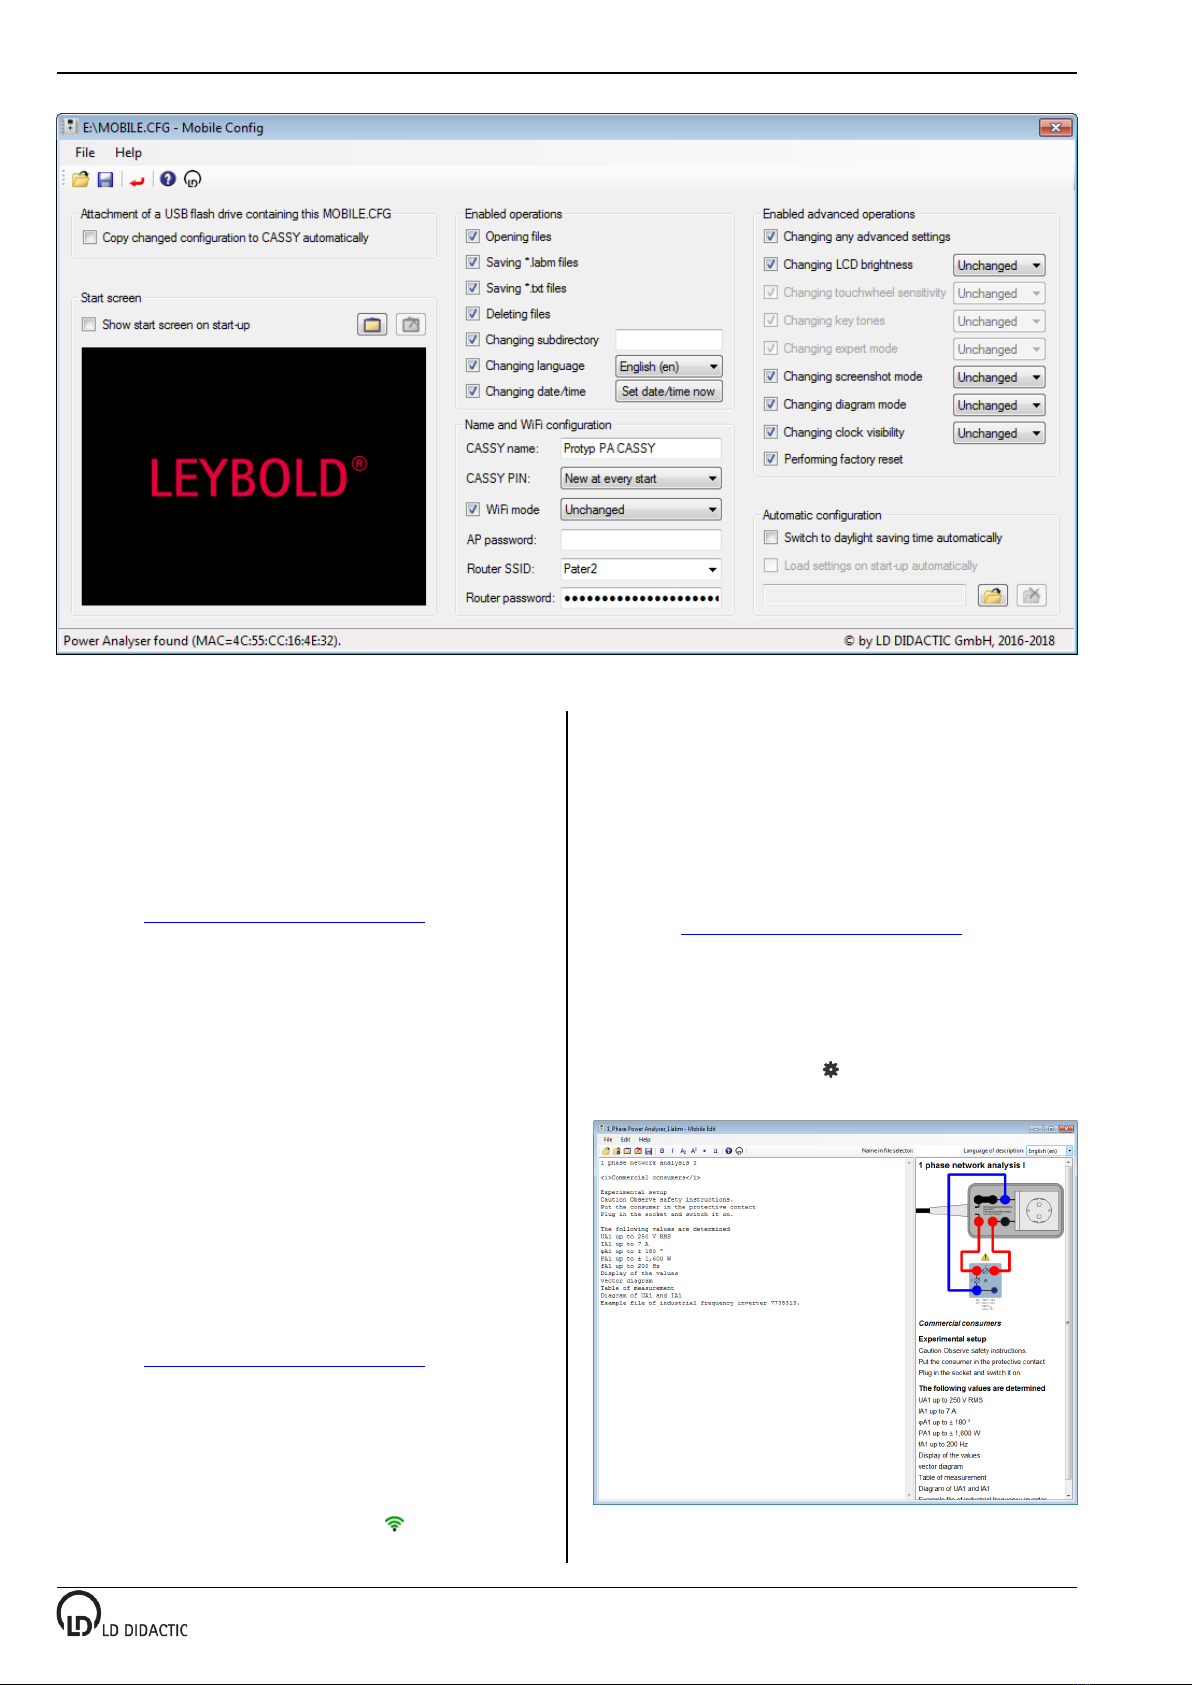
6 Save
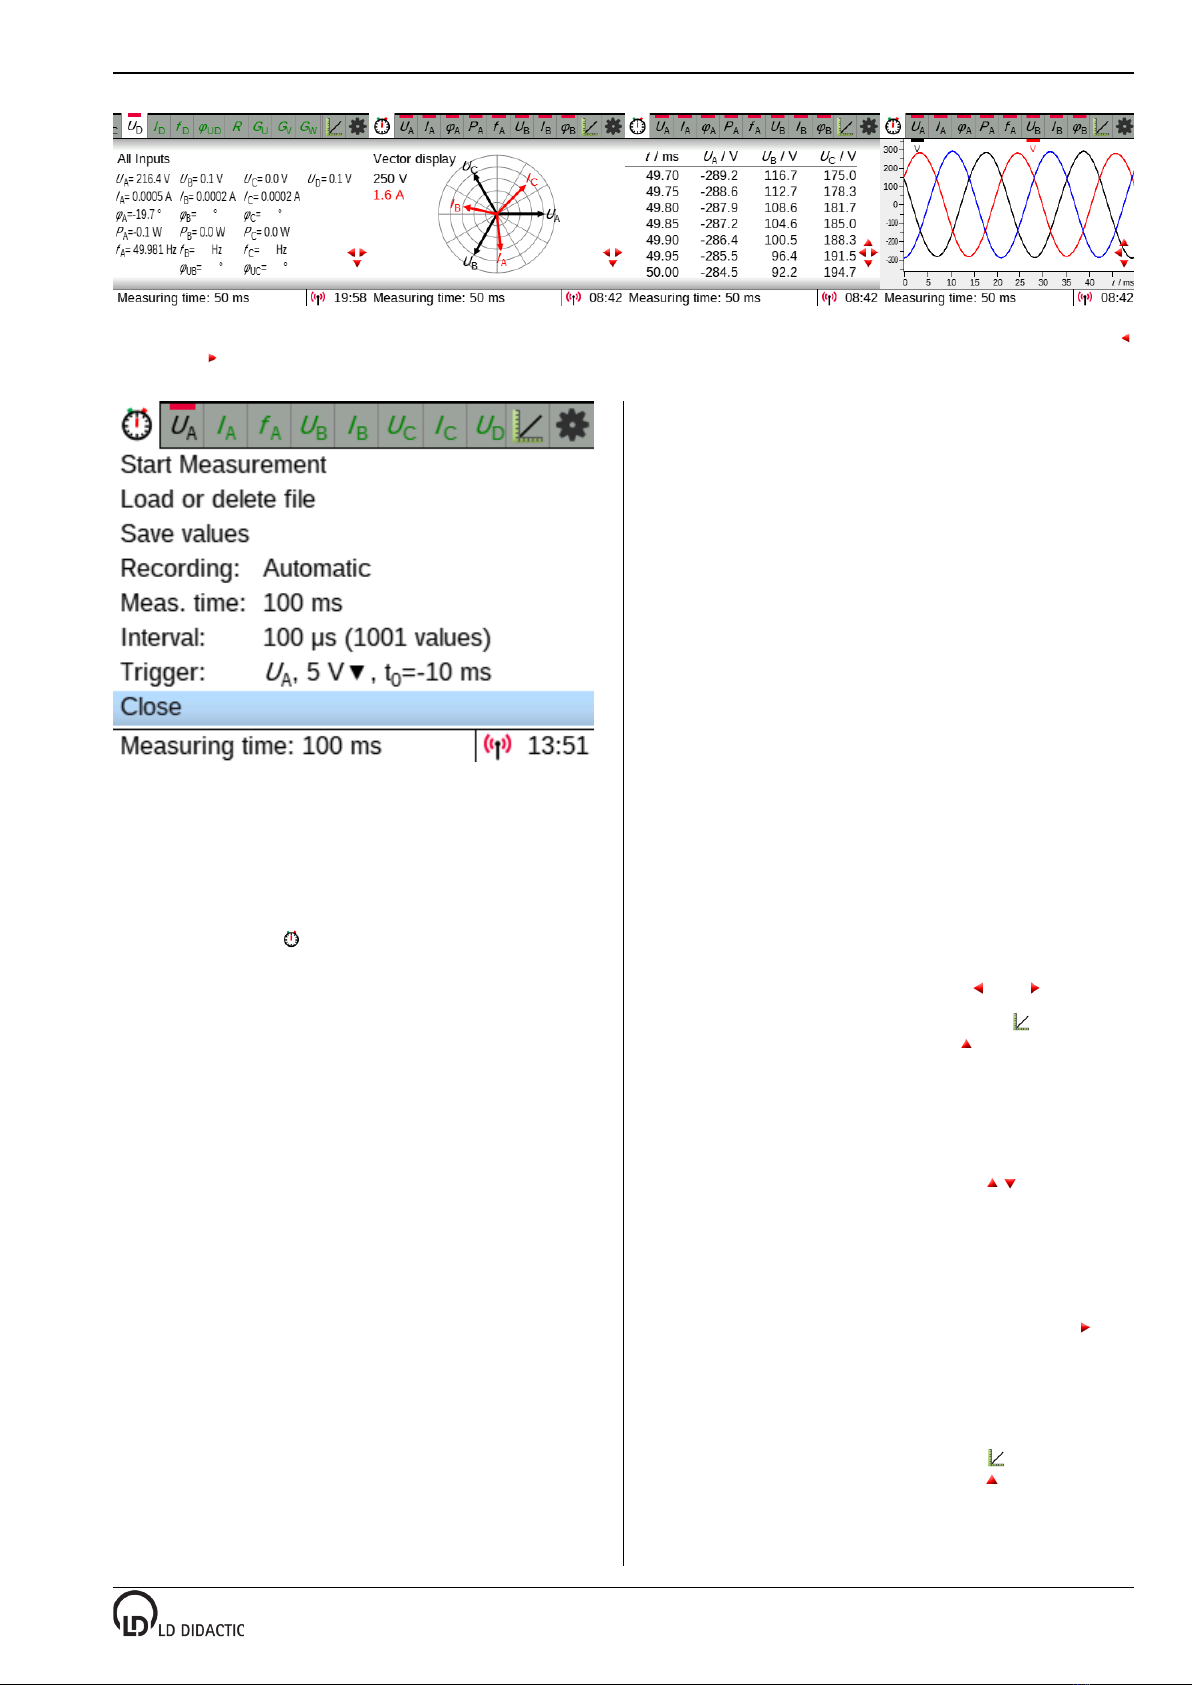
Once a set of measurements has been recorded, it can be
saved via the menu (see fig. 4). The filename specified will
be displayed.
The file can either be saved to a USB memory stick with FAT
formatting or to the internal SD card to the Examples sub-fold-
er (*.labm) or to the Data sub-folder (*.txt). It is only possible to
write to the internal SD card when the Power Analyser ASSY
unit is NOT connected to a computer.
If the Power Analyser ASSY is connected to a computer via
USB, then it is possible to read and write to the SD card from
the computer.
If the file has been saved as *.labm, then besides the measure-
ment data the file also contains all the settings and can be read
by a Power Analyser ASSY 2 again. If the subdirectories ex-
ist for the examples directory, these can be selected in the first
level. Furthermore, using Mobile Edit (see section 9.2) an ex-
periment instruction sheet can be integrated.
If the file has been saved as *.txt, then it can be read using mul-
tiple commonplace programs. The simplest way is to drag and
drop it onto ASSY Lab 2 (see section 9.7) while that software
is running. Even the demo version of ASSY Lab 2 is equipped
for this, meaning that no activation code is required.
7 Meaning of LEDs
The LEDs beside the display indicate various operating states.
Green: Displayed briefly when switching on.
Flashing green: During the course of an actual measurement
(see section 4.6) or a firmware update (see section 10).
Yellow: The internal SD card or an external USB stick is being
accessed.
8 WiFi settings
In order for Power Analyser ASSY to be found more easily in
WiFi, it has a name. The standard name for this is "PA-XXX",
where "XXX" is replaced by the last three numbers of the seri-
al number. This name can be modified with Mobile onfig (see
section 9.1) and is used by Power Analyser ASSY e.g. as the
name of the access point, as the DH P host name and as the
name in the apps (see section 9).
Power Analyser ASSY supports three different WiFi modes:
• Disabled
• Access point as the standard default setting. A different
name for the access point and a password can be en-
tered using Mobile onfig (see section 12.1). The three
operating modes can be distinguished between by the
displayed symbol:
: No connection established to access point.
: A device is connected.
: An app is connected (see section 9).
onnecting to a Power Analyser ASSY access point
is particularly easy: → Show R code → AP data.
However, a terminal then always has connection to ex-
actly one Power Analyser ASSY and usually no more
Internet access.
• lient for connection to a router. The access data of the
router (SSID and password) can be entered using Mo-
bile onfig (see section 9.1). The three operating modes
can be distinguished between by the displayed symbol:
: The connection to the router is being established or
has failed. If a connection to the router has not been sig-
nalled after 30 seconds, check the SSID and password
of the router.
: The connection to the router has been established.
The better the reception is, the more bars displayed.
: An app is connected (see section 9). The better the
reception is, the more bars are displayed.
For security reasons, the Power Analyser ASSY will
not reveal the connection data to the router via a QR
code.
8.1 Server
The Power Analyser ASSY runs several servers, some of
which support multiple simultaneous connections.
Note: These servers provide unencrypted connections, which,
for security reasons, shou d therefore on y be used within a o-
ca network.
TCP server
A T P client, such as the ASSY App (see section 9.6) and
ASSY Lab 2 (see section 9.7), control the measurement
recording of a Power Analyser ASSY and display the results.
Only one connection is possible simultaneously, and only if
there is no USB connection.
HTTP server
For the delivery of the Power Analyser ASSY Web App (see
section 9.4) to a browser, e.g., on a smartphone. In this case,
the Power Analyser ASSY controls the measurement itself.
6 / 14 Instruction sheet 721 100
© by LD DIDA TI GmbH · Leyboldstraße 1 · D-50354 Hürth · www.ld-didactic.com
Tel: +49-2233-604-0 · Fax: +49-2233-604-222 · Email: [email protected] · Technical alterations reserved

WebSocket server
For the distribution of the measured values of the Power
Analyser ASSY to up to three WebSocket clients. A Web-
Socket client is often embedded in a web page, such as Mobile
ontrol or the Power Analyser ASSY Web App (see sections
9.3 and 9.4). Our Lab Docs of the Student Experimental Litera-
ture also include WebSocket clients that allow up to three stu-
dents to collaborate on a Power Analyser ASSY experiment,
using their tablets (see sections 9.5 and 9.6).
To simplify a WebSocket connection, a PIN that can be found
to the left of the or , which can be entered instead of the
IP address or the ASSY name in the address field of a Lab
Doc. This PIN can be modified or disabled in Mobile onfig
(see section 9.1).
To keep track of the number of WebSocket connections, they
are counted to the right of the green or . It counts all con-
nections to the Power Analyser ASSY Web App, to Mobile
ontrol, and to a Lab Doc. When all three connections are es-
tablished, the display of the PIN disappears since no further
connection is possible.
VNC server
A VN client connected to the VN server transmits the screen
content and enables remote control of the Power Analyser
ASSY (see section 9.5). Only one VN client can be used at
a time.
8.2 MAC address
For some networks, the MA address must be specified before
Power Analyser ASSY can connect to the network. There are
different ways to obtain the MA address of a Power Analyser
ASSY:
• Mobile onfig (see section 9.1) displays the MA ad-
dress in the status line when the Power Analyser ASSY
is connected via USB.
• The Power Analyser ASSY Web App (see section 9.4)
shows the MA address in the System menu.
• The Bonjour Discovery App on a smartphone or tablet
displays the MA addresses of all Power Analyser
ASSYs on the same network under the HTTP services
in the form, ASSY-name-XXXXXXXXXXXXX. This is
useful for determining the MA addresses of several
Power Analyser ASSYs at the same time.
9 Additional settings
The settings can be modified in the menu or can be temporarily
or permanently configured using Mobile onfig (see sec-
tion 9.1) on the computer.
9.1 Activate screenshots
If screenshots are activated, these can be made by touching
the OK button for 2 seconds.
A screenshot can either be saved to a USB memory stick with
FAT formatting or to the Screenshots sub-folder on the inter-
nal SD card. It is only possible to write to the internal SD card
when the Power Analyser ASSY unit is NOT connected to a
computer.
A successful screenshot is indicated by an audible signal iden-
tical to a normal key tone. An unsuccessful screenshot (e.g.
when the internal SD card is currently being accessed by a
computer) is indicated by a higher pitched and longer tone.
If a Power Analyser ASSY unit is connected to a computer via
USB, then it is possible to read and write to the SD card from
the computer.
The saved bitmap file (*.bmp) can be read using multiple com-
monplace programs.
9.2 Diagram available
If the diagram is disabled, then with the key you are only
able to toggle to the table. Depending on what the object of the
lesson is, work on the diagram can be postponed until a later
point in time.
9.3 Clock visible
If the clock display is disabled, then there is more space for
evaluation results in the status bar.
9.4 Additional settings
There are some settings which cannot be set using the menu of
Power Analyser ASSY. This includes a welcome screen dur-
ing switch-on, a preset subdirectory for experiment examples,
the name of the Power Analyser ASSY, the WiFi configuration
and default experiments.
Furthermore many individual menu items of the Power
Analyser ASSY can be disabled so that these menu items
can no longer be selected.
These settings can be carried out with Mobile onfig (see sec-
tion 9.1).
10 Apps for Power Analyser CASSY
For those who are not yet satisfied by Power Anaylser
ASSY's features, these can be supplemented using apps.
10.1 Mobile Config (contained in scope of delivery)
Mobile onfig is a tool used by the instructor or the system ad-
ministrator to configure Power Analyser ASSY or to restrict its
functionality (see fig. 6).
The configuration is stored in the hidden configuration file MO-
BILE. FG on Power Analyser ASSY.
A welcome screen, the name of the Power Analyser ASSY,
its WiFi access data, automatic switchover to daylight savings
time and a default experiment can be defined.
In addition to the WiFi access information, this is where you
can change the PIN, which is displayed to the left of the green
or and simplifies the connection to the interactive Lab
Docs. For this purpose, this PIN is transmitted anonymously to
our discovery service, along with the local IP address, where it
is stored for a maximum of one day. If this is not desired, the
PIN can be disabled, thus disabling this service in Mobile on-
fig.
It is also possible to enter values for many existing menu items
or to disable these menu items altogether.
Particularly helpful is the automatic configuration of several
Power Analyser ASSYs with the same configuration file, if the
first option Copy changed configuration to CASSY automat-
ically is selected and the configuration file is copied to a USB
stick. Then all you need to do is briefly insert this USB stick for
the configuration of a Power Analyser ASSY.
Instruction sheet 721 100 7 / 14
© by LD DIDA TI GmbH · Leyboldstraße 1 · D-50354 Hürth · www.ld-didactic.com
Tel: +49-2233-604-0 · Fax: +49-2233-604-222 · Email: [email protected] · Technical alterations reserved

Fig. 6: Mobile onfig configures a Power Analyser ASSY by editing its hidden configuration file MOBILE. FG.
In the default operating state of the Power Analyser ASSY,
Mobile onfig.exe is located on its SD card and can be started
directly from there without any installation as soon as the Pow-
er Analyser ASSY is connected via USB to a Windows com-
puter.
The user interface of Mobile onfig is only available in the Ger-
man and English language. The help texts provide additional
information on how to use Mobile onfig.
Download: https://www.leybold-shop.de/727100
10.2 Mobile Edit (contained in scope of delivery)
Mobile Edit is a tool used by the instructor or author to add ex-
periment descriptions in one or more languages to the mea-
surement files of Power Analyser ASSY (see fig. 7).
In addition to the experiment descriptions, an image and the
name can be specified for each language, under which the ex-
periment example should be displayed in the file selection tree
in Power Analyser ASSY.
In the default operating state of the Power Analyser ASSY,
MobileEdit.exe is located on its SD card and be started directly
from there without any installation as soon as the Power
Analyser ASSY is connected via USB to a Windows comput-
er.
The user interface of Mobile Edit is only available in the Ger-
man and English language. The help texts provide additional
information on how to use Mobile Edit.
Download: https://www.leybold-shop.de/727100
10.3 Mobile Control (contained in scope of delivery)
Mobile ontrol is a tool for teachers who can use it to survey
the measurement data of all student groups. For this purpose,
a WebSocket connection to the selected Power Analyser
ASSYs is established, and thus the group is also displayed
by a small digit to the right of the green . In addition, Mo-
bile ontrol can transfer control settings to all or individual stu-
dent groups in the form of a *.labm file, using the menu or
drag&drop (see fig. 8).
Since Mobile ontrol is a tool for multiple Power Analyser
ASSYs, its use makes sense only in a router infrastructure.
However, this router does not need to have internet access.
The user interface of Mobile ontrol is only available in the
German and English language. The help texts provide addition-
al information on how to use Mobile ontrol.
Download: https://www.leybold-shop.de/727100
10.4 Power Analyser CASSY Web App (contained in
scope of delivery)
The Power Analyser ASSY Web App is a website which is de-
livered by Power Analyser ASSY (see fig. 9). The URL of the
web app can be reached via → Show R Code. The Web
App is useful for having measured values, tables, diagrams,
Fig. 7: Mobile Edit supplements the measurement data by providing
descriptions..
8 / 14 Instruction sheet 721 100
© by LD DIDA TI GmbH · Leyboldstraße 1 · D-50354 Hürth · www.ld-didactic.com
Tel: +49-2233-604-0 · Fax: +49-2233-604-222 · Email: [email protected] · Technical alterations reserved

Fig. 8: Mobile ontrol gives a clear summary of the measurement
data of several Power Analyser ASSYs in the network and
can transfer settings to the various Power Analyser ASSYs.
and evaluations that are displayed by Power Analyser ASSY
displayed by other devices on the same network as well. The
Power Analyser ASSY Web App is only intended for display,
and not for controlling the recording of measured values.
10.5 VNC Viewer (free of charge)
Power Analyser ASSY has an integrated VN server. For
easy use we recommend the VN Viewer from RealVN ,
which is available free of charge for Windows, Linux, OS X, An-
droid and iOS (see fig. 10).
The respective name of the Power Analyser ASSY is to be
entered as the VN server, just as it is specified in menu.
Any blank spaces need to be replaced by hyphens. Alternative-
ly, the IP address indicated in the menu can be entered in-
stead.
Alternatively operation of the Power Analyser ASSY can also
be carried out using the VN Viewer. There is of course no
touch wheel available for operation on the VN Viewer. Instead
equivalent mouse actions can be used (click and drag).
Important note
The default settings of the VN Viewer have to be modified.
VN Viewer: Display all available colours (maximum compres-
sion), as otherwise the colours are displayed incorrectly.
VN Viewer app: Switch picture quality from automatic to high
as otherwise no connection is established.
Fig. 10: A Power Analyser ASSY screen in the window. A VN
Viewer is ideal for presentations on a projector.
10.6 CASSY App (free of charge)
The ASSY App is available for all conventional operating sys-
tems (Android, iOS and Windows). It reproduces the functional
environment of the Power Analyser ASSY on a tablet with the
additional possibility of being able to export measurement val-
ues and diagrams to other apps or to the cloud.
10.7 CASSY Lab 2 (524 220)
Power Analyser ASSY is fully supported by ASSY Lab 2.
If only Power Analyser ASSY files (see section 5) are to be
read, the demo version without activation code suffices.
Download:
https://www.ld-didactic.com/software/cassylab2_en.msi
Fig. 9: In addition, the Power Analyser ASSY Web App displays the measurement data, tables, diagrams, and evaluations of a Power Analyser
ASSY in up to three browsers.
Instruction sheet 721 100 9 / 14
© by LD DIDA TI GmbH · Leyboldstraße 1 · D-50354 Hürth · www.ld-didactic.com
Tel: +49-2233-604-0 · Fax: +49-2233-604-222 · Email: [email protected] · Technical alterations reserved

11 Firmware updates
It is advisable to update the Power Analyser ASSY firmware
from time to time.
There are various ways by which an update can be carried out:
• Download the firmware file FIRMWARE.LD from the in-
ternet, copy it to the Power Analyser ASSY SD card,
then turn the unit off and back on again. When you have
switched it back on, wait for the update procedure to be
carried out, i.e. while the green LED is flashing.
Download: https://www.leybold-shop.de/727100
• Download the firmware file FIRMWARE.LD from the in-
ternet and copy it to the root directory of a FAT-formatted
USB stick. Plug the USB stick into the Power Analyser
ASSY unit, and take it out again once the update pro-
cedure has started (i.e. when the green LED is flashing).
This method is particularly useful if you need to update
the whole set of Power Analyser ASSY units for a
class.
Download: https://www.leybold-shop.de/727100
• Download the current version of ASSY Lab 2 from the
internet and install it. onnect the Power Analyser
ASSY to a computer and carry out the firmware update
from ASSY Lab (this requires a licence for ASSY
Lab 2).
Download:
https://www.ld-didactic.com/software/cassylab2_en.msi
11.1 WiFi update
The WiFi module of the Power Analyser ASSY includes
firmware and the Power Analyser ASSY Web App (see sec-
tion 9.4). Updating this firmware is only possible if Power
Analyser ASSY is connected to the Internet. If a WiFi update
is available, it can be applied via → WiFi update. In order to
offer this option, Power Analyser ASSY automatically down-
loads the version number of the current firmware from the Inter-
net at each start-up and compares it with the installed version.
12 Examples of the connection of the
measuring channels
12.1 Current measurement
I
U
AT III
300 V
A : 700 V / 16 A
D : 1000 V / 25 A
Fig. 11: Measures the current of a channel.
Attention
The connections of current paths should never be inter-
rupted unless the system or the experiment is switched
off. There is a possibility of the formation of arcs in case
of disconnections and short circuits. The safety leads
used must be rated for the expected current value.
12.2 Voltage and frequency measurement
I
U
AT III
300 V
A : 700 V / 16 A
D : 1000 V / 25 A
Fig. 12: Measures the voltage and frequency of a channel.
Attention
The safety leads used must be rated for the expected
voltage value.
10 / 14 Instruction sheet 721 100
© by LD DIDA TI GmbH · Leyboldstraße 1 · D-50354 Hürth · www.ld-didactic.com
Tel: +49-2233-604-0 · Fax: +49-2233-604-222 · Email: [email protected] · Technical alterations reserved

12.3 Phase shift angle between Uand Iof a channel
I
U
AT III
300 V
A : 700 V / 16 A
D : 1000 V / 25 A
Fig. 13: Measures the phase shift angle between Uand Iof a chan-
nel.
The phase shift angle can only be selected if Uand Ihas been
selected in the channel.
Attention
The connections of current paths should never be inter-
rupted unless the system or the experiment is switched
off. There is a possibility of the formation of arcs in case
of disconnections and short circuits. The safety leads
used must be rated for the expected voltage and current
values.
12.4 Effective power
I
U
AT III
300 V
A : 700 V / 16 A
D : 1000 V / 25 A
Fig. 14: Measuring the effective power with voltage and current.
Effective power can only be selected if Uand Ihas been se-
lected in the channel.
Attention
The connections of current paths should never be inter-
rupted unless the system or the experiment is switched
off. There is a possibility of the formation of arcs in case
of disconnections and short circuits. The safety leads
used must be rated for the expected voltage and current
values.
12.5 Phase shift between UAand the voltage UBto UDof
the other channels
I
UA
I
UB
AT III
300 V
A : 700 V / 16 A
D : 1000 V / 25 A
Fig. 15: Measures the phase shift between channel A and another
channel.
The phase shift angle can only be selected if at least the volt-
age UAhas been selected in channel A, and another voltage
UBto UDhas been selected in another channel.
Instruction sheet 721 100 11 / 14
© by LD DIDA TI GmbH · Leyboldstraße 1 · D-50354 Hürth · www.ld-didactic.com
Tel: +49-2233-604-0 · Fax: +49-2233-604-222 · Email: [email protected] · Technical alterations reserved

12.6 3 phase networks with connected star point
I
UA
I
UB
I
U
I
UD
AT III
300 V
A : 700 V / 16 A
D : 1000 V / 25 A
AT III
300 V
A : 700 V / 16 A
D : 1000 V / 25 A
L1
L2
L3
N
Fig. 16: Measurement in 3 phase networks with neutral conductor and
grounded star point.
In this application, only the current IDis active in channel D. It
corresponds to the current in the neutral conductor.
Attention
The connections of current paths should never be inter-
rupted unless the system or the experiment is switched
off. There is a possibility of the formation of arcs in case
of disconnections and short circuits. The safety leads
used must be rated for the expected voltage and current
values.
12.7 3 phase networks with open star point
I
UA
I
UB
I
U
I
UD
AT III
300 V
A : 700 V / 16 A
D : 1000 V / 25 A
AT III
300 V
A : 700 V / 16 A
D : 1000 V / 25 A
L1
L2
L3
N
Fig. 17: Measurement in 3 phase networks with star point without
neutral conductor.
In this application, only the voltage UDis active in channel D,
corresponding to the voltage between the 2 disconnected start
points.
Attention
The connections of current paths should never be inter-
rupted unless the system or the experiment is switched
off. There is a possibility of the formation of arcs in case
of disconnections and short circuits. The safety leads
used must be rated for the expected voltage and current
values.
12 / 14 Instruction sheet 721 100
© by LD DIDA TI GmbH · Leyboldstraße 1 · D-50354 Hürth · www.ld-didactic.com
Tel: +49-2233-604-0 · Fax: +49-2233-604-222 · Email: [email protected] · Technical alterations reserved

12.8 3 phase networks without star point
I
UA
I
UB
I
U
AT III
300 V
A : 700 V / 16 A
D : 1000 V / 25 A
L1
L2
L3
U
V
W
Fig. 18: Measurement in 3 phase networks without star point.
Attention
The connections of current paths should never be inter-
rupted unless the system or the experiment is switched
off. There is a possibility of the formation of arcs in case
of disconnections and short circuits. The safety leads
used must be rated for the expected voltage and current
values.
13 Additional functions of the Power Analyser
CASSY Plus (727 110)
13.1 Isolation amplifier
At the analogue outputs U to X, the signals of the inputs A to
D or calculated signals for the connection of an oscilloscope or
other control devices with a maximum output voltage of ±10 V
are output.
The analogue outputs are permanently assigned to the mea-
suring channels, e.g., channel A to analogue output U. With
the activation of a measuring channel, they become visible as
measurand GUto GXand can then be activated like a measur-
and.
Fig. 19: Activation of the output channels.
Measured signals
The signals Ux,Ix, and Pxof the measuring channel can be
delivered to the output. The gain associated with the measur-
and is displayed as a measured value in the display and in the
menu selection.
The conversion is calculated as UA=UU
GU
=5.75 V
0.025 V/V = 230 V
Fig. 20: Display of the gain in the output menu.
Calculated signals
It is possible to add, subtract, or multiply the signals from adja-
cent channels. With these functions, the gain is displayed as a
measurand as well.
Output + - x
UUA+UB,
IA+IB
UA-UB,
IA-IB
UAxUB,
IAxIB
VUB+U,
IB+I
UB-U,
IB- I
UBxU,
IBxI
WU+UD,
I+ID
U-UD,
I-ID
Ux UD,
IxID
XUD+UA,
ID+IA
UD-UA,
ID-IA
UDxUA,
IDxIA
Tab. 1: Table of possible assignments.
Instruction sheet 721 100 13 / 14
© by LD DIDA TI GmbH · Leyboldstraße 1 · D-50354 Hürth · www.ld-didactic.com
Tel: +49-2233-604-0 · Fax: +49-2233-604-222 · Email: [email protected] · Technical alterations reserved

13.2 Function generator
The function generator output, Y, can only be addressed via
ASSY Lab 2 (see section 9.7).
Functions
The output of the function generator can be actively limited
to the actual measuring time while a measurement is active
(single shot).
The output waveform, frequency f(in Hz), amplitude A(in Vp),
D voltage offset O(in V) and duty factor (in %) can be set in
specific ranges (see Tab. 2).
Negative amplitudes of Aare allowed and mirror the signal
through 0. The duty factor determines the ratio between the ris-
ing and falling wave sections. Thus, e.g. it is easy to convert a
triangular signal (50 %) into a sawtooth signal (100 %).
In addition to the usual waveforms, the ASSY also offers a
user-programmable waveform. To generate this, you need to
enter a formula f(x) that describes that waveform. To determine
the waveform, this function is evaluated in the variable xin the
interval [0,1] and output with the specified frequency f, ampli-
tude Aand offset O. Formula entry is governed by the standard
rules.
The formula input box is relatively small. You can use any stan-
dard text editor to generate longer formulas and then cut and
paste these into the input box (right mouse button).
Fig. 21: Settings in ASSY Lab 2.
Waveform
Frequency range
f
Hz
Amplitude
A
Vp
Offset
O
V=
Duty cycle
τ
Τ
D - - 0 ... ±10 -
Sine 0.01 ... 20.000 0 ... ±10 0 ... ±10 0 ... 100
Square sym. 0.01 ... 20.000 0 ... ±10 0 ... ±10 0 ... 100
Square asym. 0.01 ... 20.000 0 ... ±10 0 ... ±10 0 ... 100
Triangle sym. 0.01 ... 20.000 0 ... ±10 0 ... ±10 0 ... 100
Ramp 0.01 ... 20.000 0 ... ±10 0 ... ±10 0 ... 100
Free function f(x) 0.01 ... 20.000 0 ... ±10 0 ... ±10 -
Tab. 2: Table with setting ranges for the function generator.
14 / 14 Instruction sheet 721 100
© by LD DIDA TI GmbH · Leyboldstraße 1 · D-50354 Hürth · www.ld-didactic.com
Tel: +49-2233-604-0 · Fax: +49-2233-604-222 · Email: [email protected] · Technical alterations reserved
This manual suits for next models
3
Table of contents
Other LD Didactic Measuring Instrument manuals
Popular Measuring Instrument manuals by other brands

red lion
red lion PAX2A user manual

B.M. Tecnologie Industriali
B.M. Tecnologie Industriali TTFM100B-HH-NG instruction manual

Delta OHM
Delta OHM HD2010UC manual

Innovation
Innovation Electro Industries/GaugeTech Shark MP200-S quick start guide

Deltatherm
Deltatherm DTC120-G Quick install guide

A-EON
A-EON Aeotec user guide