Mecasys optizen 2120 uv User manual

User's Guide
July 2012
Mecasys Co., Ltd.

Notice!
Spectrophotometer Optizen® and Software OptizenView™ are
trademarks of Mecasys Co., Ltd.
No part of the Optizen Series, including this publication
may be reproduced, or modied in any form or by any means
without the prior written permission of Mecasys Co., Ltd.
For more detail information on Optizen® and OptizenView™,
you may refer to “Technical Support”
in the last Chapter of this guide or visit our websites below.
http://english.mecasys.co.kr

2
)
Mode Setup
3
)
Measure
(
Step by Step
)
4
)
Flow Chart of Survey Scan Test
5
)
Flow Chart of Survey Scan Mode setup
3. Standard Curve
1
)
Initial Screen Test Mode
2
)
Mode Setup
3
)
Measure with Multi Cell
4
)
Flow Chart of Standard Curve Test
5
)
Flow Chart of Standard Curve Mode setup
4. ABS Ratio
1
)
Initial Screen Test Mode
2
)
Mode Setup
3
)
Measure
4
)
Flow Chart of Simple Kinetic Test/Mode Setup
5. Simple Kinetics
1
)
Initial Screen Test Mode
2
)
Mode Setup
3
)
Measure
4
)
Flow Chart of Simple Kinetics Test
5
)
Flow Chart of Simple Kinetics Test Mode Setup
6. Communication
1. Technical Supports
Part IV. Technical Supports
25
25
26
27
28
28
29
30
33
34
35
35
36
36
37
38
38
38
39
41
42
43
44
Part III. Measuring in Each Test Modes
1. ABS/%T/CONC
1
)
Initial Screen of Test Mode
2
)
Mode Setup
3
)
Measure
(
Step by Step
)
4
)
Flow Chart of ABS/%T/CONC Test
5
)
Flow Chart of ABS/%T/CONC Mode setup
2. Survey Scan
1
)
Initial Screen Test Mode
18
18
19
19
21
22
23
23
Part I. Introduction & General Information
1. Introduction
2. Specifications
3. Constructions
1
)
External Construction
2
)
Cell Holder
4. Accessories
1
)
Micro Volume Cell Holder
2
)
Long Path Cell Holder
Contents
6
7
8
8
9
10
10
11
1. Turning on Switch
2. Key Operation
3. Main Menu
4. Cell Moving Method
5. Utilites
Part II. Functions and Application
12
13
14
14
15

6
7
Part I.
Introduction & General Information
Part I.
Introduction & General Information
Part I. Introduction & General Information
1.
Introduction
Thank you for purchasing UV/VIS Spectrophotometer, Optizen Series.
Optizen Series can be applied various elds from a simple examination like a water quality
analysis to a complex examination like a bio-chemical analysis. User can measure easier,
faster, and more accurate by convenient interface and auto-function.
In addition, user can check and control experimental results on the real time by OptizenView,
PC-Interface software of Optizen Series.
Using Manual
This manual includes the ways of system installation, Optizen operating.
The manual is composed of four parts, which are categorized upon the subjects; therefore,
user can search quickly the necessary parts.
Mecasys Co., Ltd. continuously supports update via mail, internet and e-mail.
1. Introduction
2. Specifications
2. Specications
Wavelength Range 190nm to 1100nm
Spectral Band Pass Width < 1nm
Wavelength Accuracy < ±0.5nm
Wavelength Reproducibility < ±0.1nm
Monochromator
Modied Czerny-turner type with 1200 lines/mm Blazed grating
Stray Light 0.05 %T at 220 &340 nm
Photometric Range -0.1 to 3.0A, 0% to 125%
Photometric Accuracy < 1% of at 1 A
Photometric Reproducibility ± 0.001 A
Noise level < 0.001 A
Drift 0.002A/hr at 340nm
Stability ±0.002 A/hr
Light Source Tungsten-Halogen lamp and Deuterium lamp
Display Mode Backlight. Graphical, liquid crystal display with contrast control
Sample Holder Automatic Rotary Type 8-position multi-cell holder
Interface Ports RS-232 and Centronics ports
Wavelength Slew Rate 5000nm/min
Wavelength Scan Rate 1000nm/min
Standard Capability Software Absorbance/%Transmittance, Concentration and File manager
Local Software
Real-time PC S/W
Automatic multi-cell & multi-wavelength measure
Advanced multi-survey scan
High order standard curves
Time based scan (simple kinetics)
Absorbance ratio
User dened function
Power Requirement 220V, 50/60Hz
Dimensions 514(W)mm X 430(D)mm X 243(H)mm
Weight 16kg (Only Main System)

8
9
Part I.
Introduction & General Information
Part I.
Introduction & General Information
2) Cell Holder
3. Constructions
1) External Construction
3. Constructions
3. Constructions
Main
Top Side
①
Sample Compartment
②
Main Case
③
KEY PAD with LCD
①
Power Switch : Power ON/OFF
②
Fuse
③
AC Power Cable
④
COM 1: Interfacing port for PC
(9 PIN RS-232 CONNECTOR)
⑤
Print (25PIN RS-232 CONNECTOR)
⑥
FAN
Rear Side
1
4
1
6
3
2
3
5
2
10
11
Part I.
Introduction & General Information
Part I.
Introduction & General Information
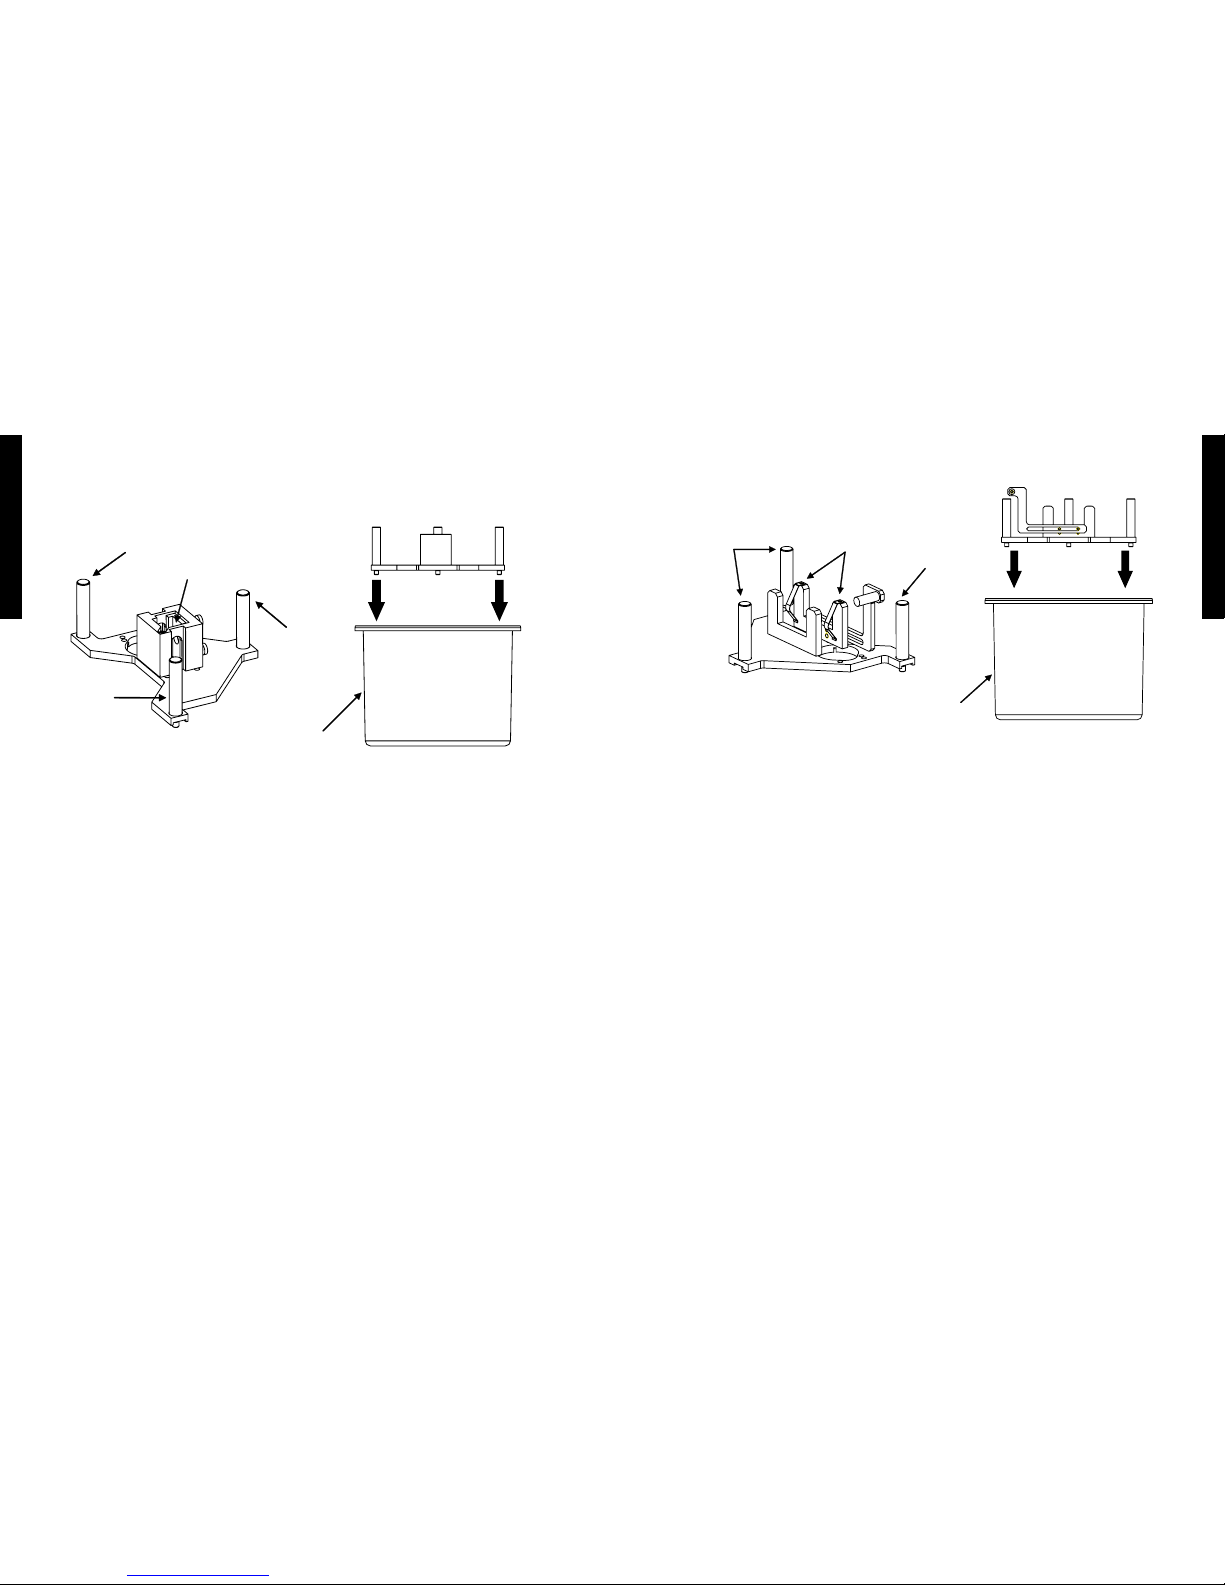
2) Long Path Cell Holder (50mm, 100mm)
Cell Holder Case
Leaf Spring
Screws
Screw
• Installation of the Long path cell holder
1. Align the long path cell holder with cell holder case. (Three screws)
2. Push the long path cell holder to the bottom of cell holder case.
※ A difference of 50mm Path Cell Holder and 100mm Path Cell Holder
1. 50mm Path Cell Holder : 50mm Path Cell Holder has the 50mm Block.
2. 100mm Path Cell Holder : If you measure the 100mm cell, you must remove the 50mm
block rst.
4. Accessories
1) Micro volume cell holder
Cell Holder Case
Micro Volume Cell
Screw
Screw
Screw
• Installation of the Micro volume cell holder
1. Align the micro volume cell holder with cell holder case. (Three screws)
2. Push the micro volume cell holder to the bottom of cell holder case.
※Rotate three adjusting screw to adjust the position Micro volume cell at the Micro volume
cell holder.
4. Accessories
4. Accessories
12
13
Part II.
Functions and Application
Part II.
Functions and Application
Part II. Functions and Application
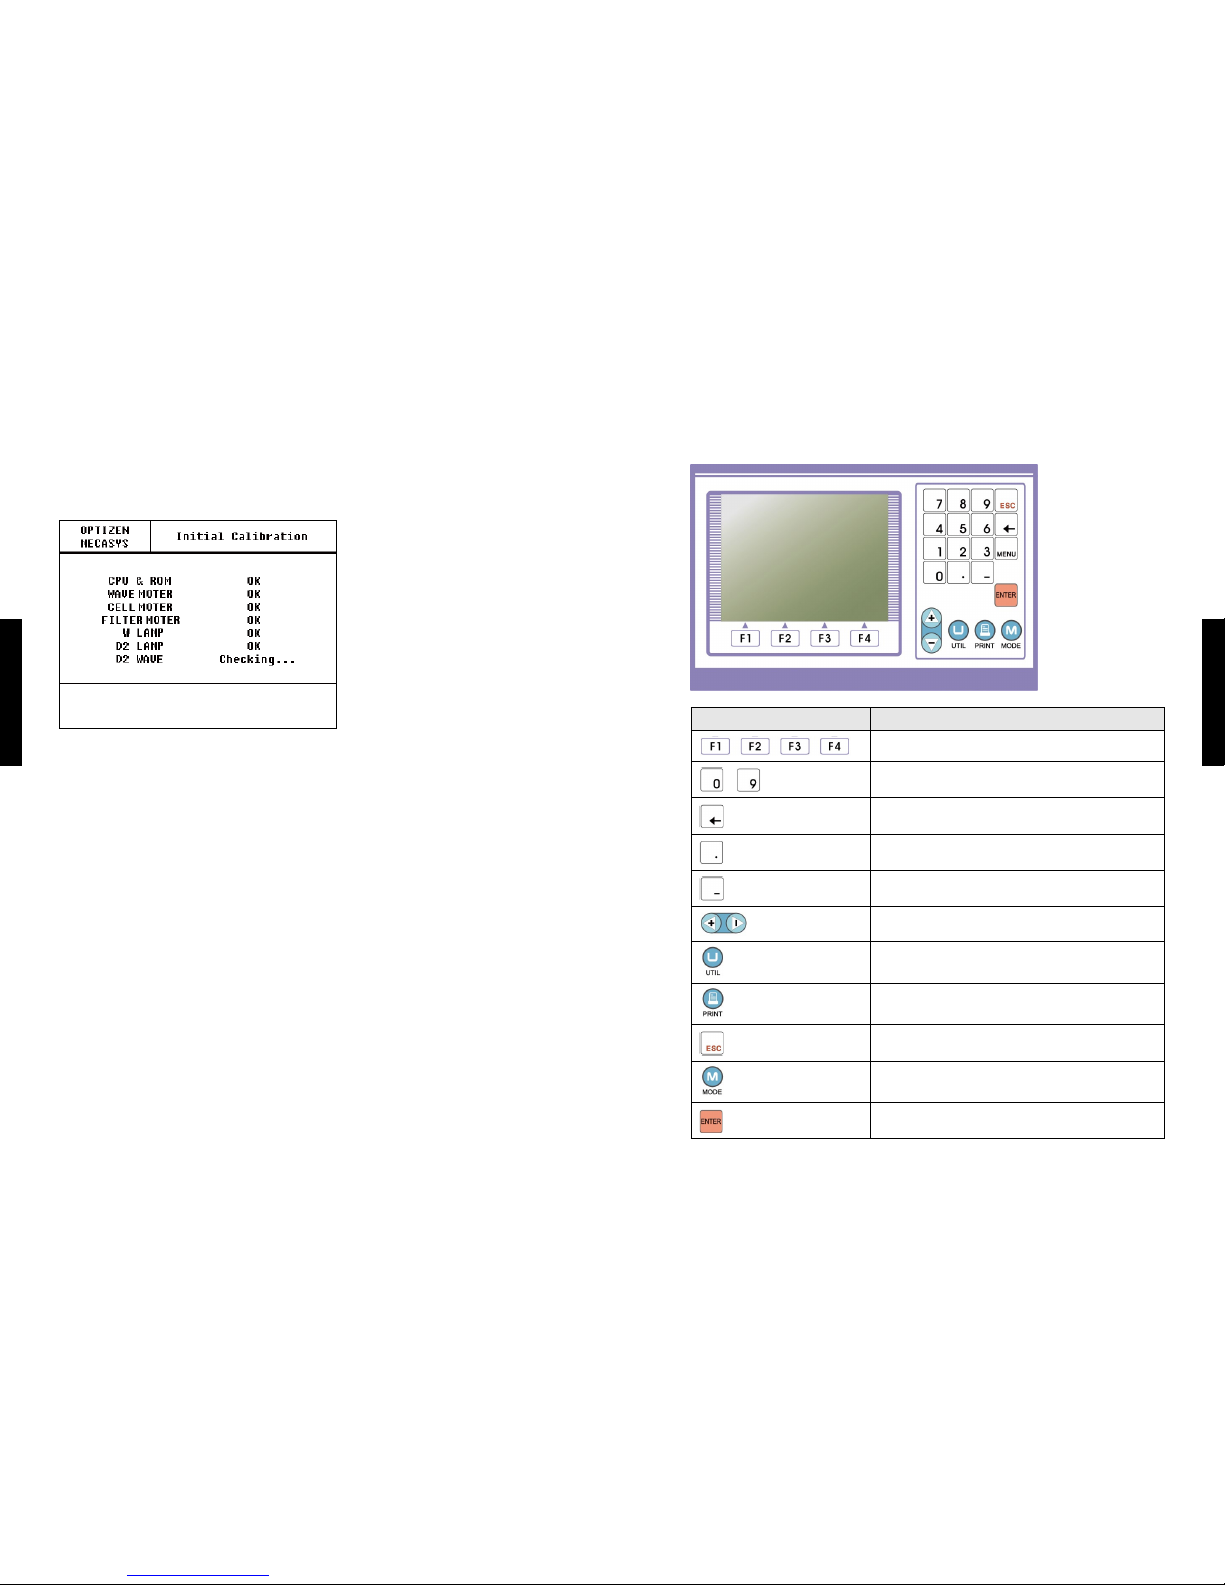
1. Turning on Switch
It is self-tuning about CPU & ROM, Wave Moter, Cell Moter, Filter Moter, W Lamp, D2 Lamp
and D2 Wave. Results of self-tuning indicate Ok or Error. Incase Error occurs at any step,
self-tuning is stopped. If you want to check next step, push [ENTER] button. Only everything
is OK, automatically move to Main Mode.
To get more stable data, please warm up the system about 30 minutes after turning on the
switch.
• CPU & ROM : Check CPU & ROM
• WAVE MOTER : Wavelength motor driving test
• CELL MOTER : Multi-Cell Holder driving test
• FILTER MOTER : Filter driving test
• W LAMP : Check the status of Tungsten-halogen Lamp
• D2 LAMP : Check the status of Deuterium Lamp
• D2 WAVE : Check the status of Deuterium Lamp Wave
2. Key Operation
Key Description
Different Functions in each screen
~ To Log in gures from 0 to 9
To Back Space in Typing
To Insert Dot
To Input Minus
To Move cell location
Set up of Utilities mode
To pr int
To Exit from Mode or To Cancel Input
To Test or To Set up Make Mode
To Conrm the Input, or To Execute
2. Key Operation
1. Turning on Switch

14
15
Part II.
Functions and Application
Part II.
Functions and Application
5. Utilites
You can change setup by selecting number.
1) Cell Mode
You can setup about Cell Mode. Default is Multi cell Mode. If you want to use Single cell
holder, have to change cell mode to Single cell holder.
• Multi Cell Mode : Use 8 hole cell holder.
• Single Cell Mode : Use single Cell Holder.
2) Unit
To change unit, push number 2 then show up 12 concentration unit. After moving with Up/
Down button, conrm with [Enter] button then unit is changed. Default is CONC.
3. MAIN MENU (Selecting Mode)
※ Real time clock function is supported at only 2120UV plus
Move to measuring mode by selecting number key.
To move another mode after measuring one mode, comeback to this ‘Main Menu’ then select
number.
Even though mode is changing, measured data remain without saving until turn off Optizen.
On the upper left side is a title and on the upper right side shows data information, print
status, and the cell position status. The central screen shows the graphs or detail information
on the measured data. The bottom side of screen indicates explanation, command, and the
choice box for function.
4. Cell Moving Method
Cell Holder is designed to hold up to 8 Cells. Each Cell has number “B, 1, 2, 3, 4, 5, 6, 7” and
it is possible to move a cell upward and downward respectively by [UP], [DOWN].
Please keep in mind that the rst cell, “B” is assigned to put Reference Cell.
3. MAIN MENU (Selecting Mode)
5. Utilites

16
17
Part II.
Functions and Application
Part II.
Functions and Application
9) Calibration Mode (Secret Key:’9’)
Optizen has self-correction mode for wavelength and cell holder position. Wavelength
calibration mode checks the 0th order position of grating and the peak wavelength (656.1nm)
of Deuterium lamp.
- wp X : 0th order position
- lp X : # of step per 1nm
- cp : Cell Position
• Wavelength Tuning : Self-correction for wavelength.
• Cell Tuning : Self-correction for cell position.
• Manual Input : Input modied values of calibration parameter.
• Parameter Save : Save modied value.
• Calibratin : Select Calibration Method. (One Point or Two Point)
※ Warning : It is very strongly recommended that ONLY expert or fully trained staff
engineers operate these advanced applications. Fatal errors can be caused by
some incorrect operations.
3) D2 Lamp Save Mode
It automatically turns off the power of the D2 lamp that is not used by selecting number 3.
Incase this mode ‘ON’, D2 Lamp is off at our of wavelength range.
‘Wait a moment’ message is showed up at that time. A few seconds is need.
※The wavelength range of Optizen 2120UV spectrophotometer is from ultraviolet radiation
(190nm) to near infrared radiation (1100nm). For this, deuterium lamp and tungsten-
halogen lamp is used as a light source. Two lamps are changed each other automatically
in 350~470nm range.
4) LCD Contrast Control
It controls brightness level of LCD back light.
5) Lamp Change WL.
You can setup the wavelength for changing point of deuterium lamp and tungsten-halogen
lamp.
The range of the value that you can input is from 350nm to 470nm.
The default value is 370nm.
6) Initial Wavelength
You can set initial wavelength of Optizen. Incase set mainly used wavelength, you don’t need
to set wavelength every measuring time.
7) Clear Lamp Position
Clear Lamp position of W Lamp and D2 Lamp.
8) Set Date & Time (Only 2120UV Plus)
Real time clock function is supported at only 2120UV plus.
5. Utilites
5. Utilites
18
19
Part III.
Measuring in Each Test Modes
Part III.
Measuring in Each Test Modes
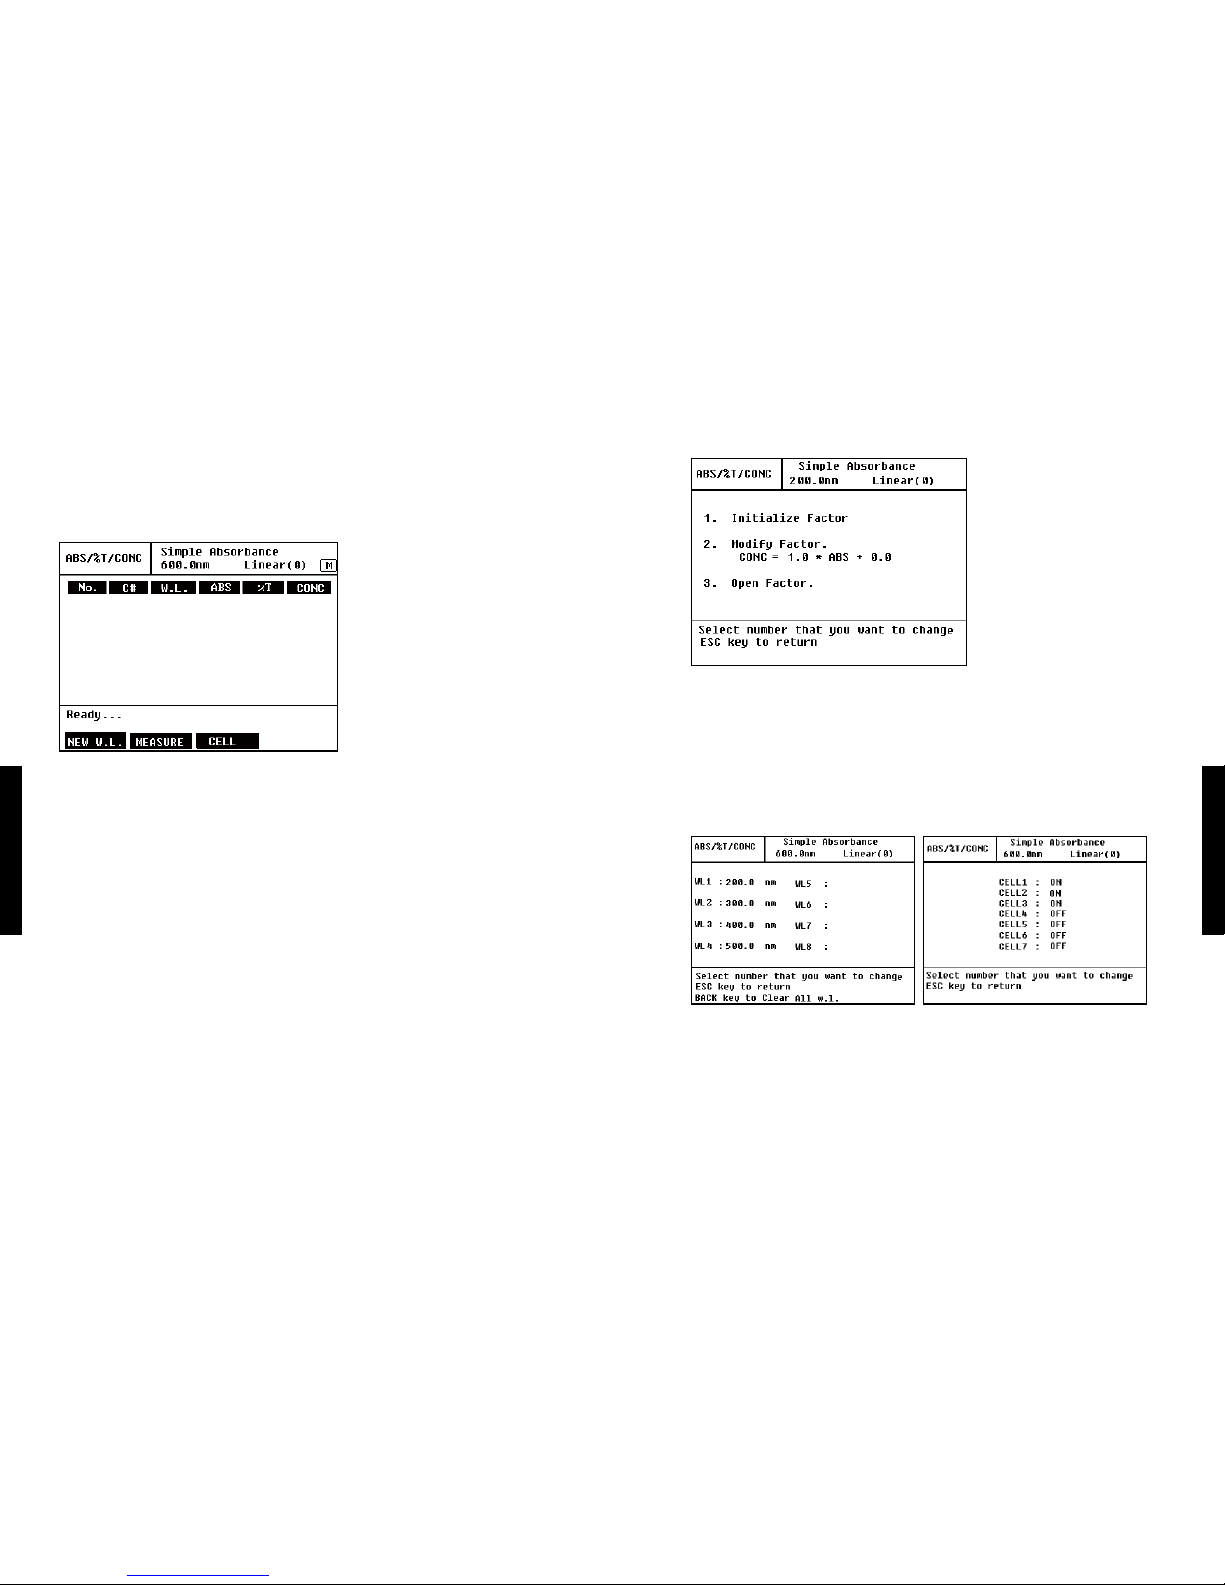
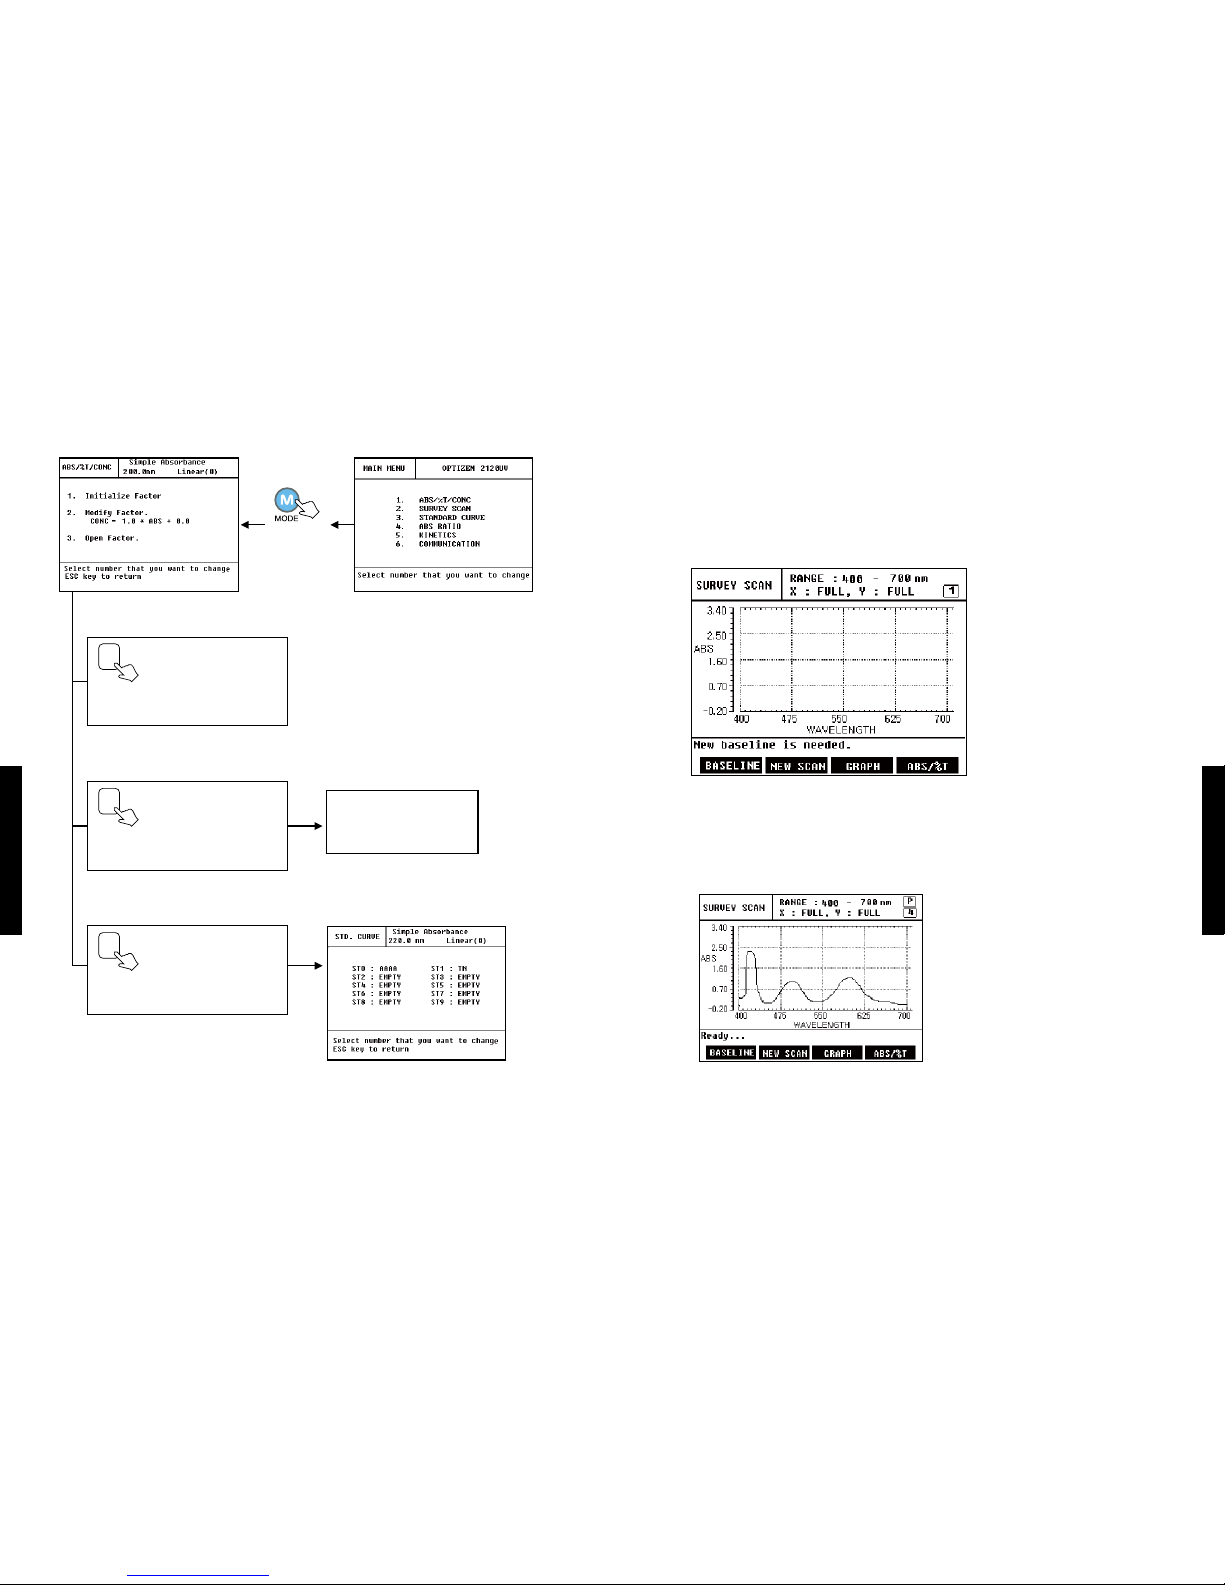
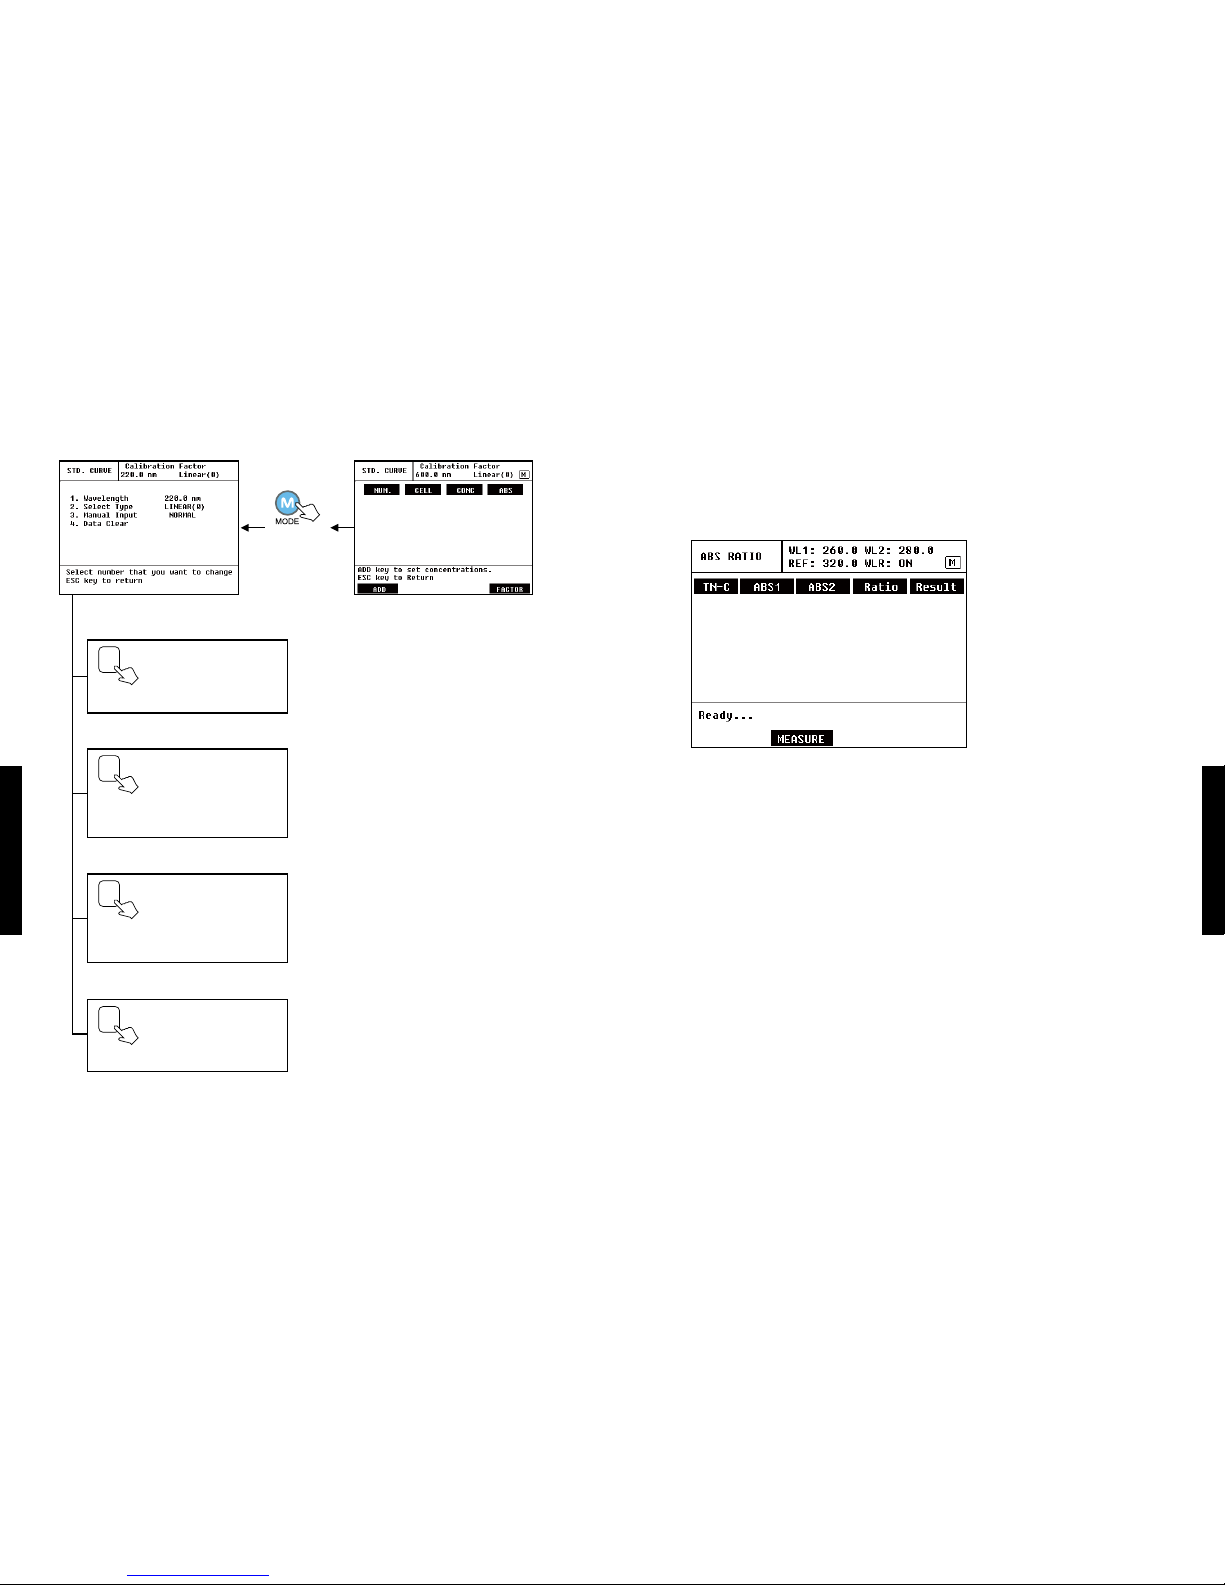
2) Mode Setup
• Initialize Factor : Initialize all factor.
• Modify Factor : Can modify Slope and Intercept.
• Open Factor : Can open saved Factor by selecting number.
Open factor function is generated only saved factor existing.
3) Measure (Step by Step)
• With Multi Cell
1. Incase Push NEW W.L. [F1], you can see the top left side gure then input wavelength.
You can enter by 8 wavelengths.
2. Incase push CELL [F3], show up the top right side gure. You can select the cell to
measure with number key.
3. MEASURE [F2].
Part III. Measuring in Each Test Modes
1. ABS/%T/CONC
1) Initial Screen of Test Mode
The mode assigns the size of Wavelength and the position of a cell, then measures and
marks Absorbance, %Transmittance and Concentration.
<Upper Item>
• NO. : TEST No.
• C# : Cell number of each TEST
• W.L. : Wavelength of each TEST
• ABS : Absorbance of each TEST
• %T : %Transmittance of each TEST
• CONC : Concentration of each TEST
<Bottom Item>
• NEW W.L [F1] : Input wavelength by maximum 8.
• MEASURE [F2] : Start measuring.
• CELL [F3] : Select the cell by ON or OFF cell number.
• DELETE [F4] : After measuring, this function shows up. You can delete all data.
1. ABS/%T/CONC
1. ABS/%T/CONC
20
21
Part III.
Measuring in Each Test Modes
Part III.
Measuring in Each Test Modes
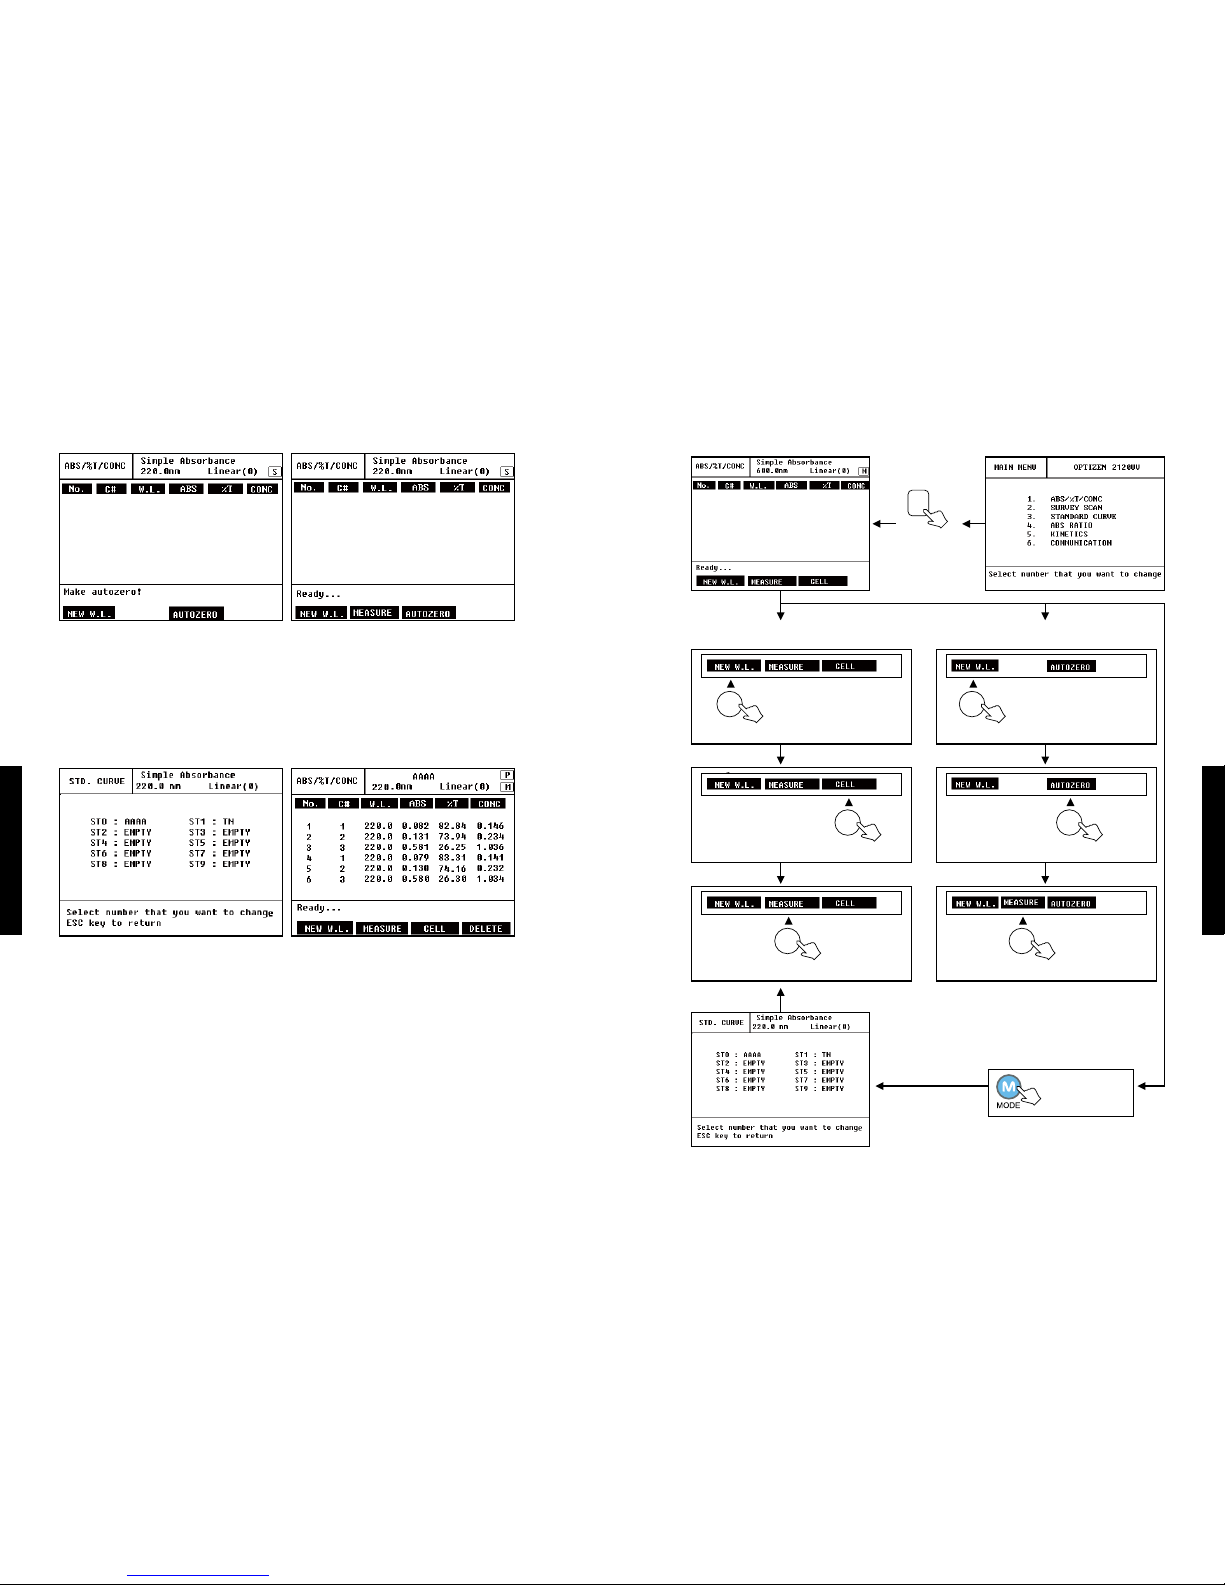
4) Flow Chart of ABS/%T/CONC Test
• With Single Cell
1. Input Wavelength NEW W.L. [F1], at ‘Set new wavelength _ nm’
2. Insert Blank then push AUTOZERO [F3].
3. After measure AUTOZERO [F3], remove Blank then insert sample cell and MEASURE [F2].
You can setup wavelength again or measure AUTOZERO [F3] again.
• With Standard Curve
1. At Mode setup step, you can select and open a saved Standard Curve.
Ex) Incase you want to use Standard Curve AAAA in ST0, input No. 0.
2. Enter the CELL [F3] then select the cell to measure.
3. MEASURE [F2], Measured result is like the top right side gure.
4. Can measure again with MEASURE [F2] and delete all data with DELETE [F4].
1. ABS/%T/CONC
1. ABS/%T/CONC
Move to
Mode Setup
1
Move to
ATC Mode
Input wavelength, [ENTER].
F1
Multi Cell Measure Mode
Measure by Standard Curve
Select the
Open Factor
On/Off the Cell with No. Key.
F3
Measure Absorbance.
F2
Input wavelength, [ENTER].
F1
Single Cell Measure Mode
Insert Blank, AUTOZERO.
F3
Insert Sample then Measure.
F2
22
23
Part III.
Measuring in Each Test Modes
Part III.
Measuring in Each Test Modes
2. Survey Scan
1) Initial Screen of Test Mode
At this mode, you can survey scan about a sample in selected wavelength range. You can
see Absorbance or Transmittance data with Graph or Table.
At the Survey Scan Mode screen, you will nd 'New baseline is needed' command.
BASELINE is like a Blank of ATC Mode. You must measure BASELINE [F1] rst.
<Main Screen>
• Baseline [F1] : On the process of Baseline Scanning, its status is indicated by '%'. When
the Baseline Scan is over, the 'READY' sign will come up.
• New Scan [F2]
Select the cell you intend to measure and
push NEW SCAN [F2] button, then it will scan
the wavelength selected in each cell.
While survey scan, you can see Absorbance
or %Transmittance as wavelength on the
upper side of screen. The middle part of
screen will indicate real time graphs.
If the scanning is over, the graphs, which are
automatically readjusted to the output range
of Y, will be drawn promptly. Based upon this
data, all the gures for graphs and texts of
Survey Scan Mode will be determined.
5) Flow Chart of ABS/%T/CONC Mode Setup
1. ABS/%T/CONC
2. Survey Scan
Move to
Mode Setup.
Initialize Factor
Initializing all factor.
(Slope: 1.0, y-Intercept: 0.0)
1
Open saved Standard Curve.
3
Open Factor
Set slope : _
Set Y-intersection : _
Modify Factor
Modify slope and y-Intercept of
Graph.
2

24
25
Part III.
Measuring in Each Test Modes
Part III.
Measuring in Each Test Modes
• ABS / %T [F4]
It is a Toggle Switch which decides whether to view the data in Absorbance or in
%Transmittance. The range of wavelength is maintained during toggling.
2) Mode Setup
• Start Wavelength : Input start wavelength to survey scan. Default value is 400.0 nm.
• Finish Wavelength : Input nish wavelength to survey scan. Default value is 700.0 nm.
Input wavelength at ‘Set new wavelength _ nm’ with number key.
3) Measure step by step
1. Setup wavelength to measure at Mode setup step.
2. Select the cell to measure with Up/Down button.
3. Measure Base Line [F1].
4. Measure New Scan [F2].
5. Conrm data with Graph, Abs/%T.
• GRAPH [F3]
X-ZOOM [F1]
In order to look into graphs in details, you can
select the range of wavelength. The modied
graphs by this mode will be kept.
- MIN X [F2] :
Input the minimum wavelength to
zoom.
- MAX X [F3] :
Input the maximum wavelength to
zoom.
- RECALL [F4] : Initialize shape of graph.
Y-ZOOM [F2]
You can see y-axis of the graph in detail.
CURSOR [F3]
At this mode, you can search Absorbance
and %Transmittance of each wavelength step
by step.
Wavelength, Absorbance and %Trans-
mittance will be indicated like the left side
gure.
<<-- [F1], -->>[F4] is a key to search Peaks
and Valleys values only. With <- [F2],
->[F3] key can move by 1 nm and show the
respective data.
TABLE [F4]
You can see data by table that indicates
Peaks, Valleys, wavelength, ABS, %T.
2. Survey Scan
2. Survey Scan

26
27
Part III.
Measuring in Each Test Modes
Part III.
Measuring in Each Test Modes
4) Flow Chart of Survey Scan Test
2. Survey Scan
2. Survey Scan
5) Flow Chart of Survey Scan Mode Setup
2
Move to Survey
Scan Test Mode
Scan Baseline.
F1
Measurement with Multi cell
Start Measuring.
F2
Conrm data with
X-ZOOM, Y-ZOOM, CURSOR, and TABLE.
F3
Insert Blank, Scan Baseline.
F1
Measurement with Single cell
Conrm measured data
with ABS or %T
F4
ABS/%T Toggle Mode
Select the Cell with
Up/Down.
UP DOWN
Remove Blank, Insert sample then start
New Scan.
F2
Move to
Mode Setup.
Start Wavelength
Set new wavelength _ nm
Input wavelength, [Enter].
1
Finish Wavelength
Set new wavelength _ nm
Input wavelength, [Enter].
2
28
29
Part III.
Measuring in Each Test Modes
Part III.
Measuring in Each Test Modes
• GRAPH [F3]
After measuring, GRAPH [F3] button
shows up. You can see standard curve
graph.
• FACTOR [F4] : You can open, modify or delete saved factor.
※At ABS/%T/CONC mode, you can get concentration of samples using a saved standard
curve. Open standard curve name is indicated at upper side of screen.
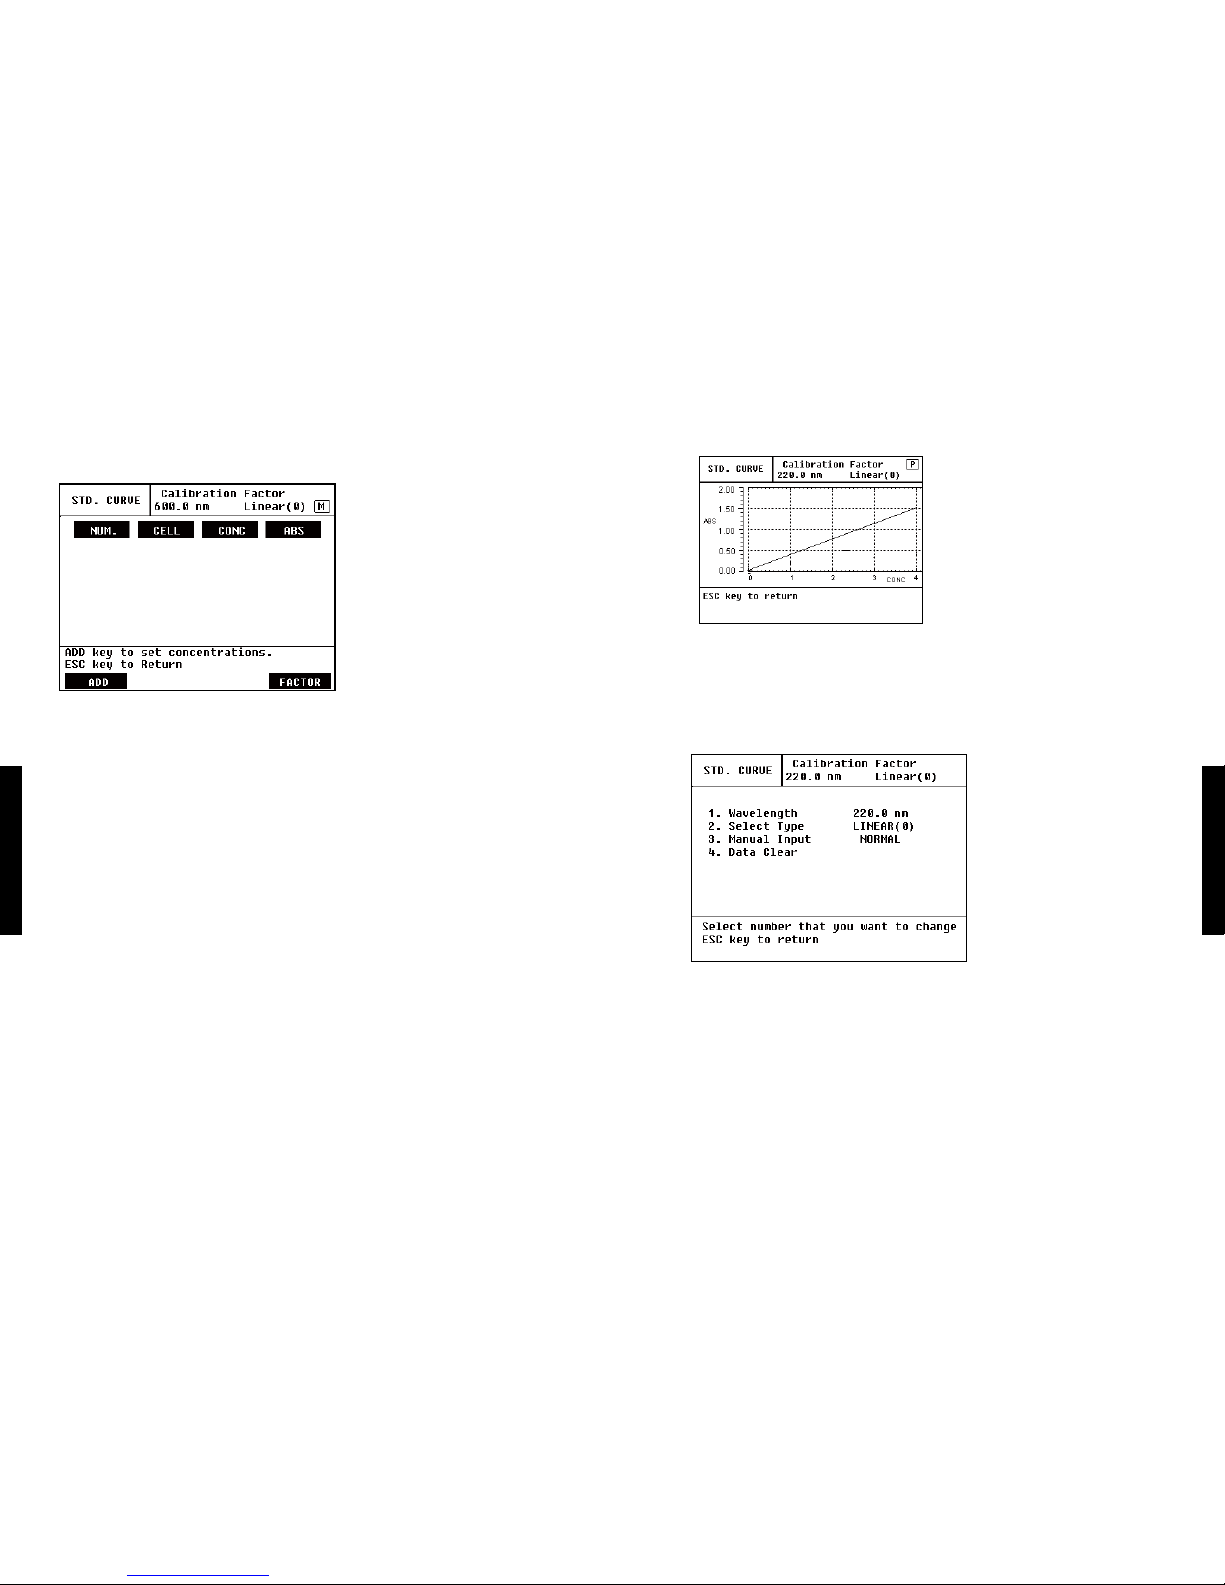
2) Mode Setup
• Wavelength : Setup wavelength to measure. Incase select number 1, the message of ‘Set
new wavelength _ nm’ shows up. Here input wavelength with number key
then [ENTER].
• Select Type : Select the type of Standard Curve you plan to make. There are three kinds of
Curve type.
- Linear(0) Standard Curve : Linear type that passes zero point
- Linear(N) Standard Curve : General linear type
- Segmented Standard Curve : A Type of graphs that links certain points.
3. Standard Curve
3. Standard Curve
3. Standard Curve
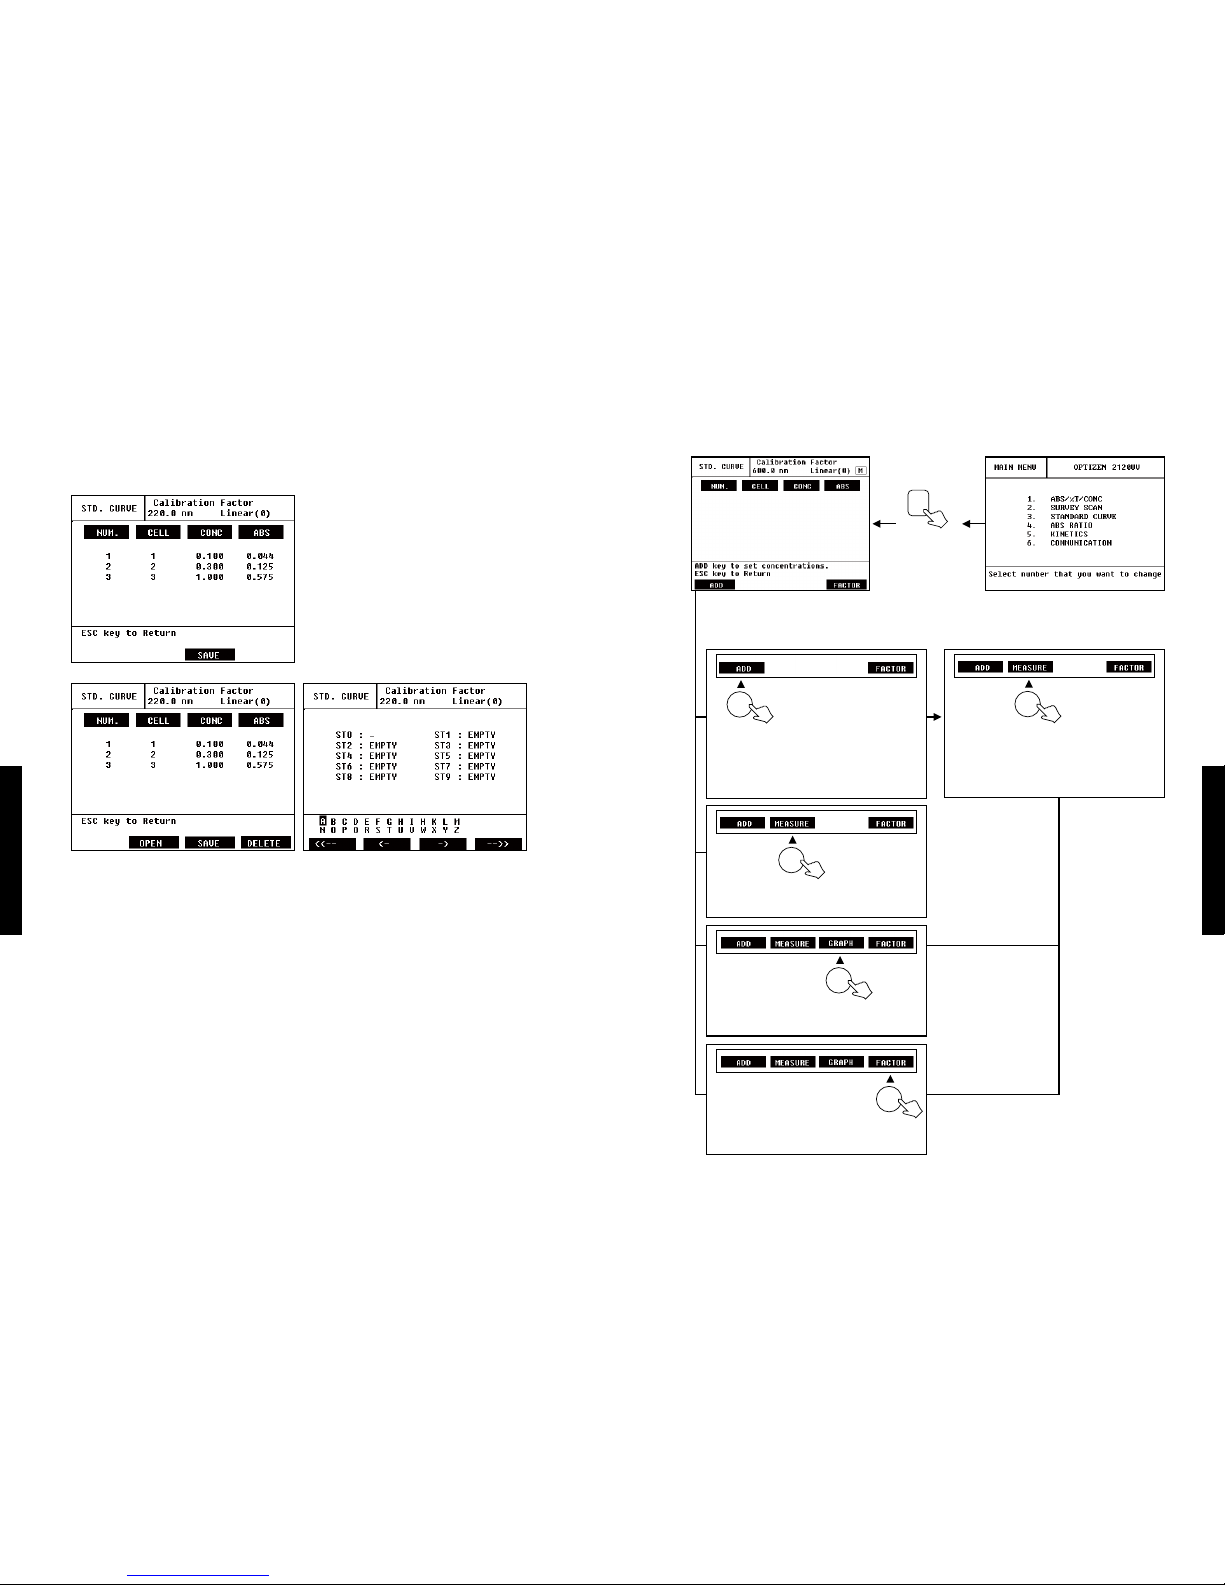
1) Initial Screen of Test Mode
At initial screen, you can see only ADD [F1], FACTOR [F4]. To make a standard curve, select
ADD [F1] and input concentration. Then MEASURE [F2] will appear. With FACTOR [F4] you
can add data at saved standard curve. You can also FACTOR OPEN or DELETE.
At this mode you can make a standard curve with standard solution. You can save standard
curve by ten.
<Upper side Item>
•NUM. : TEST No.
• CELL : CELL No. of each TEST
• CONC : Concentration of standard solution
• ABS : Absorbance of each standard solution
<Bottom side Item>
• ADD [F1] : Select ADD [F1] and input Concentration value.
You can input up to 7 concentrations consecutively.
To make standard curve, you have to measure minimum 2~3 standard solutions.
• MEASURE [F2] : Measure concentration of standard solution. After measuring, you can
add another concentration by ADD [F1] and measure again by MEASURE
[F2].
30
31
Part III.
Measuring in Each Test Modes
Part III.
Measuring in Each Test Modes
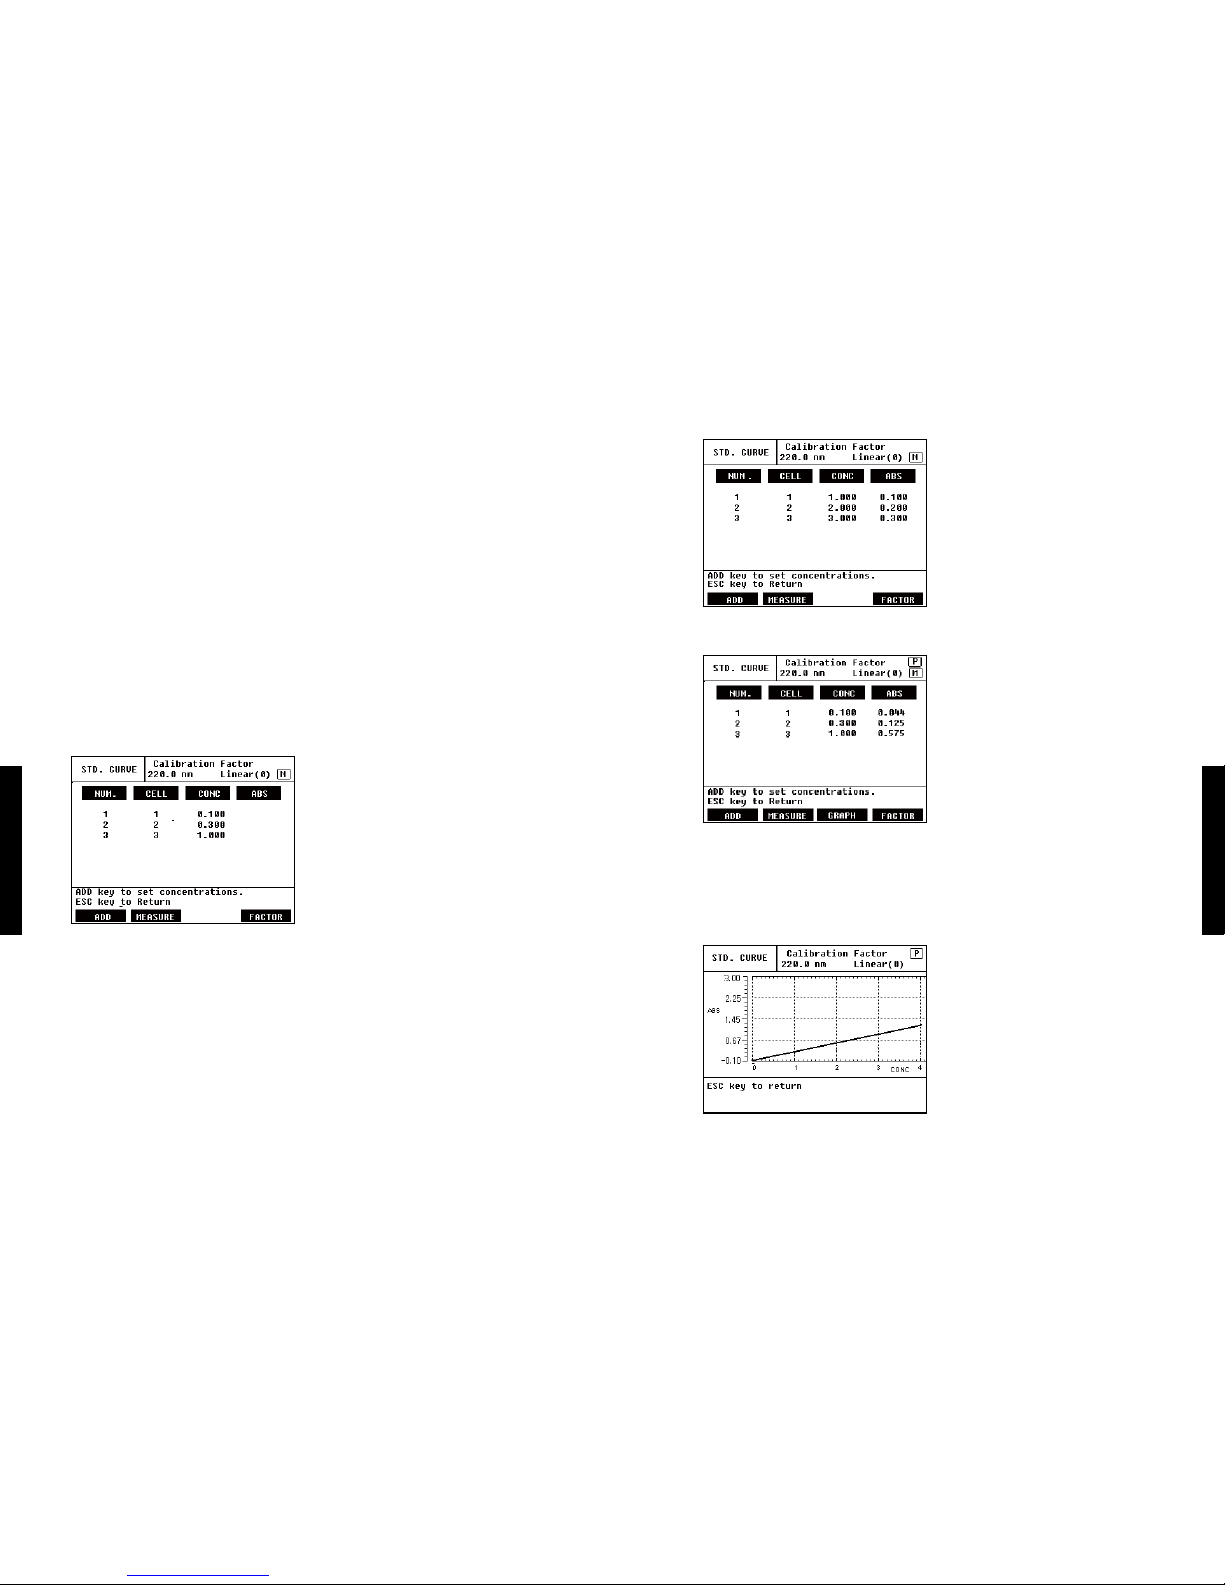
3. Measure concentration of each cell with MEASURE [F2].
Results show up like the bottom gure.
※Single cell Mode : After measuring Reference then insert standard solution and measure
in order.
※After measuring, can add concentration with ADD [F1].
4. You can conrm measured data with GRAPH [F3].
Graph type is selected at Mode setup.
•Manual Input
- NORMAL :
Incase make a standard curve by measuring concentration of standard solutions.
- INPUT : By inputting Concentration and Absorbance by maximum 30, you can make
Standard Curve. After inputting, you can make standard curve automatically by
clicking MEASURE [F2] in Test Mode.
• Data Clear : Incase select the [Data Clear], you can see the message ‘Warning!! All data
will be lost. Press [ENTER] to Conrm.’ then all data is deleted.
3) Measure with Multi cell
1. Setup wavelength and graph type at Mode Setup step.
2. Select ADD [F1] at initial screen of standard mode then input concentration of standard
solution in order.
You can add by 7 concentrations. After adding over 2, then shows up MEASURE [F2] key.
※ Incase select Input mode
Select ADD [F1] then ‘Set concentration: _’ shows up. Here input concentration then [ENTER].
After that, the message of ‘Set absorbance: _’ shows up then input absorbance. Conrm
with [ENTER]. Repeat as number of samples.
3. Standard Curve
3. Standard Curve
32
33
Part III.
Measuring in Each Test Modes
Part III.
Measuring in Each Test Modes
4) Flow Chart of Standard Curve Test5. After measuring, select FACTOR [F4] then SAVE [F3] shows up like the bottom gure.
You can save standard curve by 10. Also you can open saved standard curve with [OPEN]
button. By selecting the number you can delete save standard curve.
6. If you want to delete measured data, select data clear at Mode setup step.
3. Standard Curve
3. Standard Curve
3
Move to
STC Mode
Measure with multi cell
Standard solutions are measured as input
order.
F2
You can conrm measured data with
graph.
F3
You can save or conrm made standard
curve.
F4
1. Insert Reference cell then measure.
2. Insert sample cell then measure in
order.
F2
Measure with single cell
Input concentration of standard solutions
in order.
※At input mode, input concentration
and absorbance.
F1
34
35
Part III.
Measuring in Each Test Modes
Part III.
Measuring in Each Test Modes
5) Flow Chart of Standard Curve Mode Setup 4. ABS Ratio
User input Factor and Wavelength at mode setup step then ABS Ratio is measured and
calculated automatically. The ratio means A260nm/A280nm.
1) Test Mode initial screen
It automatically calculates the ratio per 2 or 3 Wavelengths.
Start the measurement by clicking MEASURE [F2] in the beginning. Prior to measurement,
please input the Wavelength, Cell Number and Factor at the Mode Setup.
You can measure maximum 7 samples.
※More time is needed compare with other mode, because measure at 2~3 wavelength
about one sample.
<Upper side Item>
• TN-C : TN means total measuring times, C means Cell number.
• ABS1 : Measured absorbance at Wavelength 1 (260nm).
• ABS2 : Measured absorbance at Wavelength 2 (280nm).
• RATIO : The ratio ABS 1and ABS 2
• RESULT : Ratio result considered factor Ratio. Incase no factor; it’s a same value with ratio
column.
3. Standard Curve
4. ABS Ratio
Move to
Mode Setup.
Wavelength
Input wavelength to measure, [Enter]
1
Select Type
Select the curve type with number 2
key then conrm with [Enter]
2
Manual Input
Select whether measuring or inputting
absorbance with number 3.
3
Data Clear
Delete all measured data.
4
36
37
Part III.
Measuring in Each Test Modes
Part III.
Measuring in Each Test Modes
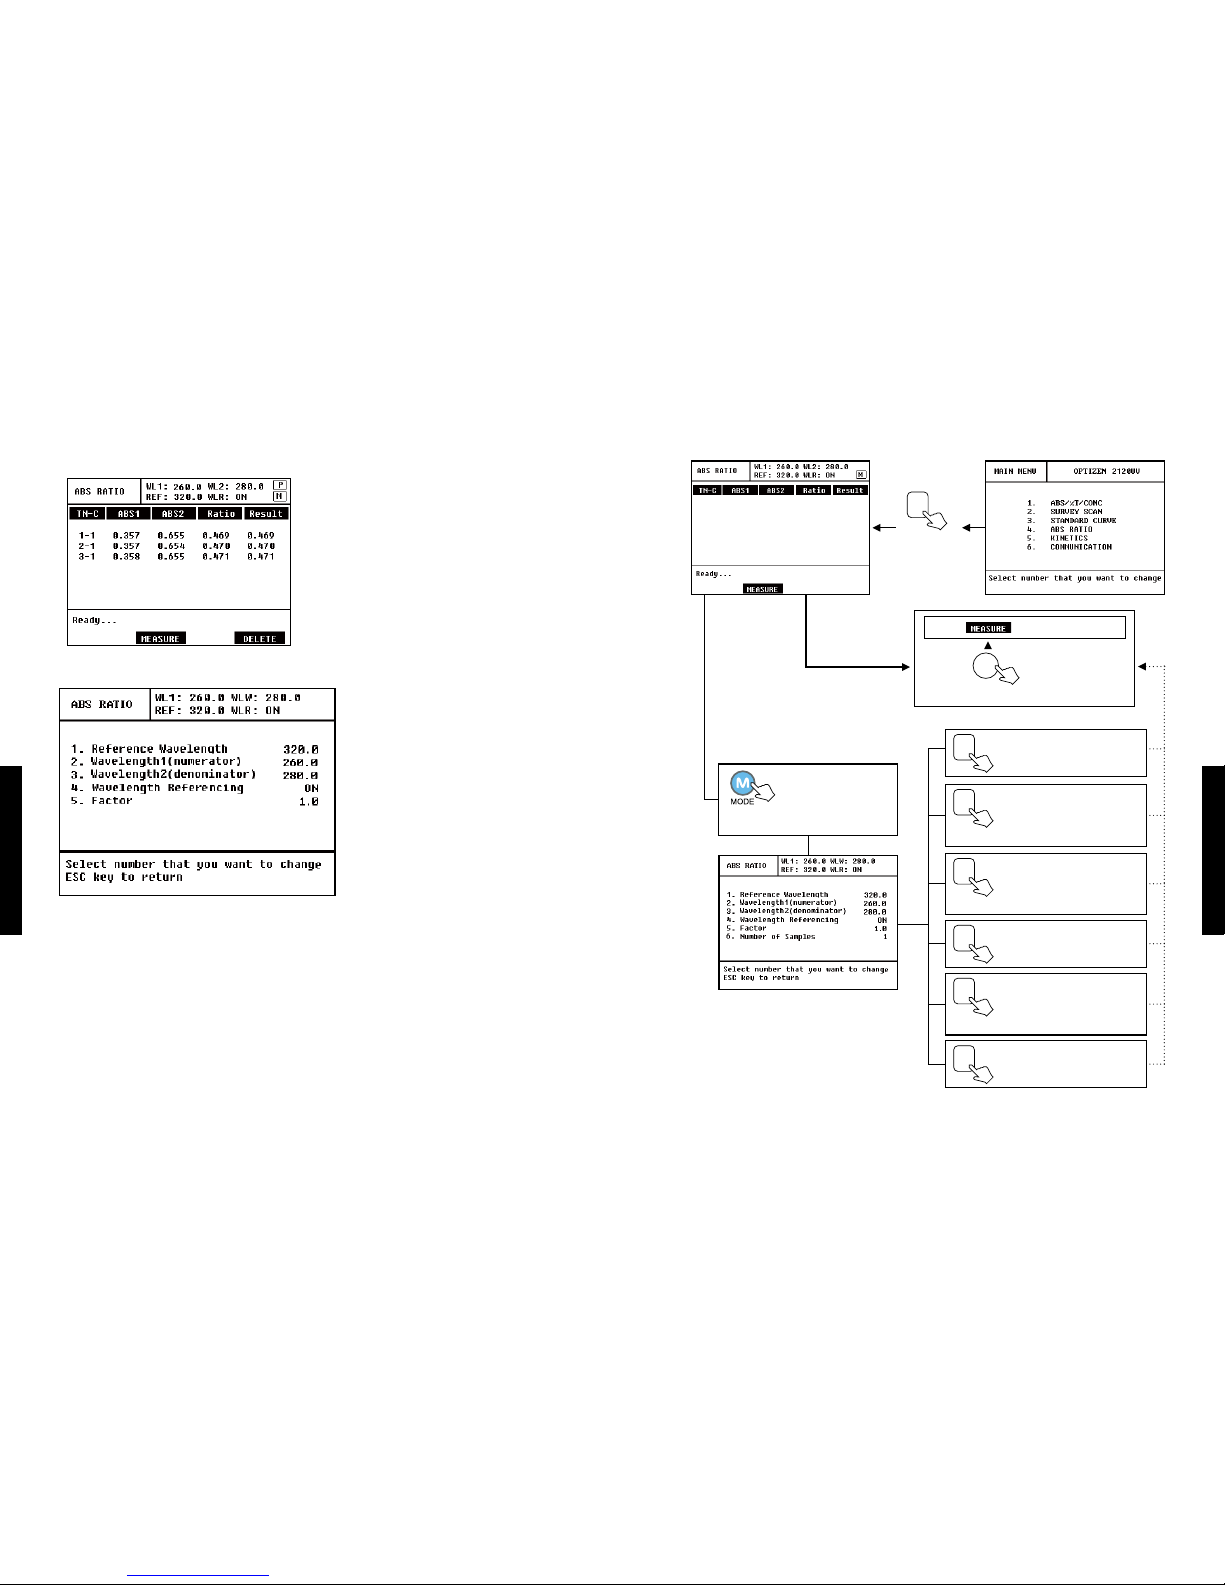
4) Flow Chart of ABS Ratio Test/ Mode Setup<Bottom Item>
• MEASURE [F2]
Measure using input the Wavelength, Cell
Number and Factor at the Mode Setup.
The result is indicated like the left side gure.
2) Mode Setup
• Reference Wavelength : Wavelength that will measure Reference, and default is 320nm.
• Wavelength 1 (numerator) : Wavelength that will measure the numerator value of ratio.
Default is 260nm.
• Wavelength 2 (denominator) : Wavelength that will measure the denominator value of
ratio. Default is 280nm.
• Wavelength Referencing : Select whether measure or not Reference.
• Factor : Factor that will be multiplied by Ratio.
3) Measure
You can measure with Measure [F2] button after mode setup.
4. ABS Ratio
4. ABS Ratio
4
Move to ABS
ratio mode.
Start measuring after mode setup.
F2
Mode Setup
Move to Mode Setup.
Input Reference
wavelength then [ENTER].
1
Input factor that will be
multiplied by Ratio then
[ENTER]
5
Select whether measure or
not Reference.
4
Input wavelength to
measure the denominator
ratio [ENTER].
3
Input wavelength to
measure the numerator of
ratio then [ENTER].
2
Number of samples to
measure.
6
Measurement

38
39
Part III.
Measuring in Each Test Modes
Part III.
Measuring in Each Test Modes
5. Simple Kinetics
1) Test Mode Screen
At this mode, you can measure continuously absorbance variation at a wavelength during a
certain period of time.
2) Mode Setup
• Wavelength : Input wavelength to measure. Default Wavelength value is 600nm.
• Total Scan Time : Input total scan time. Default duration
• Interval Time : Input interval time to measure. But, Interval time must longer than Total
Scan Time/241.
3) Measure
After Mode Setup, start measuring with MEASURE [F2].
You can see progressing result with absorbance as time variation.
After measuring,MEASURE [F2], GRAPH [F3],
ABS/% [F4] button show up like the left side
gure.
• MEASURE [F2]
You can measure again.
• GRAPH [F3]
X-ZOOM [F1]
In order to look into graphs in details, you can
select the range of wavelength. The modied
graphs by this mode will be kept.
- MIN X [F2] :
I n p u t t h e m i n i m u m v a l u e o f X - a x i s
to zoom.
- MAX X [F3] :
Input the maximum value of X-axis
to zoom.
- RECALL [F4] : Initialize graph.
Y-ZOOM [F2]
Indicate the graph in detail.
5. Simple Kinetics
5. Simple Kinetics
Table of contents
Popular Laboratory Equipment manuals by other brands


WILKINS
WILKINS ZW209 Installation, Troubleshooting, Maintenance Instructions

Labnet
Labnet VorTemp 1550 instruction manual

Spicer Consulting
Spicer Consulting SC22 Product guide

ZINEXTS
ZINEXTS ZiXpress 32 Dx system instruction manual

CommScope
CommScope MR050B Series user manual

Pentair
Pentair BIOSHIELD Installation and user guide