MULTILANE AT4025 User manual

AT4025 Digital Sampling Oscilloscope GUI User Manual
AT4025 GUI User Manual-rev1.4 (GB 20210405a)
April 2021
4-Lane Electrical Scope | High Sensitivity | Supports 400GAUI PAM4 Transmitter Qualification

2
Notices
Copyright © MultiLane Inc. All rights reserved. Licensed
software products are owned by MultiLane Inc. or its
suppliers and are protected by United States copyright
laws and international treaty provisions.
Use, duplication, or disclosure by the Government is
subject to restrictions as set forth in subparagraph (c)(1)(ii)
of the Rights in Technical Data and Computer Software
clause at DFARS 252.227-7013, or subparagraphs (c)(1)
and (2) of the Commercial Computer Software -- Restricted
Rights clause at FAR 52.227-19, as applicable.
MultiLane Inc. products are covered by U.S. and foreign
patents, issued and pending. Information in this
publication supersedes that in all previously published
material. Specifications and price change privileges
reserved.
General Safety Summary
Review the following safety precautions to avoid injury
and prevent damage to this product or any products
connected to it. To avoid potential hazards, use this
product only as specified.
Only qualified personnel should perform service
procedures.
While using this product, you may need to access other
parts of the system. Read the General Safety Summary in
other system manuals for warnings and cautions related to
operating the system.
To Avoid Fire or Personal Injury
Use Proper Power Cord. Only use the power cord specified
for this product and certified for the country of use.
Observe All Terminal Ratings. To avoid fire or shock
hazard, observe all ratings and markings on the product.
Consult the product manual for further ratings information
before making connections to the product.
Do not apply a potential to any terminal, including the
common terminal that exceeds the maximum rating of that
terminal.
Do Not Operate Without Covers.
Do not operate this product with covers or panels removed.
Avoid Exposed Circuitry. Do not touch exposed
connections and components when power is present.
Do Not Operate with Suspected Failures.
If you suspect there is damage to this product, have it
inspected by qualified service personnel.
Do Not Operate in Wet/Damp Conditions. Do Not Operate
in an Explosive Atmosphere. Keep Product Surfaces Clean
and Dry
Caution statements identify conditions or
practices that could result in damage to this product or
other property.

3
CONTENTS
CONTENTS........................................................................................................................ 3
INTRODUCTION ................................................................................................................ 4
API and SmarTest Documents...................................................................................................4
Product Software.....................................................................................................................5
Minimum PC Requirements ..........................................................................................................................5
Installation....................................................................................................................... 6
System Start-up .......................................................................................................................6
DSO GUI Overview...................................................................................................................7
DSO Configuration ...................................................................................................................9
Connection Configuration .............................................................................................................................9
External Clock Operation ..............................................................................................................................9
DSO Menu ............................................................................................................................. 10
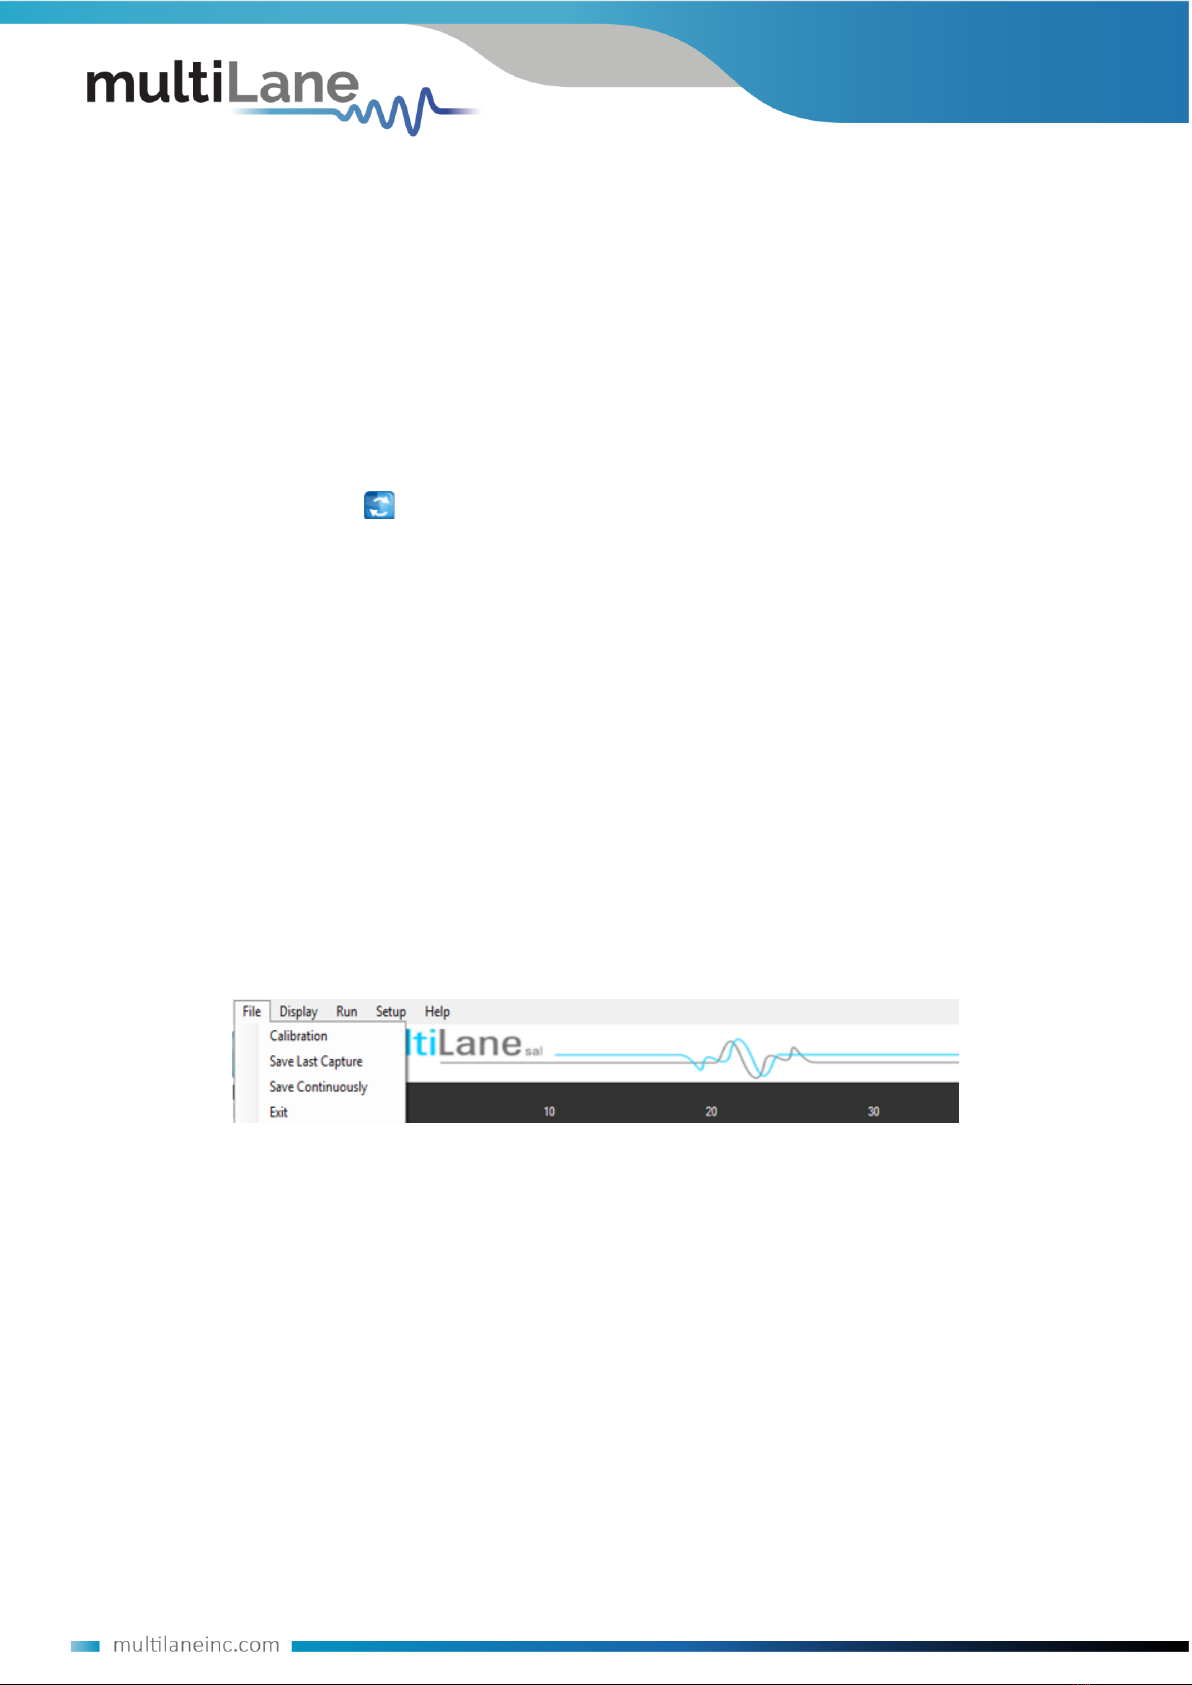
File Menu ....................................................................................................................................................10
Panning .......................................................................................................................................................11
Copy, Save, Undo Zoom and Print a Graph.................................................................................................12
Operating Modes ........................................................................................................................................12
Eye Measurement Mode.............................................................................................................................13
Status Bar.............................................................................................................................. 14
Number of Samples.....................................................................................................................................14
Operation Status .........................................................................................................................................14
How to add multiple ML-DSO Channels/Disconnect/Reconfigure .............................................................14
Oscilloscope Measurements................................................................................................... 15
Markers.......................................................................................................................................................15
Measurements ............................................................................................................................................16
Multiple Measurements..............................................................................................................................22
Statistics ......................................................................................................................................................23
Filters .................................................................................................................................... 23
S Parameter Mode................................................................................................................. 26
Frequency Domain Mode ....................................................................................................... 31
How to Change IP Address and Update Firmware................................................................ 32

4
INTRODUCTION
This is the user operation manual for the AT4025. It covers the installation of its software package
and explains how to operate the instrument for pattern generation and error detection; how to
control the clocking system, inputs/outputs and all the available measurements.
Acronym
Definition
BERT
Bit Error Rate Tester
API
Application Programming Interface
NRZ
Non-Return to Zero
GBd
Gigabaud
PLL
Phase-Locked Loop
PPG
Pulse Pattern Generator
GHz
Gigahertz
PRD
Product Requirements Document
I/O
Input/Output
R&D
Research & Development
HW, FW, SW
Hardware, Firmware, Software
GUI
Graphical User Interface
ATE
Automatic Test Equipment
HSIO
High-Speed I/O
API and SmarTest Documents
This manual supports the instrument AT4025 and it is compatible with the Advantest V93000
HSIO test head extender frame/twinning.
All APIs are available for Linux and tested under Smartest 7. For the list of APIs and how to
use them please refer to the “API” folder on the AT4025 webpage.
This manual does not explain how to operate the instrument using SmarTest environment.
Refer to Advantest’s website below for SmarTest document noting that it may change
without notice and also require login privileges provided through Advantest.
https://www.advantest.com/service-support/ic-test-systems/software-information-and-
download/v93000-software-information-and-download

5
Product Software
The instrument includes the following software:
AT4025 GUI.
Instrument GUI runs on Windows XP (32/64 bit), Windows 7,8 and 10.
NOTE. These applications require the Microsoft .NET Framework 3.5.
If the Microsoft.NET Framework 3.5 is needed, it can be downloaded through this link:
http://download.microsoft.com/download/2/0/e/20e90413-712f-438c-988e-
fdaa79a8ac3d/dotnetfx35.exe.
For more products updates, check the following webpage:
https://multilaneinc.com/products/at4025/
Minimum PC Requirements
The Windows PC properties for the AT4025 GUI application should meet the following
specifications:
Windows 7 or greater
Minimum 1 GB RAM
1 Ethernet card to establish connection with the device
USB connector
Pentium 4 processor 2.0 GHz or greater
.NET Framework 3.5 sp1
NOTE: It is recommended to connect the BERT via Ethernet to one PC only to prevent conflict from
multiple user commands.
NOTE: It is not recommended to hook up the instrument to a slow network or to connect to it
through WiFi

6
Installation
This section address installation and bring-up of the instrument, addressing the following topics:
- System start-up
- Connection guide
System Start-up
To use the DSO under Windows XP, Windows 7 and Vista, it is important that the correct start-up
sequence is followed:
Ensure Microsoft .NET Framework 4.0 is installed
Install the DSO GUI software
Connect the power cable to the AT4000L
Change the IP of the DSO to fit in the network range (Appendix II)
Communication through Ethernet port is required for data acquisition
Connect the PC to the AT4000L through an Ethernet cable, no driver required
Now the DSO is powered up, having the right IP, the Ethernet cable links the instrument to
the PC with the GUI correctly installed
To open the GUI, double click on the software icon located in the Desktop directory
In order to characterize the signals fielding the instrument, check the Data and Connection
configuration
NOTE: This release supports Ethernet connection for the software applications, and the USB port
is used only to configure the device IP Address (note that the IP should be in the same range of the
network)

7
DSO GUI Overview
Figure 9: GUI
Click the connect button at the top left of your screen
The “Connect to DSO” window will pop up
Click on the add button to add the virtual DSO
The “DSO configuration” window opens
If both software the DSO and simulator are hosted on the samecomputer, choose the
“Simulation” mode, then browse for the data file desired.

8
If one of the GUI instances is being run on a different PC, choose “Hardware” instead
of “Simulation” and enter the “IP” of the PC where the simulator isrunning
Click on the refresh button in order to retrieve the simulator configuration, or
configure the DSO by filling the “DSO configuration” window for the relevant IP
address
NOTE: Any data file that has already been saved using the DSO software can be loaded.

9
DSO Configuration
Connection Configuration
Change the configuration as needed:
The default display name of the target DSO can be edited as preferred
The IP of the DSO connected by writing it next to “IP” label
Name the DSO by populating the “Name” label
Click on the hardware radio button to use the instrument; fill in IP and Channel
External Clock Operation
Clock Input in normal mode ranges between 5 and 525 MHz:
Choose the Normal Operation radio button to use the onboard timing generator.
Enter the target line rate less Line Rate (Gbps) into the Gbit Rate field or choose a
Gbps value, example: 10.709, 10.625, 10.3125, 9.95328, 8.5, 6.25, 4.25 and 3.125
Specify the number of packets; it can be 4, 8, 16, 32, 64, 128, 256 or 512
Each packet consists of 512 sample points per UI, which are duplicated when drawing the eye.
Eg: 256 packets correspond to 131072 points per pattern, and 262144 points per eye (131072
for each of the 2 UIs displayed in eye mode).
Figure 10. DSO Configuration
Enter the percentage level of rising and falling times in the NRZ Thresholds field
Enter the External Reference Clock Frequency in MHz or as a factor of the bit rate
Clock rate can vary from 50 MHz to 525 MHz, with an amplitude range from 0.05 to
1.5 Vpp

10
Typically, this will be rate / 16, 64, or 80, but can be any other rate as well
Enter the Pattern Length of the data feeding the DSO to capture the full pattern
Note: Incorrect pattern length would still display the eye capture, however full pattern
capture is required for certain features of the software such as Jitter Decomposition,
PTB and Filters.
E.G.: Pattern Length = 127 for PRBS-7, The Pattern length of PN(n) is (2^n) - 1.
To get wander correction, check the box then choose between the 3 frequencies, 1024
or 2048 or 4096 Hz
In order to retrieve the last configuration, enter the specified IP and then press the
refresh button
In order to scale the measured results, to remove the effect of an attenuator
connected at the receiving end of the scope, enter the Attenuation value in dB. In
optical mode, the value is doubled when the attenuator is at 3 dB. In electrical mode
this is 6 dB.
To capture more points for finer measurements, accumulate the number of points
from all the acquisitions by entering the total number of points to persist in the
accumulate field. This will set the number of points filling the entire eye diagram. For
both UI’s, half this number of points will be displayed in the pattern diagram.
Accumulation works in infinite persistence mode, and unless the points are cleared or
the connection is reset, all acquisitions will take part in the accumulated result with
equal amounts of points randomly selected from each acquisition.
DSO Menu
Figure 11: DSO menu bar
File Menu
Save: after clicking on this icon, a save window appears enabling to save configurations, data
and measurements files for each acquisition.
In the case of being connected to multiple DSOs, there are check boxes next to each DSO,
check the one related to the needed DSO and save preferences. Each checked DSO has a
separate folder. If the 3 options Conf, Data and Measurements are checked; in this folder 3
kinds of files will be found.
Conf: select to save the configuration file.

11
Data: select to save the data file.
Measurements: select to save the statistical measurements files.
The version for this software can be found after selecting the “About Us” under “help”
menu option. Then, the following information will be displayed:
Zooming can be done by clicking on the graph and dragging, which would draw a dotted
window. When the mouse is released, the graph will zoom to display only the content within
the drawn box. This method of zooming may alter aspect ratio of the graph is the drawn box
is of disproportional dimensions.
Zooming also can be done using the mouse wheel when the Ctrl button is held. This method
will maintain the original aspect ratio of the graph.
In order to go back to the initial view, right click on the graph, and choose “Undo All Zoom/
Plan”
Panning
The position of the graph in the display window can be panned by dragging the graph with
the mouse while the Ctrl key is held.

12
Copy, Save, Undo Zoom and Print a Graph
Right clicking the graph exposes these features:
Copy: copy the present graph as an image into clipboard.
Save Image As: save the present graph in the desired location.
Page Setup: view page information for printing.
Print: print the graph.
Show point values: display the coordinates of points when hovering over
them in the graph.
Un-Zoom: undo the last zooming performed.
Undo All Zoom/ Plan: undo/reset all zoom actions.
Operating Modes
Figure 12: Supported DSO GUI Operating Modes
Selecting Operating Modes in upper right corner allows navigation between:
Eye Measurement Mode:
oOscilloscope Measurements
oMultiple measurements
oNRZ Measurements
oPAM4 Measurements
oMask Test
Pattern Capture Mode including jitter decomposition
S-Parameter Mode
Frequency Domain Mode

13
Eye Measurement Mode
Regardless of hardware or simulation mode, it is possible to draw the eye and capture
measurements after filling the configuration window and connecting to the instrument.
In Eye Mode, in order to draw the eye diagram, click on the Start Data Acquisition button
Check the Check All button to view all the eye measurements down the screen for one time
or select the needed measurement only by pressing on the desired icons. Use the second
option to reduce measurement operation time.
Figure 13: Measurements Mode
If a large number of acquisitions need to be captured, click on the Repetitive check box, then
press the Start Data Acquisition button . Check the Count Text box and specify the number
of acquisitions to automatically stop captures after a certain number of measurements.
By default, the measurements are displayed continuously. In this case, the eye diagram is
frozen after the first acquisition.
By default, Eye Mode is chosen; if you are located in Pattern Capture mode, to move to the
select Switch to Eye Mode to switch back.
During the acquisition phase the Start Data Acquisition button becomes a red stop acquisition
functionality. Clicking on the red stop button will stop after completing the acquisition
currently in progress and will display the eye and its statistical measurements.
In order to restart the acquisitions, click again on the Start Data Acquisition button; a new
set of acquisitions begins. Accumulated data continues across several runs if not cleared.
In order to save data, statistical measurements and configuration files, check the Saved Data
folder under the deployment directory. A folder is created for each ML-DSO and inside of this
folder the user can find 3 different files; statistical measurements, configuration and the data
file.

14
Status Bar
Number of Samples
The status bar displays the number of kilo-samples captured in the Eye mode.
‘1K Samples’ is equivalent to 1000 sample points in the Eye graph, including accumulated
point when applicable.
Operation Status
Operation Status
Status Description
Gathering Data
Acquiring data (reading from hardware)
Saving Data
Saving data in the data file
Error Connecting to DSO
A connection between SW and HW cannot be established
Error Applying Wander
Compensation on DSO
Wander cannot be applied because an eye cannot be detected at
the first place
Saving Results
Saving acquired data points and statistical measurements into their
file
Displaying Results
Showing the statistical measurements and refreshing the graph
Acquisition Finished
Acquiring data and sampling is finished
Table 1: Operation Status Messages
How to add multiple ML-DSO Channels/Disconnect/Reconfigure
To add a new ML-DSO channel, press the Add New ML-DSO Channel button in the
Connect to ML-DSO configuration window; fill it and connect
To disconnect from a specified ML-DSO, simply click on the Close button next to its
name in the Connect to ML-DSO form
To reconfigure the data, click the Edit ML-DSO Configuration icon, and then fill the
configuration window as preferred
To add multiple ML-DSOs, repeat the first step

15
Oscilloscope Measurements
While capturing the eye, a user can perform measurements by
simply clicking the corresponding buttons: Top, Base, Min, Max,
Fall time, Rise time, Peak to Peak, Eye Amplitude, Eye Height, Eye
Width, Jitter, and the crossing percentage. The Check All text box
can be selected to capture all the measurements in one action.
When multiple DSOs are connected, and after drawing all the
eyes or patterns, the measurements are displayed for all DSOs
down the screen in the tables.
Markers
This feature by default is off; in order to use it, switch it to on by choosing the On radio button,
under the Markers group box.
A pair of movable markers in both X-axis and Y-axis is displayed. The horizontal and vertical
markers help bound the measurement region by giving the difference between the 2
horizontal and vertical markers.
The results are displayed in the top of the graph. Picosecond or UI is the unit of the X axis; mV
is the unit of the Y axis.
Figure 14: DSO Markers
First select the marker to be moved; it should be highlighted in yellow
Drag the markers to the required location
The marker values displayed in the textboxes bottom left can be used to manually specify
the marker positions
Markers help verify horizontal and vertical measurements, such as jitter, eye width, eye
height, and mask margins. They can be dragged manually to view the delta or difference
between 2 markers.

16
Measurements
Measurement
Description
Screenshot
Histogram
The X and Y histograms show the density
distribution of the samples along the x and y
axes:
Top
The average y-value of the high-to-high
transitions.
Base
The average y-value of the low-to-low
transitions.
One and Zero
Levels
The average y-values at 20% around center of
the eye
Min
The minimum sample value.

17
Max
The maximum sample value.
Fall Time
The mean transition time of the data on the
downward slope of an eye diagram between
2 defined thresholds e.g. 80% and 20%. Note
that the percentage level of the rise and
falling time can be changed by modifying the
NRZ thresholds in the data configuration
window.
Rise Time
The mean transition time of the data on the
upward slope of an eye diagram between 2
defined thresholds e.g. 20% and 80%.
Peak to Peak
The difference between the max and the min
eye sample values, here max is the value of
the sample point with the highest amplitude
and min is the value of the sample point with
the lowest amplitude.
Eye Amplitude
The difference between one level and zero
level of an eye.

18
Voltage
Amplitude
The difference between top and base of an
eye.
Eye Height
Eye Height is the vertical opening of the eye
measured as the difference between the -3
sigma value of the high samples within the
NRZ window and the +3 sigma values of the
low samples within the NRZ window.
Eye Width
The time between the latest possible
occurrences of one eye crossing to the
earliest possible occurrence of the next
crossing.
Total Peak-to-
Peak Jitter
Jitter is defined as a measure of the short-
term variations of the significant instances of
a digital signal from its ideal position on the
time axis. In other words, ideally, an edge
should always land at the same position on
the time axis. In the real world, the edge is
sometimes a little early, sometimes a little
late. This is jitter. In this revision the Jitter
value is Peak to Peak.
Crossing
Percentage
The amplitude of the crossing level relative to
the low and high levels. (The value of the
crossing percentage is displayed in the
bottom of the screen.)
Jitter
The jitter measurement allows to calculate
the total jitter, the jitter peak-to-peak and
the jitter rms in ps.

19
DJ & RJ
The Deterministic Jitter value is displayed in
picoseconds and the Random Jitter value is
displayed in fs.
Mask Margin
The Switch to Mask Mode button, located
between the Eye and Pattern buttons, is used
to find the maximum mask margin that
results in no more than a specified number or
ratio of failing points. The figure below shows
an example of where the user wants to
determine the maximum mask margin
available for the highest number of failing
points, but no more than 25.
The answer in this example is +13% for 8
points. Setting the margin below this level
would result in less failing points in total.
Setting the margin above this level would
result in fewer failing points.
The DSO has the following standard masks:
100Gbase-SR, LR, STM-1, STM-4, STM-16, Gb
Ethernet, Fiber Channel (1x), Fiber Channel
(2x, 4x), Fiber Channel (8x), Fiber Channel
(10x), 10 Gb Ethernet, and user defined
masks. New masks are continuously added.
Recent additions are QDR & FDR.
Horizontal
Bathtub
The Horizontal Bathtub curve is a depiction of
Bit Error Rate as a function of unit interval
(UI) position. As the measurement location is
swept across a UI, the BER is captured,
typically resulting in a figure that resembles a
cross section of a bathtub, thus the name
“bathtub curve”.
Vertical
Bathtub
The Vertical Bathtub curve is a depiction of
total vertical noise in signal under test.
Voltage points are plotted as a function of
BER.

20
Pattern Capture
Mode
Pattern Capture mode enables the raw bit
sequence captured by the DSO to be
captured. In order to see the behavior of a
specified sequence of bits, zoom in and out
by scrolling the mouse wheel, or using the
cursor to specify the region to be zoomed in
upon. Pattern rise/fall times pre-emphasis,
post-emphasis, PRBS validity and VMA
(voltage modulation amplitude) can be
measured in this mode. Note, Pattern
Capture mode needs to be able to show the
full pattern for certain features of the
software to work, such as:
VMA
The voltage modulation amplitude of a
pattern displayed in mV.
PAM4
Pulse-amplitude modulation (PAM4) is a
form of signal modulation where the
message information is encoded to one of 4
amplitude levels. Unlike NRZ which varies
between 2 amplitude levels indicating zero
and one, PAM 4 varies between 4 amplitude
levels where one symbol corresponds to a
value in the range zero to three. This leads to
double the bit rate for the same baud rate as
NRZ.
To unlock the PAM4 measurement library,
choose PAM4 as the signal type.
Voltage RMS
The voltage RMS measurement can be
captured without Pattern or Eye Lock, and
can be used to determine noise floor, which
is then entered in the Configuration/
Advanced Menu for De-Embedding the
intrinsic noise from the setup.
Some of the measurements (Min, Max, One,
Zero, Peak to Peak, Eye Amplitude, Eye
Height, Eye Width, Eye Height BER, Eye Width
BER and VEC) are applicable in PAM4 mode.
Table of contents