Phase 2 SRG-4600 User manual

PortableSurfaceRoughnessGauge
PartNo.SRG‐4600
Operation Manual
21IndustrialAve
UpperSaddleRiver,NJ.07458
TechnicalSupport:(201)962‐8352
E‐Mail:[email protected]
WebSite:http://www.phase2plus.com

SRG‐4600OVERVIEW
TheSRG‐4600isaportable,lithium‐ionbatterypoweredinstrumentusedforcheckingsurfacefinishwiththemeasured
valuesdisplayedonadigitalreadout.Thisinstrumentcanbeutilizedinalaboratorysetting,ashopinspectionarea,or
whereveron‐sitesurfaceroughnesstestingisrequired.
Note:
Althoughthisinstrumentisdesignedandbuilttowithstandtherigorsofhandlingandusage,itisasensitiveprecision
instrumentandshouldbetreatedwithcaretoassuremeasurementaccuracyandreliableperformance.
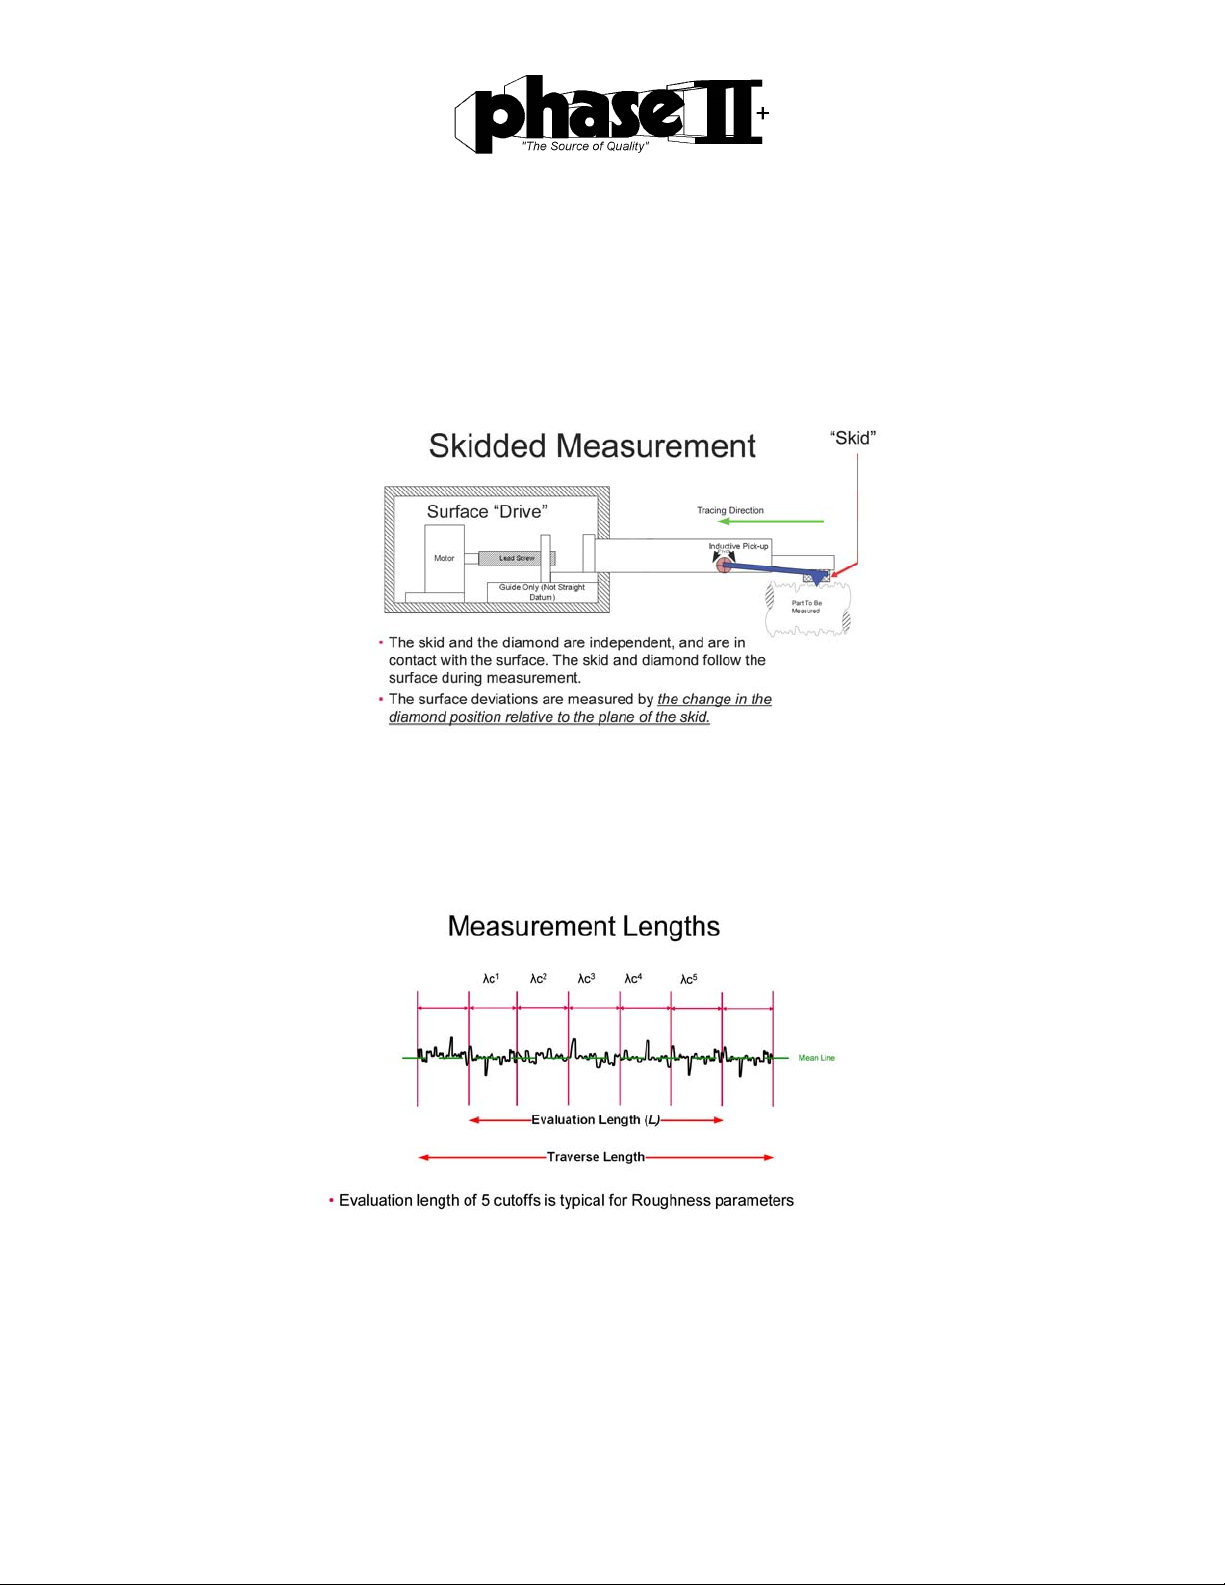
Measurementprinciple:Skidtypesurfaceroughnesstestersarecommoninstrumentsusedontheshopfloor.Adiamondstylus
istraversedacrossthespecimenandapiezoelectricpickuprecordsallverticalmovement.Peaksandvalleysarerecordedand
convertedintoaknownvalueofagivenparameter.
FeaturesofSRG‐4600
9parameters:Ra,Rq,Rz,Rmax,Rt,Rs,RSm,Rmr,RPc
Highaccuracyinductancepickup;
FourfilteringmethodsofRC,PC‐RC,GAUSSandD‐P;
CompatiblewithfourstandardsofISO,DIN,ANSIandJIS;
Canstore20setsofmeasurementsresults
128×64dotmatrixLCDdisplaysallparametersandgraphs;
Dataprocessingwithhighspeedandlowpowerconsumption;
Built‐inhighcapacitylithiumionchargeablebattery.Consecutiveworktimeislongerthan20hours;
CanbeconnectedtoyourPCprintertoprintallparametersandgraphs;
Built‐instandardUSBinterfaceenablescommunicationwithPC;
Automaticswitchoff,memoryandvariouspromptinstructions;
Optionalprinter,analysissoftwareandmeasurementplatform.
Measuringrange ZAxis(Vertical) 160μm
XAxis(Horizontal) 17.5mm
Resolution ZAxis(Vertical) 0.01μm/±20μm
0.02μm/±40μm
Measurementitem Parameters Ra,Rq,Rz,Rmax,Rt,Rs,RSm,Rmr,RPc
Standard ISO,ANSI,DIN,JIS
Graphic Roughnessprofile,Materialratiocurve,Direct
profile
Filter RC,PC‐RC,Gauss,D‐P
Samplinglength(
l
r) 0.25, 0.8, 2.5mm
Assessmentlength(
l
n) Ln=
l
r×nn=1‐5
PickupPrinciple Differentialinductance
Stylus NaturalDiamond,90°coneangle,5μmtip
radius
Force <4mN
Skid Ruby,Longitudinalradius40mm
Traversingspeed
l
r=0.25,Vt=0.135mm/s
l
r=0.8,Vt=0.5mm/s
l
r=2.5,Vt=1mm/s
ReturnVt=1mm/s
A
ccurac
y
Lessthanorequalto±10%
Repeatabilit
y
Lessthanorequalto6%
Powersuppl
y
Buil
t
‐inLithiumionbattery,ACadapter
8.4V,800mA
L×W×H119×47×65mm
WeightApprox. 380g

KeypadFunction:
Press to start measurement.
Up arrow / Parameters key. In the menu interface, press this button to toggle through the parameter
selections.
Down arrow / storage key. In the menu interface, press this button to scroll down through
parameter choices
Left arrow / graphic key. In the menu interface, press this button to change parameter selected.
The right arrow / Print button. When in menu, press this to scroll through parameter choices. In
the main interface, this can be used to send data to printer
Set / Menu button. In the main interface, press the button to display current set Parameters.
Press and hold for 3 seconds to enter the main menu interface.
Level Indicator. In main interface this allows you adjust the level of the stylus to the workpiece.
The arrow should be pointing at the zero before taking a test.
This is also the “Enter” button when in the menu interface.

StandardConfiguration
Name Qty
SRG-4600 main unit 1
Standard pickup(stylus) 1
Roughness specimen w/Holder 1
Stylus Nose Protector 1
Leveling Plates 1
A/C Adapter 1
Screw Driver 1
TurningOn/OffBatteryswitch
Thepowerswitchisontherightsideoftheinstrument.Whenpoweringoffforanextended
periodoftime,thisswitchshouldbeplacedtotheOFFpositiontocutoffpowersupply.The
SRG‐4600willautomaticallypoweronwhentheswitchismovedtotheONposition.
BatteryCharging
ThereisabatterysymbolinthetoprightcorneroftheSRG‐4600.Whenallofthebars
insidethesymboldisappear,thebatteryislowandtheunitmustbechargedup.
Typically,chargingtimeisapproximately3hours.

SettingsSystemInformation
1) TheMainMeasureScreen
TheHomescreenoftheSRG‐4500isasshownabove.Thisisthescreenthatwillbeon
displayuponpowerup.Thehomescreenshowsallmeasuringparametersthathavebeen
previouslyset.Parameterssuchassamplelength,assessmentofthelength,range,filter
andmeasurementunitswillbeshown.
Inthemaininterface,eachbuttononthekeypadwillimplementaspecificfunction.
2)Mainmenu
Toenterthemainmenu,pressandholdthe Set/Menubutton
Useupordownarrowstoscrollthruselectionsshownonthedisplay.
MeasureSet
PrintResult
Calibration
MemoryData
Language
SystemSet
AboutSoftware

3)ParameterSettings:
WhileMeasureSetishighlighted,Pressthe buttontoaccessandchangeallofthesettings
fortakingatest.
WhilePrintResultishighlighted,Pressthe buttontoaccessandchangeallofthesettings
forprintingresults.(Printermustbeselectedtoaccesssomeparameters)
WhileCalibrationishighlighted,Pressthe buttontoaccessandchangethesettingsrangefor
yourcalibration.
lr(ƛc):0.8mm (samplinglength) selectable
ln:lr*5 (assessmentlength)selectable
Range:+/‐40µm (rangeofyourapplication)
Filter:RC (filters)selectable
Standard:Ansi (Applicablestandards)selectable
DisplayR:Ra (Roughnessparameter)selectable
C(Rmr):75% (materialratiocurve)selectable
C(Rpc):000.00µm(materialdirectprofile)selectable
Unit:Metric (inch/metricselectable)
PrintRa,R willdisplayRavalueonprintout
PrintR&Prof willdisplayRavalue&Profile
PrintSelfR willdisplayself
SelfR..Set Chooseparametersforprintout
PROF:Ordinary showsstandardordetailedprofile
PrinterPair Bluetoothprintersetpairing
+/‐20µm:00%
+/‐40µm:02%
+/‐80µm:00%
+/‐160µm:00%

Usetheleft orright buttontoadjustthepercentageofchangeneededtocalibratethe
instrumenttoacalibratedreferencestandard.
WhileMemoryDataishighlighted,Pressthe buttontoaccess,viewanddeletestoreddata.
WhileLanguageishighlighted,Pressthe buttontochoosebetweenEnglish&Chineselanguages
WhileSystemSetishighlighted,Pressthe buttontoselectandchangeviewingsettingsaswellas
Bluetoothpairing
WhileAboutSoftwareishighlighted,Pressthe buttontoviewSerialNumber&Softwareversion
SaveMea.Data Showsallsaveddata
LoadMea.Data Choosedatatobeprinted
DelOneGroup Deleteonesavedgroup
DelAllGroup Deleteentirememory
Chinese
English
KeyBuz:On Soundforkeypadbuttons
WarningBuz:On Soundforexceedingsetlimits
PowerSave:3MinShutoffdisplayaftersettime
AutoOff:10min Poweroffentireunit
ClockSet adjusttimeanddate
ScreenBright Adjustbrightnessofdisplay
NoiseRedu:Off Noisereduction
ScreenTest Checkfordisplayissues
RemotePairing Bluetoothpairing

Stylusposition
Prior to taking a test, whether on your part or using the
calibration reference standard, the stylus position must
be leveled on the application. The SRG-4600 has a built-
in zero indicator to make this simple and accurate.
Position the unit on the supplied reference standard or
your work piece and press the Enter button. The
leveling indicator will appear on the display. Using the
supplied height adjuster on the right side of the unit,
raise or lower until the arrow falls on or close to the “0” in the center of the leveling scale. Once
achieved, press the Enter button to return to the main measuring screen.
Calibration:usingsuppliedreferencestandard
Accuracy of the SRG-4600 is +/-10% of actual value
Prior to measurement on your parts, you should verify the accuracy of the unit by performing a
quick calibration using the supplied reference standard.
If the difference between the measured value and the specimen value is greater than the scope of
equipment requirements, or user requirements are more accurate, you can use that value of the
calibration function to correct measurement results.
Startingmeasurement
1) Starting measurement
Once all parameters have been set, you should place the SRG-4600 on your work piece. In the
main measuring screen, press start button on the top left corner of the keypad to start measuring .
Do not move unit once test has begun!
To view your results in profile, press the LEFT arrow
button after test has been taken.
While on this page press the Enter(back arrow) Button
to zoom in on the profile.
To view results in the ratio curve,
press the left arrow button then press the
UP Arrow button. To exit, press the
Set/Menu button.
Pickup Position
-
+
0
Vv:5× lr:1
(%Rt)
100
0
c
100
(%)
Rmr

To view your reading in other parameters, press the UP arrow button after your test is complete. You
will see all parameters as shown below:
SavingTestResults
1) Saving test results
Once the value is shown on the display, press the MEM button. Now press the Right arrow
button to go to the next numerical file that shows “empty” and press the buttontosaveit.The
unitwillimmediatelyreturntothemaintestingdisplay.
Maintenance:
Stylus:
1) After completion of measuring work, please remove stylus from unit and return to case.
2) The stylus is extremely sensitive. Please don’t touch the tip or run it across a surface that hasn’t been cleaned.
These are also sensitive to high humidity. Please store in dry cool place.
Main Unit:
1)Always keep clean using a soft cloth. Do not use harsh cleaners on this as it will diminish the finish.
2)The SRG-4500 is a precise sensitive instrument and should be handled accordingly.
Battery:
1)Battery power is shown on the top right side of the display when in main measurement screen.
When the battery symbol is empty, its time to recharge the unit.
2)Approx. charging time is 3 hours.
Calibration Reference Standard:
1) Always keep this clean. Store in carry case when not in use.
2) Avoid scratches to the work area surface of the standard
Ra=3.655µm
Rq=3.793µm
Rz=7.014µm
Rmax=9.198µm
Rt=9.198µm
RS=0.0930µm
RSm=0.0909µm
Rmr=59.1%
Rpc=110.0cm
Use of supplied KEYFOB
PresstheBbuttontobringup
theLevelingDisplay.Besurethat
thearrowispointingonorvery
closetothe“0”onthegrid.
Thisfunctionsameas
“enter”onthekeypad.
Onceparametersareset,pressthe“A”
buttononthekeyfobtostartthe
measurement
p
rocess.

Terms&HelpfulTips
Filteredprofile:profilesignalafterprimaryprofileisfilteredtoremovewaviness.
D‐P(direct‐profile):adoptcentrallineofLeastSquareAlgorithm.
RCfilter:analogue2RCfilterwithphasedifference.
PC‐RCfilter:RCfilterwithphase‐correction.
Gaussfilter:ISO11562.
•SkiddedinstrumentsmeasureonlyRoughnessparameters(R…)
•Wavinessisfilteredoutbytheskidfollowingthesurface.
•Mostportableinstrumentsareskidded.

RoughnessFilters
•Afilterisusedtoisolatetheroughnesswavelengthband
•FiltersareMechanicalandDigital
–Mechanicalfilters
•DiamondRadius(valleysuppressionbydiamondradius)
•Skid(greaterorlesserskid“bridging”effectofskidonsurface
valleys,dependentonskidgeometry),alsofiltersoutwaviness
–DigitalFilters
•RC(Simulatedoldanalogelectrical“resistorcapacitor”)
•Gaussian
•Theuserselectsthe“Cutoff”settingusedbythefilterto
isolatetheroughnesswavelengthband
•Filterstypicallyhavetransmissioncurves
•Filtereddataiscenteredaroundameanline
TheRoleofRoughness“Cutoff”(λc)
•Forroughness,thecutoffvalueisthelongest
nominalwavelengthtobeincludedinroughness.
•Longerwavelengthsarefilteredout.Shorter
wavelengthsareincludedinroughness.
•Wavelengthslongerthantheroughnesscutoffare
usuallyincludedinwaviness.
(λc)RoughnessCutoffLengths
•Thecutoffselectedmustbeshortenoughtoexcludelong
wavelengths(waviness)
•Thecutoffselectedmustbelongenoughforavalid
sample(atleast10toolmarkspercutoff)
•LengthsaredefinedinASMEandISOstandards
•Cutoffdefaultformerlywas.8mm,nowmustbedefinedon
thedrawing(ASME)
Millimeter Inch
.08 .003
.25 .10
.80 .030
8.0 .300
25.0 1.00

RoughnessAverage(Ra)
Ra=AA=CLA
Ra≠RMS
Rq=RMS
•RaisthemostcommonlyspecifiedparameterinUSA
•Roughnessaverage(Ra)isthearithmeticaverageofthe
absolutevaluesoftheroughnessprofileordinates.


ReviewandRecommendations
•Tostudysurfacetexture,wefiltersurfacedatainto
wavelengthbands.
•ThewavelengthbandsarecalledRoughnessandWaviness
•SkiddedstylusinstrumentsmeasureonlyRoughness
parameters(R…).Mostportableinstrumentsareskidded.
•SkidlessstylusinstrumentsmeasureRoughness,Waviness
andProfile
•Cutoffdefaultformerlywas.8mm,nowmustbedefinedon
thedrawing.
•Usethesamecutoff,numberofcutoffs,diamondradius,filter
type(GaussianorRC),andparameter(s)thatyourcustomer
usesandspecifies.
•Beawareofstandardauthority(JIS,ISO,DIN,ASME).Do
notassumethatparametersarethesame!
•Routinelycheckcalibrationanddiamondcondition.

Twelve common mistakes to know and avoid
Surface finish determines more than just how parts look and feel. It also influences how they wear,
conduct heat, distribute lubrication, accept and hold coatings, resist corrosion--even how they sound. In
spite of the capabilities of the new gages, surface finish remains a complex field that is subject to
misunderstanding. It is important that gage users and specifying engineers understand what can go wrong
to make sure that it doesn't. Here are a dozen common errors to avoid.
1.Not understanding parameters Parameters--the quantitative methods used to describe and
compare surface characteristics--are defined by the algorithms used to calculate a numerical value from
the raw measurement data. A surface finish requirement without a defined parameter is not specified. For
example, a requirement that states "roughness = 50 μ" is not acceptable today, because there are dozens
of parameters used to measure roughness. On the other hand, "Ra = 50 μ" or a symbol are acceptable,
because the Ra roughness parameter is specified.
The main body of the new ASME B46.1-1995 standard describes more than a dozen parameters, and
includes many more in appendices, while new ISO standards describe even more. Even more problematic
is the fact that past discrepancies between standards have made some parameters ambiguous. Three
different "Rz" parameters may be found on part prints: an old international version (ISO); an old Japanese
version (JIS); and a German (DIN) version that is now accepted by ISO and JIS.
Since ISO and JIS dropped their old Rz definitions and adopted the DIN version, there is now only one
current version. But there is still opportunity for confusion, if the specification is taken off an older part
print, if the specifying engineer relies upon an old standard, or if the inspector uses an old gage.
Confusion between two roughness parameters, Ra and Rq (formerly called AA and RMS, respectively), is
another source of error. When measuring a pure sine-wave profile, Rq results are 11 percent
higher than Ra results. For this reason, some gage manufacturers used to incorporate a switch on their
instruments, which simply applied a multiplication factor to convert AA to RMS (using the old
terminology). Some end-users who now own gages that measure only Ra have learned to apply that
multiplication factor manually if Rq is required. But whether this conversion is done automatically or
manually, it will generate inaccurate results when measuring any profile other than a pure sine wave
because there is no simple mathematical relationship between the two parameters. Real-world results on
manufactured parts can vary by more than 50 percent between the two parameters.
2.Selecting the wrong gage There are two basic categories of surface finish gages: "skidded" and
"skidless" types. In skidded gages, the stylus moves up and down relative to a pad attached to the bottom
of the probe that traverses along the surface of the part. Because the skid follows the general profile of
the part, the stylus registers only higher-frequency roughness characteristics--in other words, tool marks.
Thus, skidded gages are for roughness parameters only. In a skidless gage, the probe moves relative to a
reference surface inside the drive mechanism, so that the stylus is free to follow the full profile of the part,
including low-frequency geometry characteristics, such as out-of-straightness and waviness, as well as
tool marks. Skidded gages may use either a velocity-sensitive or a position-sensitive transducer, while
skidless gages use only position-sensitive devices. Mistakes can be made in purchasing, where a gage with
inadequate capabilities might be selected in an unwise attempt at economy. ASME B46.1 includes a useful
chart that classifies surface finish gages according to their measurement capabilities.
A gray area exists in the measurement of profile straightness, which can be measured by skidless profiling
surface finish gages, and by geometry gages with precision slides (i.e., "cylindricity" gages). The larger tip
radius of a geometry gage mechanically "filters" out most roughness and some waviness features, while a
profiling surface finish gage, with its smaller tip radius, responds to all features (roughness, waviness, and
straightness), and can filter out roughness electronically. A straightness callout that does not specify the
use of a particular electronic filter could be measured with either type of gage, but results would be
different, depending on whether waviness is included.
3.Reliance on default cutoff value The cutoff is the sampling length within which roughness
data is collected. The cutoff length must be long enough to provide sufficient data for the measurement,
but not so long that part geometry could impose extraneous data. A properly-specified cutoff usually
includes 10 to 15 tool marks. For most machined surfaces, this means cutoffs of .010", .030", or .100"
(0.25 mm, 0.8 mm, 2.5 mm). Don't confuse cutoff with stroke or traverse length, which is the total
distance the probe travels, and may be 2", 12" or even 18" long (50 mm, 300 mm, 450 mm), in order to
evaluate waviness and straightness. Detailed information about the choice of cutoffs is found in Chapters
3 and 4 of ASME B46.1.

A typical surface finish callout consists of many elements, all of which may be required because of the
complexity of surface finish metrology. Under the old ANSI B46.1-1985 standard, a default value of .030"
(0.8 mm) applied to any surface finish callout that did not specify a cutoff. This is an effective cutoff value
for many, but not all, roughness measurements. To avoid confusion and lax specifying, the new ASME
B46.1-1995 standard abolishes the default and insists that all cutoffs be specified.
It is standard procedure to measure five cutoffs within a single stroke and average the results, although
fewer may be used if the surface is too short to include five. Where a manufacturing process is known to
be consistent, less than five cutoffs may be sufficient to generate reliable results. When reporting results,
the number of cutoffs should be indicated if it is not five. To report the use of four cutoffs, the form shown
in the following example would be followed: Ra4 = 25μ".
4.Choosing the wrong signal-processing filter The signal generated by the gage head must be
filtered electronically before the data can be converted to a numerical result. The new 50 percent Gaussian
filter, which is the default according to ISO, is a better, more accurate filter in metrological terms than the
older 2RC filter. Many part prints, however, still specify (or assume) the use of a 2RC filter, because it is
more familiar, and because it is available on most gages, including those with old analog technology.
Because the two filters will generate different results, design engineers should be sure to specify which
filter is intended, and the inspector should follow the specification, or seek clarification if it is absent. For
evaluation of some specific surfaces, such as plateau-honed cylinder liners and porous materials, another
filter, known as the "Valley Suppression" filter, is used.
Modern skidded roughness gages can be compact, economical, and well-suited to shop-floor inspection
tasks. In addition to the possibility that the part might be ruined by scratching it, the measurement could
be inaccurate, because the scratch representsa modification of the surface. Plastics, rubber, graphite,
copper, aluminum, and many alloys are also subject to deformation at fairly low levels of force, which
could also influence profile measurement results. These materials therefore require the use of a probe
with the lowest force possible.
5.Using a damaged stylus As with a stylus that is too large, a stylus that is worn or chipped will not
penetrate as deeply into fine surface irregularities as one that is in good condition. (Figure 1) The first
indication of a worn or broken stylus may be a change in gage readings, or may be found during the
calibration process (see Common Error #11). If a problem is suspected, the stylus may be examined with
a special test patch or a low-power microscope.
6. Ignoring the lay (measuring in the wrong direction) Most machining processes create tool marks that
run in a particular direction across the part surface. When measuring roughness parameters, it is essential
that the gage traverse at right angles to the "lay," or pattern of toolmarks, to capture worst-case
conditions.
Fig. 1 -Styluses that are worn or broken, or too large for the surface, may generate inaccurate results
because they can't reach the bottom of the surface valleys. Some processes, however, such as electrical-
discharge machining (EDM) and plastics
molding, do not create unidirectional tool marks. When this is the case, it is advisable to take two
measurements at 90 deg. To each other, to check whether there is a distinct lay to the surface. If there is,
then the rougher of the two measurements must be used.
7. Including flaws in the measurement Parts may include flaws that are unrelated to the manufacturing
process. Parts may also include other features that interrupt the surface, such as a pore in a porous
metal. Though surface finish gaging is intended to monitor and ensure the stability of the manufacturing
process, it is essential that these irregularities be excluded from the measurement. This can be easily
done post-measurement with some computer-driven gages, where software enables the user
to visually identify irregularities on the trace, and exclude them from the calculation. For gages that report
roughness only as a numerical result and do not generate a trace, care must be taken to avoid
irregularities in the first place. On the other hand, there are some cases where it is desirable to include
these irregularities in the measurement: for example, to check if a part meets specifications in spite of a
scratch. So irregularities should not be automatically excluded. Each instance must be considered
separately.
8.Inattention to leveling This problem applies to skidless gages, where the gage must be level relative
to the workpiece. To measure fine surface characteristics at high magnification, the gage must be
mechanically pre-leveled, before final electronic leveling can be performed by the computer. To pre-level
the gage, a test trace is performed, then software indicates how many turns are required on the leveling
knob on the drive mechanism. Once the gage's attitude is within an acceptable range, the
computer performs the final leveling, compensating for any remaining out-of-level condition after the
measurement is performed.

9.Ignoring vibration in the gaging environment Many surface finish gages are used on production floors,
where vibration from manufacturing equipment may interfere with the measurement signal. Some skidless
gages have a built-in "static mode" function to assess this condition. With the traverse motor turned off
and the stylus in contact with a surface, any signal generated is the result of ambient vibration. Vibration
effects can be reduced or eliminated by relocating the gage near a bearing wall, by isolating the gage with
vibration-absorbing rubber pads or a high-density table, or by removing it from the area altogether. It
may also be possible to identify and eliminate the source of vibration.
10.Misunderstanding calibration Surface finish gages are verified against test patches or specimens
whose surface characteristics are known and certified. If gage results do not agree with the characteristics
of the specimen, the gage must be adjusted. The nature of the adjustment differs considerably between
simple, non-computer-driven gages, and sophisticated computerized ones. Simple gages are generally
checked against a roughness patch with either a triangular or sine-wave profile. If the gage reads other
than the patch's calibrated value (usually around Ra 125 μ"), a potentiometer is adjusted to bring results
into agreement with the specimen. In this case, it is the "back end" or calculating portion of the gage that
is being adjusted. The "front end"--the raw input data--is untouched. The reverse applies to computer-
driven gages, where the backend consists of the software algorithms that turn raw data into numerical
results. As the algorithms cannot be modified, the way the gage perceives the raw data at the front end
must be adjusted. Skidless gages are usually calibrated against a stepheight specimen, then a
multiplication factor is entered into the computer to adjust signal gain from the transducer before it
reaches the algorithm software. From that point on, all data entering the computer is corrected by the
same multiplication factor.
References
1.Tabenkin,A.,:SurfaceFinish:AMachinist'sTool,ADesignNecessity,ModernMachineShop.April1996
2.Tabenkin,A.,:SurfaceFinishMeasurementBasics,QualityMagazine.September2004
3.Tabenkin,A.,:Wheredowegowronginsurfacefinishgaging?,QualityinManufacturing.November/December1998.
4.Sander,M.:APracticalGuidetotheAssessmentofSurfaceTexture,FeinprufGmbH,Goettingen1989
5.ANSI/ASMEB46.1‐2002SurfaceTexture,SurfaceRoughness,WavinessandLay,AmericanSocietyofMechanical
Engineers,2002
6.ANSI/ASMEY14.36M‐1996(R2002)SurfaceTextureSymbols‐Metricversion,AmericanSocietyofMechanicalEngineers,
1996
7.Nugent,P.,MacKenzieD.,DevelopmentsinSurface(andForm)MeasurementTechnology(PresentationforCaterpillar),
October2006.
8.Vorburger,T.,Raja,J.,SurfaceFinishMetrologyTutorial(NISTIR89‐4088),U.S.DepartmentofCommerce,National
InstituteofStandardsandTechnology,June1990.
Note:Parametercalculationsinthispresentationareshownfordiscussionandpurposesofillustrationonly.Refertothe
ANSI/ASMEB46.1‐2002SurfaceTexture,SurfaceRoughness,WavinessandLayforactualcalculationsandmethodsof
evaluation


Recommendedtableofthesamplinglength
OptionalDataOutputSoftwareScreenShots
Profile Cutoff Sampling/Evaluation
Length
Rz (μm) Ra (μm) λc (mm) lr / ln (mm)
Up to .1 Up to .02 .08 .08 / .4
Over .1
up to .5
Over .02
up to .1 .25 .25 / 1.25
Over .5
up to 10 Over .1 up to 2 .8 .8 / 4
Over 10
up to 50 Over 2 up to 10 2.5 2.5 / 12.5
Over 50
up to 200 Over 10 up to 80 88 / 40

Table of contents