RBR RUSKIN User manual

RUSKIN USER GUIDE
Datalogger Manual
rbr-global.com

Revision History
Revision No. Release Date Notes
1.0 January 20, 2010 Original
1.1 April 16, 2010 Updated to include sections for N-Point Calibration and
Metatables
1.3 June 25, 2010 Include .tide and .wave information for TWR
Include Rinko calibration note
1.3.x July 6, 2010 Event and Error Stamps descriptions / multiple issues from
RSK-1396
1.4 November 4, 2010 General Edits
1.4.1 February 1, 2011 General Edits
February 1, 2011 iRev1.4

Table of Contents
WARRANTY STATEMENT ............................................................................................1
INTRODUCTION.............................................................................................................2
RUSKIN USER GUIDE...................................................................................................2
RUSKIN ..........................................................................................................................2
PROVIDE YOUR FEEDBACK........................................................................................3
INSTALLATION..............................................................................................................3
Install Ruskin on a PC ................................................................................................................................3
Install Ruskin on a Mac ..............................................................................................................................4
Uninstall Ruskin..........................................................................................................................................4
Update Ruskin.............................................................................................................................................5
CONFIGURATION AND SCHEDULING.........................................................................6
Getting started with Ruskin .......................................................................................................................6
Stop logging ................................................................................................................................................7
Use a simulated logger...............................................................................................................................8
View information about a logger ...............................................................................................................8
Configure a logger......................................................................................................................................9
Averaging...................................................................................................................................................11
Thresholding and Hysteresis...................................................................................................................11
Configure a tide and wave recording (TWR-2050) logger.....................................................................13
Relationship between the tidal and wave sampling periods................................................................15
Schedule a logger.....................................................................................................................................16
REALTIME DATA.........................................................................................................18
February 1, 2011 ii Rev1.4

Fetching and streaming data...................................................................................................................18
DOWNLOAD.................................................................................................................19
Download data to a file.............................................................................................................................19
VIEW, ANALYSE, AND EXPORT.................................................................................20
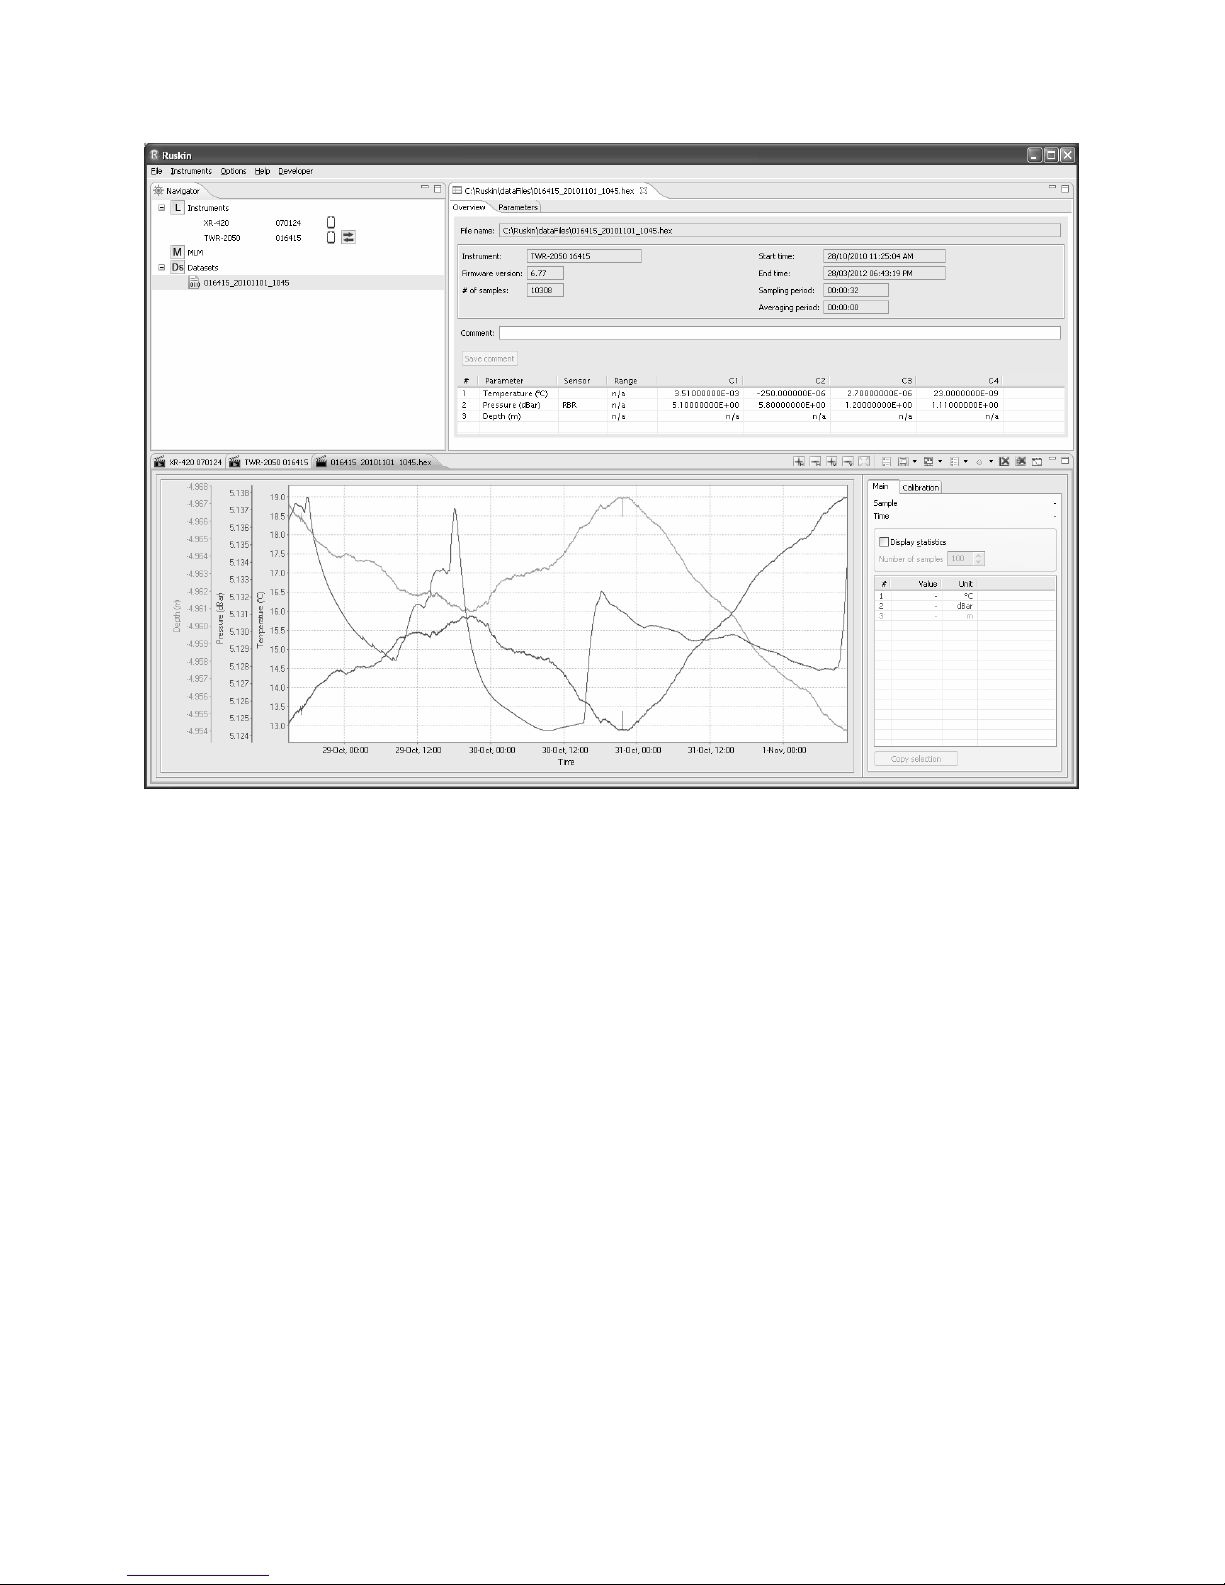
Open a stored dataset ..............................................................................................................................20
The Plot view .............................................................................................................................................20
Tide and Wave Display.............................................................................................................................25
Export data ................................................................................................................................................26
Save a plot for viewing outside Ruskin..................................................................................................27
CALIBRATION .............................................................................................................27
Change calibration coefficients...............................................................................................................27
N-Point Calibration....................................................................................................................................28
Oxyguard DO Calibration.........................................................................................................................29
AMT pH Calibration...................................................................................................................................30
Seapoint Turbidity Calibration.................................................................................................................32
Hydrotide Druck Pressure Sensor Calibration.......................................................................................34
Alec Rinko Optode Calibration................................................................................................................35
PREFERENCES ...........................................................................................................36
Specify directories for output files..........................................................................................................36
File naming convention............................................................................................................................37
Specify plotting preferences....................................................................................................................37
Derived channels ......................................................................................................................................38
Add depth as a derived channel..............................................................................................................38
Add derived channels related to conductivity.......................................................................................38
Add dissolved oxygen as a derived channel .........................................................................................40
Calculate derived channels when sensors are missing .......................................................................41
February 1, 2011 iii Rev1.4

GENERIC SERIAL CARD - META TABLE ..................................................................41
Meta Table..................................................................................................................................................42
Test Meta Table – Sample data................................................................................................................43
Editor Area.................................................................................................................................................43
LOGGER HARDWARE ................................................................................................44
BASIC OPERATING INSTRUCTIONS.........................................................................44
INTRODUCTION...........................................................................................................44
Opening and closing the logger..............................................................................................................44
Changing the batteries.............................................................................................................................46
COMMUNICATING WITH THE LOGGER....................................................................47
1050/2050 and XR series loggers............................................................................................................47
DEPLOYMENT .............................................................................................................49
MAINTENANCE AND REPAIRS..................................................................................50
Support kits ...............................................................................................................................................50
O-rings........................................................................................................................................................50
Repairs.......................................................................................................................................................52
Calibration..................................................................................................................................................52
APPENDIX A – BATTERY LIFE CALCULATION........................................................53
When to replace the batteries..................................................................................................................53
Predicting battery life ...............................................................................................................................53
APPENDIX B – O-RING SPECIFICATIONS ................................................................54
APPENDIX C – EVENT AND ERROR STAMPS..........................................................55
February 1, 2011 iv Rev1.4

Warranty Statement
All data loggers manufactured by RBR Ltd. since September 2002, are warranted against
defects in workmanship or original parts and materials for life.
Units suffering from such defects will be repaired or replaced at the discretion of RBR Ltd.,
provided that the problem has appeared during normal use of the instrument for the
purpose intended by us. The liability of RBR Ltd. extends only to the replacement cost of
the instrument. The customer will bear all costs of shipment to us for repair; all other costs,
including return shipment, will be borne by RBR Ltd.
This warranty does not cover consumables or normal wear and tear, nor does it cover
damage caused by negligent use or mishandling. Attempted modification or repair of any
unit without the prior consent of RBR Ltd. will immediately void any warranty in force.
Users are expected to maintain a regular program of calibration. Equipment, such as
sensors made by other companies, is warranted only to the extent provided by the original
manufacturers.
We reserve the right to grant or refuse warranty repairs at our discretion if we consider that
there are reasonable grounds for doing so.
November 5, 2010 Rev1.4
1

Introduction
Ruskin User Guide
The Ruskin User Guide introduces you to Ruskin and helps you to use it effectively from the
start.
The guide shows you the overall processes that we suggest you use. The process includes
links to step-by-step procedures that are easy to follow. The guide also provides some
conceptual information. Because we assume that you will use this guide while you are using
Ruskin, the guide does not tell you what you can see for yourself in the Ruskin window.
You can access the Ruskin User Guide on the CD provided when you purchase a logger,
from the Help menu in Ruskin, and on the RBR web site (www.rbr-global.com).
Release notes are automatically displayed each time you install an updated version of
Ruskin. The most recent release notes are also available from the Help menu in Ruskin.
For information about operating and maintaining the RBR submersible data loggers, see the
RBR Submersible Logger Hardware section of this manual (p. 44). It will tell you how to
change the battery, inspect and replace O-rings, and so on.
Ruskin
Ruskin is the RBR software that manages your RBR loggers so they provide all the data
necessary to do your work. Ruskin provides a graphical user interface that makes using the
loggers easy. Use Ruskin to do the following:
• configure, schedule and enable multiple loggers
• download data after logging
• graphically view data sets
• export data in various formats
• change the calibration coefficients for your logger
Ruskin can be used on Microsoft Windows (XP and Vista), and on the Apple Mac running
OS X (10.5 Leopard or later).
Note: Your logger must be running RBR firmware version 6.2 or later to use this version of
Ruskin. That equates to all instruments manufactured after January 1st, 2008.
November 5, 2010 Rev1.4
2

Provide your feedback
As you use Ruskin to manage your RBR loggers, you may have questions or issues that
are not addressed in this guide. At such times, we would like to hear from you.
Steps
1. From the Help menu, click Comment on Ruskin.
2. The Feedback to RBR dialog box appears.
3. Identify yourself and summarize your comments.
4. Provide a detailed description and add any attachments, if required.
5. Click OK.
We will respond to you using the email address that you provide.
Installation
Install Ruskin on a PC
You can install Ruskin on a Windows computer that uses the XP or Vista operating system.
November 5, 2010 Rev1.4
3

Steps
1. Place the CD-ROM in the appropriate computer drive.
2. If the installation does not begin automatically, double-click the executable file
named Ruskin Complete Setup in the root directory on the CD-ROM.
3. Follow the installation instructions. You can specify a different name and location for
the working directory for the software, which is C:\Program Files\RBRRuskin by
default.
A shortcut to Ruskin appears on the Desktop and in the Start menu folder called
“RBRRuskin”.
Install Ruskin on a Mac
You can install Ruskin on the Apple Mac running OS X (10.5 Leopard or later).
Steps
1. Place the CD-ROM in the appropriate computer drive.
2. After the CD-ROM mounts, open the drive and double-click the Ruskin package.
3. Follow the installation instructions. Although you can specify a different folder for the
working directory for the software, we recommend that you use the default
Applications folder.
A folder named “RBRRuskin” appears in the Applications folder.
Uninstall Ruskin
If you no longer need to manage RBR loggers from your computer, you can uninstall
Ruskin.
Note: The uninstall utility does not delete any Ruskin data files or log files.
It is not necessary to uninstall an older version of Ruskin before installing a newer version.
The installation program deletes the older files before installing the newer ones. For more
information, see on page 5.
Windows XP
On the Control Panel, use the Add/Remove utility and click Ruskin.
November 5, 2010 Rev1.4
4

Windows Vista
On the Control Panel Home, under Programs, click Uninstall a program, and then click
Ruskin.
Macintosh computer
Move the RBRRuskin folder from Applications to the Trash.
Update Ruskin
To take advantage of new features and bug fixes, ensure that you are using the most recent
version of Ruskin.
It is not necessary to uninstall an older version of Ruskin before installing a newer version.
The installation program deletes the older files before installing the newer ones. It does not
delete any Ruskin data files or log files.
The most recent version of Ruskin is always available on the RBR web site (www.rbr-
global.com/). However, if you already have an older version of Ruskin installed, Ruskin
automatically notifies you that a newer version is available when you start Ruskin. If you
have a broadband connection, we recommend that you follow the installation instructions
that appear on your computer. Otherwise, request a CD from RBR.
November 5, 2010 Rev1.4
5

Configuration and Scheduling
Getting started with Ruskin
Before you begin using your RBR loggers, you may want to experiment a bit with the
simulated loggers that are included in Ruskin. For more information, see “Stop logging” on
page 7.
When you are ready to use your own RBR loggers, we recommend that you follow the
following steps to ensure that you measure exactly what you want on the first attempt.
You must already have installed the Ruskin on a Windows computer or on a Macintosh
computer.
Steps
1. If you are using your first logger, you can either use the default preferences or
specify your preferences to apply to all your loggers. For more information, see
“Preferences” on page 35. You can change these preferences at any time.
2. Connect your logger locally through your computer’s serial port or USB to serial
adapter. The logger should appear in the Navigator view after a few seconds.
3. Click the logger that you want to use. Ensure that it contains the sensors that you
expect by viewing the Information tab in the Properties view on the right side of the
Ruskin window. For more information, see “View information about a logger” on
page 8.
4. If you want to see live data sampled every few seconds but not saved, select the
start live plot button in the upper right corner of the Plot view, which is at the bottom
of the Ruskin window.
5. Click the Setup/Basic Configuration tab to specify features such as streaming,
averaging, and thresholding.
Important: You must specify your preferences regarding these features before you
enable the schedule. For more information, see “Configure a logger” on page 9.
Note: These features are not available for all types of loggers. In fact, much of the
configuration for the TWR-2050 logger, which records waves, is different from the other
logger types. For more information, see “Configure a TWR-2050 logger” on page 13.
6. If you want to view or modify calibration coefficients, click the Calibration tab. For
more information, see “Configure a logger” on page 9.
Important: The conductivity, temperature, and depth sensors were calibrated to
their specified accuracy before shipment, traceable to NIST standards. We strongly
recommend that you consult RBR before changing any of these calibration
coefficients.
November 5, 2010 Rev1.4
6

7. Click the Setup/Schedule tab to schedule the logger to take samples when and as
often as you want within the limits of your logger. For more information, see
“Schedule a logger” on page 16.
Ruskin prevents you from enabling a schedule that exceeds the memory capacity of
the logger. Ruskin also shows the estimated battery usage (based on 1000 mAh
cells) required to use your logger as scheduled. You should seriously consider this
information before you enable the schedule.
8. On the Setup tab, click Enable to take samples according to the schedule that you
specified. If you enabled streaming data, you can use the live plot mode button in
the Plot view to choose whether to view samples taken at the default speed for your
logger type (Fetching mode) or samples taken at the speed that you specified in the
Sampling period box (Streaming mode) (Properties view/Schedule tab).
Important: If you are streaming data and did not select the Enable data storage
whilst streaming data check box on the Setup/Basic Configuration tab, the streamed
data is not stored in the logger memory.
9. If you want to download data, click the Download tab to download all the data saved
since your schedule was enabled. For more information, see “Download data to a
file” on page 19. The focus changes to the new dataset in the Navigator view, and
the static data appears in the Plot view. You can now export the downloaded data to
a file in Excel, Matlab, engineering text, or raw text formats. You can also save the
image as a PDF or PNG file for viewing outside Ruskin.
Stop logging
Logging stops on its own when one of the following occurs:
• The end logging time is reached.
• The power is removed.
• The logger memory is filled.
• The logger battery is depleted.
You can also stop logging at any time by doing the following:
• On the Setup tab (Properties view), click Stop.
Important: Whether or not you make any changes to the schedule or the configuration
before running the schedule again, a warning appears that the contents of memory will be
erased. If you want to save the data stored so far on the logger, you must download the
data to a file (Download tab/Download button) before proceeding.
November 5, 2010 Rev1.4
7

Use a simulated logger
Ruskin can simulate most logger types that RBR produces. We recommend that you
experiment with your type of simulated logger before enabling a schedule for your actual
RBR logger. This practice will probably save you time in the long run.
Steps
1. From the Instruments menu, click Simulate instrument. The Configure Simulated
Instrument dialog box appears.
2. Under Logger type, click the logger type that you want to simulate. Under Logger
channels, the types of logger channels on that simulated logger are selected.
3. If you chose one of the XR logger types, do the following:
• Under Logger channels, select any additional channels that you want the simulated
logger to have.
• If you selected any channels for which the Auto-ranging check box is available,
consider enabling the Auto-ranging feature. An auto-ranging sensor automatically
adjusts its gain setting to the best measurement range to display the quantity being
measured.
4. Under Options, choose the options that you want for your simulated logger:
• If you want a visual indication that a logger is running, select the Sampling LED
check box.
• If you want to view live the data samples that you schedule, select the Streaming
check box.
• If you want the logger to convert raw data to printable ASCII characters in an
engineering format before transmitting it, select the Engineering units output check
box.
5. Click OK. The simulated logger appears under Instruments in the Navigator view.
6. Click the new simulated logger. You can work with this logger the same way as you
work with a real RBR logger, including configuring and calibrating it, and logging and
downloading data. For more information, see “Getting started with Ruskin” on page
6.
Multiple loggers, both real and simulated, can be listed in your Navigator view.
Tip: If you want to remove a simulated logger, right-click it and click Remove simulated
instrument. You can also use the Instruments menu.
View information about a logger
You can view static information about a logger at any time as follows:
• In the Navigator view, click the logger that you want. The Information tab in the
Properties view on the right side of the Ruskin window identifies the logger and the kind
of sensors on its channels.
Note: This is the only tab in the Properties view that you can access without any battery
consumption, as indicated by the absence of a battery icon.
November 5, 2010 Rev1.4
8

Configure a logger
Before you enable a logger schedule, you can configure the logger to suit your
requirements.
The instructions to configure a TWR-2050 logger, which measures waves, are different.
If your logger schedule is already enabled when you decide to change the configuration,
you must stop running the schedule, make your changes, and enable the schedule again.
However, any data stored so far on the logger will be lost.
Tip: You can preserve the data by downloading it to a file before you enable the schedule
again.
You can click Revert settings at any time. Note that this action resets the settings on both
the Setup/Basic Configuration tab and the Setup/Schedule tab to those settings used the
last time you enabled the schedule for this logger.
Note: Whenever the Setup tab is in focus, the battery is being used as indicated by the
battery icon on the tab and the animated battery icon in the Navigator view. You can click
the Information tab to save power.
For any XR logger with an external power connector, the logger can be set to start logging
automatically on power-up. The logger sets the time to 2000/Jan/01 00:00:00 on power-up,
and starts logging at 2000/Jan/01 00:00:10. The end time is set to 2004/Jan/01 and the
sampling period that you previously set is used until the power is removed, you stop the
logger, or the memory is full, assuming data storage was not inhibited. If your logger
supports this feature, you can activate it by selecting the Enable streaming data check box
on the Setup/Basic Configuration tab.
Steps
1. While the logger you want is highlighted in the Navigator view, click the Setup/Basic
Configuration tab in the Properties view.
If any settings are not available for your logger, they are grayed out.
2. If you want to connect another instrument to the deployed logger to “listen” to the logger
and take action under certain conditions or while still connected to the logger you want
to view a graphical display of the live data samples taken according to your schedule,
select the Enable streaming data check box. We recommend that you also select the
Enable data storage whilst streaming data check box so that the data will not be lost.
Note: Your logger may not support this feature.
For more information, see “Fetching and streaming data” on page 18.
November 5, 2010 Rev1.4
9

3. If you want your logger to convert raw data to printable ASCII characters in an
engineering format before transmitting it, select the Enable engineering units output
check box.
Note: Although the data stored on the logger is of the highest precision, some precision
may be lost if you use the data in the Plot view because Ruskin converts the data back
to the raw format.
4. If you can see your logger case while it is deployed and want a visual indication that the
logger is running, select the Enable sampling LED check box. This LED does consume
battery power.
The LED will flash when sampling and can be seen through the Delrin© housing.
Note: Your logger may not support this feature; this feature is found on XR and XRX
series loggers.
5. If you want to use the average of multiple readings rather than take a single reading for
each sensor in a sampling period, select the Enable averaging check box and specify
the averaging duration. The averaging duration must be shorter than the sampling
period. For more information, see “Averaging” on page 11.
Notes: 1. Your logger may not support this feature. 2. When you use the thresholding
option, averaging cannot be enabled. 3. Only the averaged value is stored.
6. If you will be profiling while the logger schedule is enabled, select the Enable 6Hz
profiling check box.
Data is collected at six samples per second, and the Sampling period on the Schedule
tab is disabled.
Note: Your logger may not support this feature.
7. If you want to store readings from all your sensors whenever the reading for a particular
sensor reaches a specific threshold, do the following:
•Select the Enable thresholding check box. For information about thresholding,
see “Thresholding and hysteresis” on page 11
•Click the type of sensor in your logger that you want to monitor.
•Type the threshold value and indicate whether this is the upper limit (<) or lower
limit (>) of your threshold.
•Specify how often you want the monitored sensor to be checked. Checking less
frequently will preserve battery power because all the sensors on the logger are
turned off between checks.
November 5, 2010 Rev1.4
10

•If you want to specify a maximum time during which the logger can continue to
store samples while the thresholding condition is no longer met, select the
Enable hysteresis check box and specify the time period. Note that Ruskin
enforces a hysteresis period that is a multiple of your sampling period (Schedule
tab). For more information, see “Hysteresis” on page 12.
Notes: 1. Your logger may not support thresholding and hysteresis. 2. When you
use the thresholding option, averaging cannot be enabled.
Averaging
You can enable averaging of sensor readings when configuring a logger (Properties
view/Setup/Basic Configuration tab or Waves tab). Averaging can give you better statistics
because although extreme readings are included in the averaged readings, they do not
attract undeserved attention.
The averaging duration must be smaller than the value specified for the sampling period
(Schedule tab). The tidal averaging duration must be smaller than the value specified for the
tidal sampling period (Setup/Waves tab). These requirements exist because averaging is
done on all the readings taken during the averaging period, which begins at the start of the
next sampling period.
For example, if your sampling period is five seconds and you want to average the readings
over three seconds, the following happens during each five-second period:
1. For the first three seconds, readings are taken from each sensor on your logger and at
the end of the three seconds; the average value is computed and stored for each
sensor.
2. For the next two seconds, no readings are taken.
Thresholding and Hysteresis
You can enable thresholding when configuring a logger (Properties view/Setup/Basic
Configuration tab). By thresholding, you avoid storing data when conditions are not of
interest to you. This option saves the battery and consumes less memory. It is typically
used when profiling.
When a specified periodic check by the logger shows that the threshold that you specified is
reached, the logger starts recording samples at the frequency specified by the sampling
period (Properties view/Setup/Schedule tab). The logger continues recording samples until
the threshold is no longer maintained.
For example, a logger is programmed to check every 10 seconds whether the temperature
sensor registers less than 20°C and, if so, to take readings from all the sensors every two
seconds. Here is what happens:
November 5, 2010 Rev1.4
11

Time lapsed
(seconds) Temperature Logger action
10 20.9°C Reads temperature and then waits 10 seconds
20 19.8°C Reads temperature and then begins storing all sensor
values every 2 seconds
42 20.1°C Reads temperature and then waits 10 seconds
52 20.5°C Reads temperature and then waits 10 seconds
Note: When you use the thresholding option, averaging cannot be enabled.
Hysteresis
Hysteresis can be enabled only when you also enable thresholding (Properties
view/Setup/Basic Configuration tab). The hysteresis option lets you specify the maximum
time that the logger will continue to store samples while the thresholding condition is no
longer met. After that time lapses, samples are not stored until the next time the logger
checks for the thresholding condition and finds that it is met.
Note that Ruskin enforces an hysteresis period that is a multiple of your sampling period. If
you change the value of your sampling period, the hysteresis value changes to the same
value.
Hysteresis is often used when splashing or wave action is a factor. For example, you
program your logger to take readings only when it is in contact with the water. You use the
thresholding option to check every six seconds whether there is contact. Because the wave
action changes the height of the water surface, the logger fluctuates upon deployment
between being in and out of the water. By enabling an hysteresis value of ten seconds, your
logger continues to store samples while not contacting the water for up to ten seconds at a
time.
November 5, 2010 Rev1.4
12

Time lapsed
(seconds) Water contact Logger action
1-5 Yes Stores samples because threshold is met
6-10 No Stores samples due to hysteresis option
11-13 Yes Stores samples because threshold is met
14-23 No Stores samples due to hysteresis option
24 No Checks for threshold and suspends storing samples
25-30 Unknown Waits before checking whether threshold is met
31 No Checks for threshold
32-37 Unknown Waits before checking whether threshold is met
38-60 Yes Resumes storing samples
Configure a tide and wave recording (TWR-2050) logger
Before you enable a TWR-2050 logger, you can configure it to better suit your
requirements. This type of logger records data for tides and waves, and its configuration is
different from that of the other RBR loggers. For information about configuring the other
loggers, see “Configure a logger” on page 9.
If your logger is already logging data when you decide to change the configuration, you
must stop logging, make your changes, and start logging again. However, any data stored
so far on the logger will be lost.
Tip: You can preserve the data by downloading it to a file before you restart the logger.
You can click “Revert settings” at any time. Note that this action will revert the settings on
any of the Setup sub tabs to those settings used the last time you enabled the schedule for
this logger.
Note: Whenever the Setup tab is in focus, the battery is being used as indicated by the
battery icon on the tab and the animated battery icon in the Navigator view. You can click
the Information tab to save power.
November 5, 2010 Rev1.4
13

Steps
1. While the logger you want is highlighted in the Navigator view, click the Setup/Basic
Configuration tab in the Properties view.
2. If you want to connect another instrument to the deployed logger to “listen” to the logger
and take action under certain conditions, or while still connected to the logger you want
to view a graphical display of the live data samples taken according to your schedule,
select the Enable streaming data check box. We recommend that you also select the
Enable data storage whilst streaming check box so that the data will not be lost.
For more information, see “Fetching and streaming data” on page 18.
3. If you want your logger to convert raw data to printable ASCII characters in an
engineering format before transmitting it, select the Enable engineering units output
check box.
Note: Although the data stored on the logger is of the highest precision, some precision
may be lost if you use the data in the Plot view because Ruskin converts the data back
to the raw format.
4. If you can see your logger case while it is deployed and want a visual indication that the
logger is running, select the Enable sampling LED check box. This LED does consume
battery power.
The LED will flash when sampling.
Note: Your logger may not support this feature.
5. Under the Setup/Waves tab, in the Tidal sampling period box, specify the interval that
you want between samples.
Note: If you change this value, any value in the Wave sampling period box changes
automatically so that it remains the same number of multiples of this value. For more
information, see “Relationship between the tidal and wave sampling periods” on page
15.
6. If you want to use the average of multiple readings rather than take a single reading for
each sensor for a tidal sampling period, do the following:
•Select the Enable tidal averaging check box.
•Specify the tidal averaging duration. The tidal averaging duration must be shorter
than the tidal sampling period. For more information, see “Averaging” on page
11.
•Specify the rate in Hz at which you want to take tidal samples.
November 5, 2010 Rev1.4
14

Note: If you select the Enable wave measurements check box, this rate also applies
to the rate at which wave samples are taken.
7. If you want to take samples of wave bursts, do the following:
•Select the Enable wave measurements check box.
•In the Wave sampling period box, specify the interval that you want between
taking readings of wave bursts. This value must be a multiple of the value
specified in the Tidal sampling period box. For more information, see
“Relationship between the tidal and wave sampling periods” on page 15.
•In the Burst length of the wave box, click the number of samples that you want
to take during a wave burst.
•In the Altitude of instrument (m) box, type the number of metres above seabed
or river bed where the logger will be secured in place.
This value is used when making wave calculations.
•Estimate the mean depth of water in metres.
This value helps predict the range of wave frequencies that can be measured. In
particular, read-only values for wave analysis bandwidth and wave periods will
appear. Ruskin will calculate the actual depth from the measured pressure data
post-deployment.
You can now schedule your logger.
Relationship between the tidal and wave sampling periods
The wave sampling period must be a multiple of the tidal sampling period. Changing the
wave sampling period changes the relationship between the two values because the wave
sampling period becomes a different number of multiples of the tidal sampling period. This
number of multiples is maintained if you then change the tidal sampling period.
Here is an example that you can try:
1. If you set the tide sampling period to 5 seconds, then, set the wave sampling period to
20 seconds (4 multiples of 5).
2. Now change the wave sampling period to 30 seconds (6 multiples of 5).
3. Finally, change the tidal sampling period to 10 seconds.
To maintain the new relationship of 6 multiples, the wave sampling period will change
automatically to 60 (6 multiples of 10).
November 5, 2010 Rev1.4
15
Table of contents