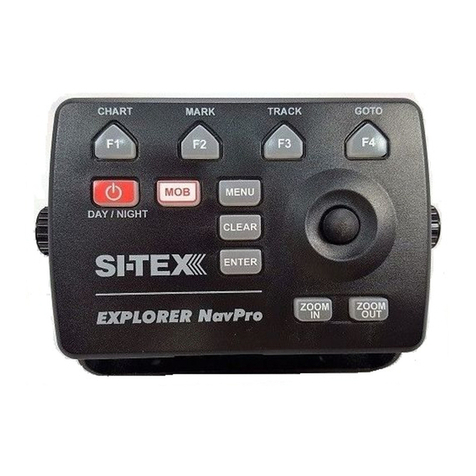
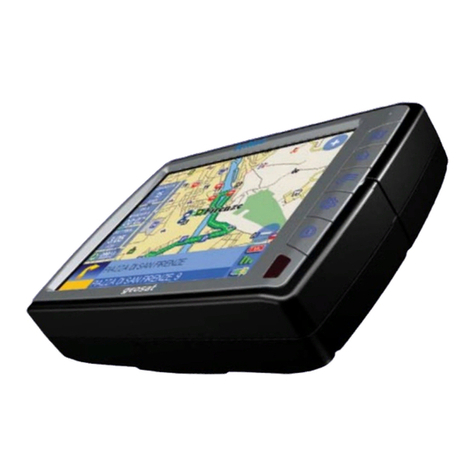
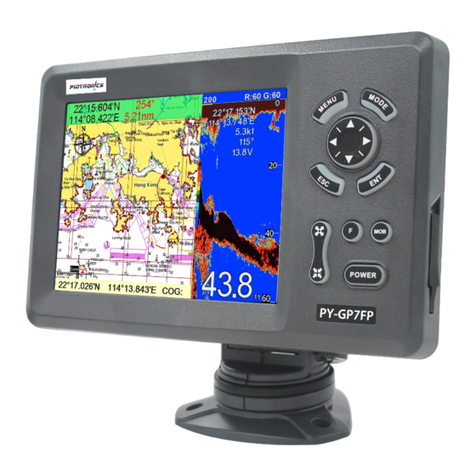
Sitex SNS-1100 User manual

GPS Chart Plotter
USER MANUAL


Contents
About this user manual 7
Introduction 7
Conventions used 7
Manual layout 7
Important information 9
1. Getting started 10
1.1 The keyboard 10
1.1.1 Joystick (cursor key) 10
1.1.2 Dedicated keys 10
1.1.3 Software keys 11
1.1.4 Function keys 11
1.1.5 Software/function keys customization 12
1.1.6 Alphanumeric input procedure 13
1.2 Switching on/off 14
1.3 First setup page 14
1.4 Changing backlight and contrast 16
1.5 Selecting the language 16
1.6 Selecting the chart language 16
1.7 C-map by jeppesen max cartography information 17
1.8 Using c-map by jeppesen data media 18
1.9 Simulation mode 18
1.10 Controlling the display 18
1.11 Navigation to a single destination 22
1.12 A-B function 22
1.13 Range/bearing function 23
1.14 Man overboard (mob) 23
2. Operations 24
3. User setting up 40
3.1 General options menu 40
3.2 Map options menu 41
3.3 Other map congurations 44
3.5 Video mode 49
3.6 Advanced options menu 50
3.6.1 Input/output menu 50
3.6.2 C-link menu 52
3.6.3 Fix & compass menu 52
3.7 AIS 53
3.7.1 AISs system denitions 53
3.7.2 To set the chart plotter for receiving ais 55
3.7.3 AIS menu 55
3.7.4 Quick info on AIS target 56
3.7.5 Soft-key controls for AIS targets 56
3.7.6 AIS report 56
3.7.7 AIS tracks 57
3.7.8 AIS track list window 57
3.7.9 AIS track memory management 57

3.7.10Sart messages handling 57
3.8 C-weather service 58
3.8.1 C-weather service menu 58
3.9 DSC 60
3.9.1 Distress call and position request 60
3.9.2 DSC log page 61
3.9.3 DSC directory page 62
3.9.4 Quick info on dsc icons 62
3.10 Fish nder 63
3.11 Radar 63
3.12 System information 63
4. C-link 64
4.1 C-link serial connection 64
4.2 C-link navigation data transfer 64
4.3 Operations 64
4.4 Quick info 67
5. Fishnder 69
5.1 Setting the internal sh nder on 69
5.2 Understanding the sh nder page 69
5.2.1 Understanding the echogram display 70
5.3 Displaying the sh nder page 71
5.3.1 How to select the sh nder page 72
5.3.2 Fish nder full page 72
5.3.3 Dual frequency page 72
5.3.4 Zoom page 73
5.3.5 Chart/sh page 73
5.3.6 Fish nder and radar pages 74
5.4 Zoom modes 75
5.4.1 The bottom lock zoom 75
5.4.2 The marker zoom 75
5.5 Sounder adjustments with soft keys 76
5.6 Fish nder setup menu 77
5.6.1 Preset mode 77
5.6.2 Gain mode 78
5.6.3 Range mode 78
5.6.4 Depth 78
5.6.5 Shift 78
5.6.6 Bottom range 78
5.6.7 Frequency 78
5.6.8 Interference rejection 79
5.6.9 Sensitivity menu 79
5.6.10Display setup menu 80
5.6.11 Transducer setup menu 80
5.6.12Alarms menu 81
5.6.13Save & load menu 81
5.7 Transducers 81
6. GPS 82
6.1 How gps works 82
6.1.1 Position xing accuracy: hdop 82

7. Maintenance 84
7.1 System test 84
7.1.1 Ram menu 84
7.1.2 Dim menu 84
7.1.3 Media 85
7.1.4 Modem test 85
7.1.5 Serial ports 85
7.1.6 External alarm 86
Terms 87
SNS 700e & SNS 700i 94
SNS 700fe & SNS 700 100
SNS 1100 105
Installing the smart GPS external 111


User Manual - 7
About this User Manual
INTRODUCTION
The chart plotter is a state-of-the-art computerized electronic chart system, designed as a
sophisticated navigation aid. User friendly operations make the chart plotter easy to operate. All
calculations and information necessary for the navigation are performed and displayed on the
screen quickly and accurately providing all of the facilities of a conventional GPS but with the
added benet of a powerful electronic chart display. The cartographic information is obtained
from C-MAP By Jeppesen DATA MEDIA that are available through your local dealer.
For additional information on C-MAP By Jeppesen Cartography visit web site at www.jeppesen.com.
CONVENTIONS USED
Throughout this User Manual, the labelled keys are shown in capital letters enclosed in square
brackets, for example [ENTER]; the software and functions keys are shown in small letters
enclosed in square brackets, for example [Edit].
Menu operations are in bold characters listed by keys sequence with the menu names enclosed
between quotation marks, for example [MENU] + "Alarms" + [ENTER] means: press the [MENU]
key, using the cursor key select the Alarms menu and then press [ENTER].
MANUAL LAYOUT
•Chapter1:GettingStarted
Overview of the controls and how to start using the chart plotter.
•Chapter2:Operations
Description of the operation procedures of the chart plotter in detail.
•Chapter3:UserSettingUp
Set up of the chart plotter, the charting preferences and the GPS options.
•Chapter4:C-LINK
C-Link system is a feature used to share the same navigation data between two chart plotter
units linked via serial I/O port.
•Chapter5:FISHFINDER(SNS700fe/SNS700)
Introduction to the basic information on the internal Fish Finder, its features and use.
•Chapter6:GPS
GPS antenna and set up of the hardware conguration.
•Chapter7:Maintenance
User maintenance guidelines.
•Terms
List of the terms and abbreviations used in the User Manual.
•SNS700e/SNS700i
Introduction to the basic information on SNS 700e/SNS 700i, 7” WVGA chart plotter, its features
and use. Installation of the chart plotter.
•SNS700fe/SNS700
Introduction to the basic information on SNS 700fe/SNS 700, 7” WVGA chart plotter with
internal Fish Finder, its features and use. Installation of the chart plotter.
•SNS1100
Introduction to the basic information on SNS 1100, 11” chart plotter, its features and use.
Installation of the chart plotter.
•InstallingtheexternalsmartGPS
Introduction to the basic information on External Smart GPS Antenna and its installation.

8 - User Manual
IF YOU NEED ASSISTANCE
If your chart plotter does not operate properly, please refer to Chapter 7. Most common operating
difculties can be diagnosed using these tests.
If you still need assistance, call your local dealer, reporting the information available in the
System Information page.

User Manual - 9
ImportantInformation
WARNING
Electronic charts displayed by the chart plotter are believed to be accurate and reliable, but they
are not intended to replace ofcial charts which should remain your main reference for all the
matters related to the execution of a safe navigation. For this reason we would like to remind you
that you are required to carry on board and use the ofcially published and approved nautical
charts.
CAUTION
• Please read through this manual before the rst operation. If you have any questions, please
contact the Company's customer service or your local dealer.
• The chart plotter is not built water proof. Please give attention to avoid water intrusion into the
chart plotter. Water damage is not covered by the warranty.
• Extensive exposure to heat may result in damage to the chart plotter.
• Connection to the power source with reversed polarity will damage the chart plotter severely.
This damage is not covered by the warranty.
• The chart plotter contains dangerous high voltage circuits which only experienced technicians
MUST handle.
• The C-MAP By Jeppesen DATA MEDIA are available from your local dealer.
• Exposure of the display to UV rays may shorten the life of the liquid crystals used in your
plotter. This limitation is due to the current technology of the LCD displays.
• Avoid overheating which may cause loss of contrast and, in extreme cases, a darkening of the
screen. Problems which occur from overheating are reversible when temperature decreases.
WARNING ON SERIAL PORTS CONNECTION
Please be aware that the serial ports are not opto-isolated and then the external device is
electrically connected to the chart plotter. This allows the connection of high speed devices, like
Radar or Fish Finder. If you are connecting a NMEA0183 device and you would like to isolate it
from the chart plotter, you have to add the opto-isolator externally.
CLEANINGPROCEDUREFORTHEPLOTTERSCREEN
Cleaning your chart plotter screen is a very important operation and must be done carefully, as
the window's surface is covered with and antireective coating. The following is the cleaning
procedure: you use a tissue or lens tissue and a cleaning spray containing Isopropanol (a
normal spray cleaner sold for the PC screen, for example PolaClear by Polaroid). Fold the tissue
or lens tissue into a triangular shape, moisten the tip and use the index nger behind a corner to
move the tissue across the surface, in overlapping side to side strokes. If the tissue is too wet,
a noticeable wet lm will be left in its path and you will need to repeat the process. If too dry, the
tissue won't glide easily, and may damage the surface.
NOTE
We will not be liable for errors contained herein, or for incidental or consequential damages in
connection with the performance or use of this material.

10 - User Manual
1. Getting Started
This chapter provides basic information to get you started using the chart plotter; it will help
you in becoming familiar with the chart display and the functions of the controls before you
start using the chart plotter.
1.1THEKEYBOARD
1.1.1Joystick(Cursorkey)
Moves the cursor on the display screen quickly and accurately and in the menu page(s) scrolls
the desired option. If in Navigate (Home) mode, it allows to exit from navigate mode.
1.1.2DedicatedKeys
Common:
[POWER]
• keep it pressed for one second to turn On the chart plotter
• keep it pressed for three seconds to turn Off the chart plotter
• press it to adjust the backlight and contrast of the display
[MOB]
• inserts the MOB (Man OverBoard) on the ship's position
[CLEAR]
• exits from menu or leaves a menu without making changes
• if you are not into a menu, sets the Navigate (Home) mode: the cursor is centered on ship's
position
[ENTER]
• places Marks, Waypoints, destination (if a specic key is missed) and selects many functions,
for example Find; conrms selection
[MENU]
• selects the main menu
• when in chart and data page, keep it pressed for three seconds to customize data elds of the
text area
[ZOOM IN]
• shows more details of a smaller area
[ZOOM OUT]
• shows a wider, less detailed area
Only For SNS 1100
[GOTO]
• selects the Goto function (instead of [ENTER])
[DATA]
• selects preferred screen conguration
[INFO]
• selects the Info function

User Manual - 11
1.1.3SoftwareKeys
The software keys (soft keys) have different functions according to the modes of operation: their
labels for the current functions, located on the front panel, are shown on the screen right above
the keys. Also they are used from the chart screen or from the data pages to select one of the
data pages available to allow faster access to the page selection.
When the chart page is selected, the soft key labels are not shown. By pressing one of the soft
keys their labels for the current functions are shown on the screen immediately above the soft
keys. When the soft key labels are shown, by pressing the associated soft key the relative func-
tion is executed. By pressing [CLEAR] the soft key labels disappear.
1.1.4FunctionKeys
When the cursor is placed over any User Point or any cartographic object, a window containing
the information about the selected object is shown on a variable location of the screen (not
covering the cursor icon). At the same time some Function Keys (up to ve) are shown on the
bottom of the page. The Function Keys are associated to the function that can be applied to the
selected object. Each Function Key shows a number and the name of the function.
For example when the cursor is placed over a Mark, the information window with Coordinates,
Name, Icon and all other Mark information is shown. The following Functions Keys are shown
on the bottom of the map display.
Pressing any numerical keys from [1] to [5], the function associated to the selected number is
executed. Otherwise pressing any numerical key not active (not associated to any function) 3
beeps will be sounded and the Function Keys are kept shown. Pressing [CLEAR] the Functions
Keys are removed from the screen, pressing any other key the Functions Keys will be closed
and the function associated to the pressed key will be executed.

12 - User Manual
1.1.5Software/FunctionKeysCustomization
When the soft keys labels are shown the user can customize them. Pressing and holding down
any of the soft key shows a pop-up window on the top of the soft key pressed that contains all
possible data pages assignable to the soft key pressed.
Move the cursor key up/down to place the selector on the desired item; move the cursor key
to the right or press [ENTER] to set the selected item; move the cursor key to the left or press
[CLEAR] to close the pop-up window.
Thepossiblechoicesare:
CHART [Chart] (Chart Display page)•
NAVIGATION [Nav Data] (Navigation Data page)•
3D ROAD [3D Road] (3D Road page)•
GPS STATUS [Status] (GPS Status page)•
WIND DATA• 1[WindData] (Wind Data page)
GAUGES [Gauges] (Gauges page)•
DEPTH FULL [Depth 1] (Depth Graph Full page)•
DEPTH [Depth 2] (Depth Graph page)•
FISH FINDER [FF Std] (Fish Finder Full page)•
FISH FINDER [FF Dual] (Fish Finder Dual Frequency page)•
FISH FINDER [FF Splt] (Fish Finder Zoom page)•
FISH FINDER [FF+Map] (Fish Finder and Chart page)•
RADAR• 2[Rd Std] (Radar Full page)
RADAR• 2[Rd+Map] (Radar and Chart page)
RADAR• 2[Rd+FF] (Radar and Fish Finder page)
RADAR• 2[Rd+Data] (Radar and data page)
RADAR• 2 [Combo 4] (Radar, Fish nder, Chart and data page)
ADD VIDEOCAMERA• 4[AddVid] (Add screen video image)
ADD VIDEOCAMERA 1• 3[AddVid1] (Add screen video image 1)
ADD VIDEOCAMERA 2• 3[AddVid2] (Add screen video image 2)
VIDEOCAMERA• 4[Video] (Full screen video image)
VIDEOCAMERA• 3[Video 1] (Full screen video image 1)
VIDEOCAMERA• 3[Video 2] (Full screen video image 2)
Fig. 1.1.4 - Example of Function Keys

User Manual - 13
MARK [Mark] (Mark place)•
EVENT [Event] (Event place)•
WAYPOINT [Waypoint] (Waypoint place)•
TRACK [Track] (Track storing activated/deactivated)•
NOTE1 Available For SNS 700e/SNS 700i/SNS 700fe/SNS 700/SNS 1100.
NOTE2 Available For SNS 700e/SNS 700i/SNS 700fe/SNS 700/SNS 1100
NOTE3Available For SNS 1100
NOTE4 SNS 700e/SNS 700i/SNS 700fe/SNS 700.
1.1.6AlphanumericInputProcedure
When editing a Waypoint (see the following picture) or when entering menu information, insert
data by using the visual alphabetical table shown:
The soft keys are now activated to:
[Save] to save when the entry is complete. After pressing [Save] the Soft Keys disappear: press
[Accept] to end the input procedure
[Change] to switch between numeric/non-numeric digits
[Previous] to go back to previous page
[Next]to move to next page
Fig. 1.1.6 - Example of visual Alphabetical table

14 - User Manual
1.2SWITCHINGON/OFF
Before powering On the chart plotter, check for the correct voltage (10-35 volt dc) and the
correct connections with the positioning instrument.
SwitchingOn
[POWER]for1second
In the opening page, underneath the Techmarine logo, you will nd the software version and
type. The next page is the First Setup page (see Par. 1.3) which is activated only when the
chart plotter is turned on for the rst time and after a Master reset. Then the chart plotter will
automatically show the Jeppesen warning page and the GPS Status page. Pressing [CLEAR]
at this stage to activate the cartography page.
SwitchingOff
[POWER]for3seconds
A countdown timer appears on the screen, if you release the key before the countdown timer
reaches zero, the chart plotter will remain On.
1.3 FIRST SETUP PAGE
This menu allows you to congure the chart plotter and the external devices the rst time the
chart plotter is powered On.
This information can be changed at any time either from the General Options menu (see Par.
3.1) or by resetting the chart plotter. Select the correct setup option and press [ENTER], when
complete press [OK]1 to exit.

User Manual - 15
Language The map information will still be displayed in the language of the ofcial
digitalized paper chart.
Chart Language Selects a sub-menu with two items: Language to set the language to display
chart information and Mode to dene how objects are translated.
Distance Unit Selects the unit for Distance among Nm, Sm, Km.
Speed Unit Selects the unit for Speed among Kts, Mph, Kph.
Wind Unit Selects the unit for Wind among Kts, Kph, Mph, m/s, Bft.
Depth Unit Selects the unit among Ft, FM and Mt.
Altitude Unit Selects the unit among Ft, FL and Mt.
TemperatureUnit Selects the unit among °C and °F.
TimeReference Allows switching between UTC or local time, by entering the Local Time
offset.
DaylightSavingTime Sets On/Off the Daylight Saving Time.
TimeFormat Selects the format for the time between 12 and 24 hours.
DateFormat Selects the Date Format between MM-DD-YY (month-day-year) and DD-
MM-YY (day-month-year).
Nav-Aids
Presentation
Allows to set the Nav Aids presentation as US (Draw Nav-Aids using NOAA
symbology) or INTERNATIONAL (Draws Nav-Aids using international
symbology). When selected it affects Lights, Signals, Buoys & Beacons
display.
KeypadBeep Enables or disables the single audio beeps emitted any time the chart plotter
keypad is pressed. If the incorrect key is pressed or the function required
cannot be executed, the chart plotter emits three beeps.
Cursor Speed Selects the Cursor Speed among Low, Medium or High in Chart page or into
menu.
Devices Allows to setup the devices that needs a dedicated port as C-Com, BBFF
50/200, Radar1and AIS 38400.
SimulationMode Allows to setup the simulation data before use the Simulation function
The possible selections are listed in the table below:
NOTE1
Available For SNS 700e/SNS 700i/SNS 700fe/SNS 700/SNS 1100

16 - User Manual
1.4CHANGINGBACKLIGHTANDCONTRAST
You can modify the intensity of the backlight and contrast to make reading easy and comfortable.
Press and immediately release [POWER] (do not press and hold the key, or the "power-off"
message will be displayed!). Two sliders appear on the screen, showing the current settings for
backlight and contrast.
[POWER]+use[Bright-]/[Bright+]toadjustbacklightlevelsand/oruse[Contr-]/[Contr+]
toadjustcontrastlevels+[ENTER]
Now you return to the chart screen with the new backlight and contrast levels retained.
1.5SELECTINGTHELANGUAGE
It is possible to set the language to display menus, data pages, warning/alarm messages, full/
quick info, list of objects found by nd/nearest function, and on charts (such as place’s names,
buoy’s names and so on).
Toselectthelanguageyouwant:
[MENU] + “General Options” + [ENTER’] + “Language” + [ENTER] + select the language you
want + [ENTER]
NOTE If the selected language is not available on cartographic data, English language is used
instead.
CAUTION
Ifyouhaveaccidentalyselectedanunknownlanguage,andyouarenotabletoselect
yourpreferredlanguagepleaseseeChapter7“Maintenance”foraRAMClearoperation:
thechartplotterwillalsoreturnallselections,inparticularlanguage,tooriginaldefault
values.RAMClearoperationwillalsocancelallthesaveddatalikeROUTE,WAYPOINTS,
MARKS,etc.
1.6SELECTINGTHECHARTLANGUAGE
[MENU] + “General Options” + [ENTER’] + “Chart Language” + [ENTER] + select the
languageyouwant+[ENTER]
The possible choices are listed in the table below:
Language: Allows setting the language to display chart information. The language
is chosen among the list of languages available on the cartographic data
(DATA MEDIA or embedded charts).
Mode: Denes how objects are translated. It is possible to choose between the
three following options:
•Off
Uses the same Language used for LANGUAGE. If the selected language is
not present on the objects information, English is used instead;
•English
Always uses English;
•Local
Uses the rst Local language present on data. If no Local language is
available, English is used instead.

User Manual - 17
NOTE a. When User Interface Language is changed, Chart Language settings are set as
follows: MODE is set to Off and Chart Language is set as the User Interface Language selection
if available on the chart data, otherwise is set to English.
b. If the cartographic data is changed (for example the DATA MEDIA is removed or replaced),
Chart Language settings should be veried and if necessary changed.
1.7C-MAPbyJeppesenMAXCARTOGRAPHYINFORMATION
MAX is a major evolution of the product technology. Key points are:
Data Features
ISO Certication (electronic chart production process with quality certication) •
Extra Large Coverage (all the C-MAP By Jeppesen electronic chart detail and a huge coverage•
without having to change data media)
Ofcial data source (data based on use of ofcial data sources)•
Detailed World Background (worldwide background chart with details)•
Depths & Land Elevation (color shading of sea depth and land altitude for improved chart•
reading)
Bathymetric & Spot Soundings (additional Data Base with depth and bathy information for an•
extraordinary view of the seabed depth)
Detailed Port Plan (complete port and marina charts with detail)•
Search & Find (quickly locates chart contents and objects)•
Tides Preview (dynamic simulation of tides)•
Dynamic Currents (current arrows dynamically display direction and speed)•
Dynamic Nav-Aids (displays Nav-Aids in true color and with real interval lighting)•
Port Info (all the information of the available services in the ports and how to contact them)•
Enhanced Port Info & Roads (details of the available facilities and services in ports and•
surrounding areas)
Object Info (indicates restricted area details and related information)•
Quick Info (full information on objects, buoys, wrecks, shoals and Nav-Aids)•
Photos & Diagrams (high denition pictures of ports, piers, bridge diagrams and nav-aids)•
Multilanguage Support (displays charts in the local character set)•
True-Type Font (improves text on chart for optimal reading)•
Presentation Features
Clear View (advanced legibility techniques providing more chart data on the screen)•
Clear Info (sophisticated “Human Dictionary” to translate Nav-Aid abbreviations found on paper•
charts)
Dynamic Nav-Aids (an innovative and dynamic presentation mode)•
Flexi-Zoom (increased Under and Over Zoom between chart levels, resulting in optimal scale•
display for any situation)
Dynamic Elevation Data (optimized palettes including the NOAA color palette)•
Perspective View (“Real World” perspective view of the chart, updated real-time during•
navigation)
Smooth-Zoom (smooth transition of cartographic levels)•
Enhanced Turbo-Zoom (extra fast cartography level change displaying the most important•
cartographic objects)
Enhanced Mixing Levels (seamless data presentation)•
Off-line redraw (cartography level transition without image construction)•
Cartographic Data related Features
Guardian Alarm (automatic control and alarm over obstacles on charts in front of your boat)•
Safety Toolbar (interactive alarm system for situational awareness on screen)•
Safety Route Check (sophisticated function checking dangerous objects along your navigation•
route)

18 - User Manual
1.8USINGC-MAPByJeppesenDATAMEDIA
The chart plotter has a built-in world map. To use the chart plotter as a navigation aid, DATA
MEDIA with detailed information for the area you wish to navigate are required. See the technical
details of your chart plotter for inserting/removing DATA MEDIA procedure.
NOTE During normal operations the DATA MEDIA should not be removed since the chart
plotter may lock up.
1.9 SIMULATION MODE
The built-in Simulator function allows you to become procient in the use of the chart plotter.
It simulates the reception of the navigation data (Lat/Lon, Course, Speed, date, time). The
simulated ship’s position is placed at the current cursor position by the time the simulation is
activated.
TostarttheSimulator:
Place the cursor at your desired position + [MENU] + “Advanced Options” + [ENTER’] +
“Simulation Mode” + [ENTER] + “Simulation Mode” + [ENTER] + “On” + [ENTER]
YoumightinserttheSpeed,Heading,dateandtimevalues:
[MENU] + “Advanced Options” + [ENTER’] + “Simulation Mode” + [ENTER] +
“Speed”/”Heading”/”Date”/”Time” + [ENTER] + enter values + [ENTER]
To select the Cursor Control in Chart page use the cursor up/down to adjust the Speed and
the cursor left/right to adjust the Course:
[MENU] + “Advanced Options” + [ENTER’] + “Simulation Mode” + [ENTER] + “Cursor Control”
+ [ENTER] + “On” + [ENTER]
1.10CONTROLLINGTHEDISPLAY
This paragraph describes how to change the display mode and how to move around the chart
by changing the chart scale.
Changing Display Mode
[MENU] + “Page” + [ENTER]
SNS1100:
[DATA]
An icons menu appears on the screen: it shows the available pages.
Move the cursor to select the page you want and the press [ENTER]: the selected page (or
another icons menu1) appears.
In the following gures examples of pages are shown. Please notice that for some chart plotters
the boxes position may differ depending on the conguration chosen.
Fig. 1.10 - Example of Page Selection menu

User Manual - 19
FixCoord. Fix Coordinates HDG Compass Heading
Dest Destination ID Temp Water Temperature
TTG Time To Go
(Fix to Destination)
Total Log Total distance the vessel
has travelled
DST Distance To Go
(Fix to Destination)
Trip Log Distance the vessel has
travelled
since the trip log was
reset
BRG Bearing
(Fix to Destination)
Log Spd Ship Speed relative to the
water
CST Course to steer Date Date and Time
STR
SOG Speed Over Ground SET Drift direction
COG Course Over Ground Drift Drift speed
Icon Show icons: Navigation/
Charting and GPS receiver
status
EBL&VRM Electronic bearing line &
Variable Range Maker
SCALE Chart Scale Tracks Track status, free
memory
XTE Cross Track Error AuxTemp Auxiliary Temperature
VMG Velocity Made Good STW Speed Through Water
Depth Depth from Transducer Range Mode Radar
Visual COG Bar
x is received
x is not received
a Differential
GPS signal is received
WAAS correction is received

20 - User Manual
Depth Value Depht Graph
Depth Value
ExampleofDepthGraphpage ExampleofDepthGraphFullpage
ExampleofNavigationDatapage
Exampleof3DRoadpage
Fix Status
Fix
Coordinates Date and UTC (U)
or Local (L) Time
Alphanumeric
identier of the
TARGET, if set
Distance
COG
SOG
Bearing
Cross
Track Error
CDI:
Course
Deviation
Identicator
CDI:
Course
Deviation
Identicator
Alphanumeric
identier of the
TARGET, if set
This manual suits for next models
1
Table of contents
Other Sitex GPS manuals

