Solar-Log 1000 User manual

1
User Manual V.3.5.3
Solar-Log™
EN

2
Publisher:
Solare Datensysteme GmbH
Fuhrmannstr. 9
72351 Geislingen-Binsdorf
Germany
International support
Tel.:+49 7428 9418 -640
Fax:+49 7428 9418 -280
e-mail: [email protected]
Italy
Technical support: +39 0471 631032
e-mail: [email protected]
France
Technical support: +33 97 7909708
e-mail: [email protected]
Switzerland
Technical support: +41 565 355346
e-mail: switzerland-[email protected]
United States
Technical support: +1 203 702 7189
e-mail: [email protected]

3
Table of Contents
1 General Information..................................................................................................... 6
1.1 The necessary steps for precision monitoring of your PV plant with the Solar-Log™...................... 6
2 Operating via a web browser within your own network............................... 7
2.1 Requirements................................................................................................................................................................. 7
2.2 Overview.......................................................................................................................................................................... 8
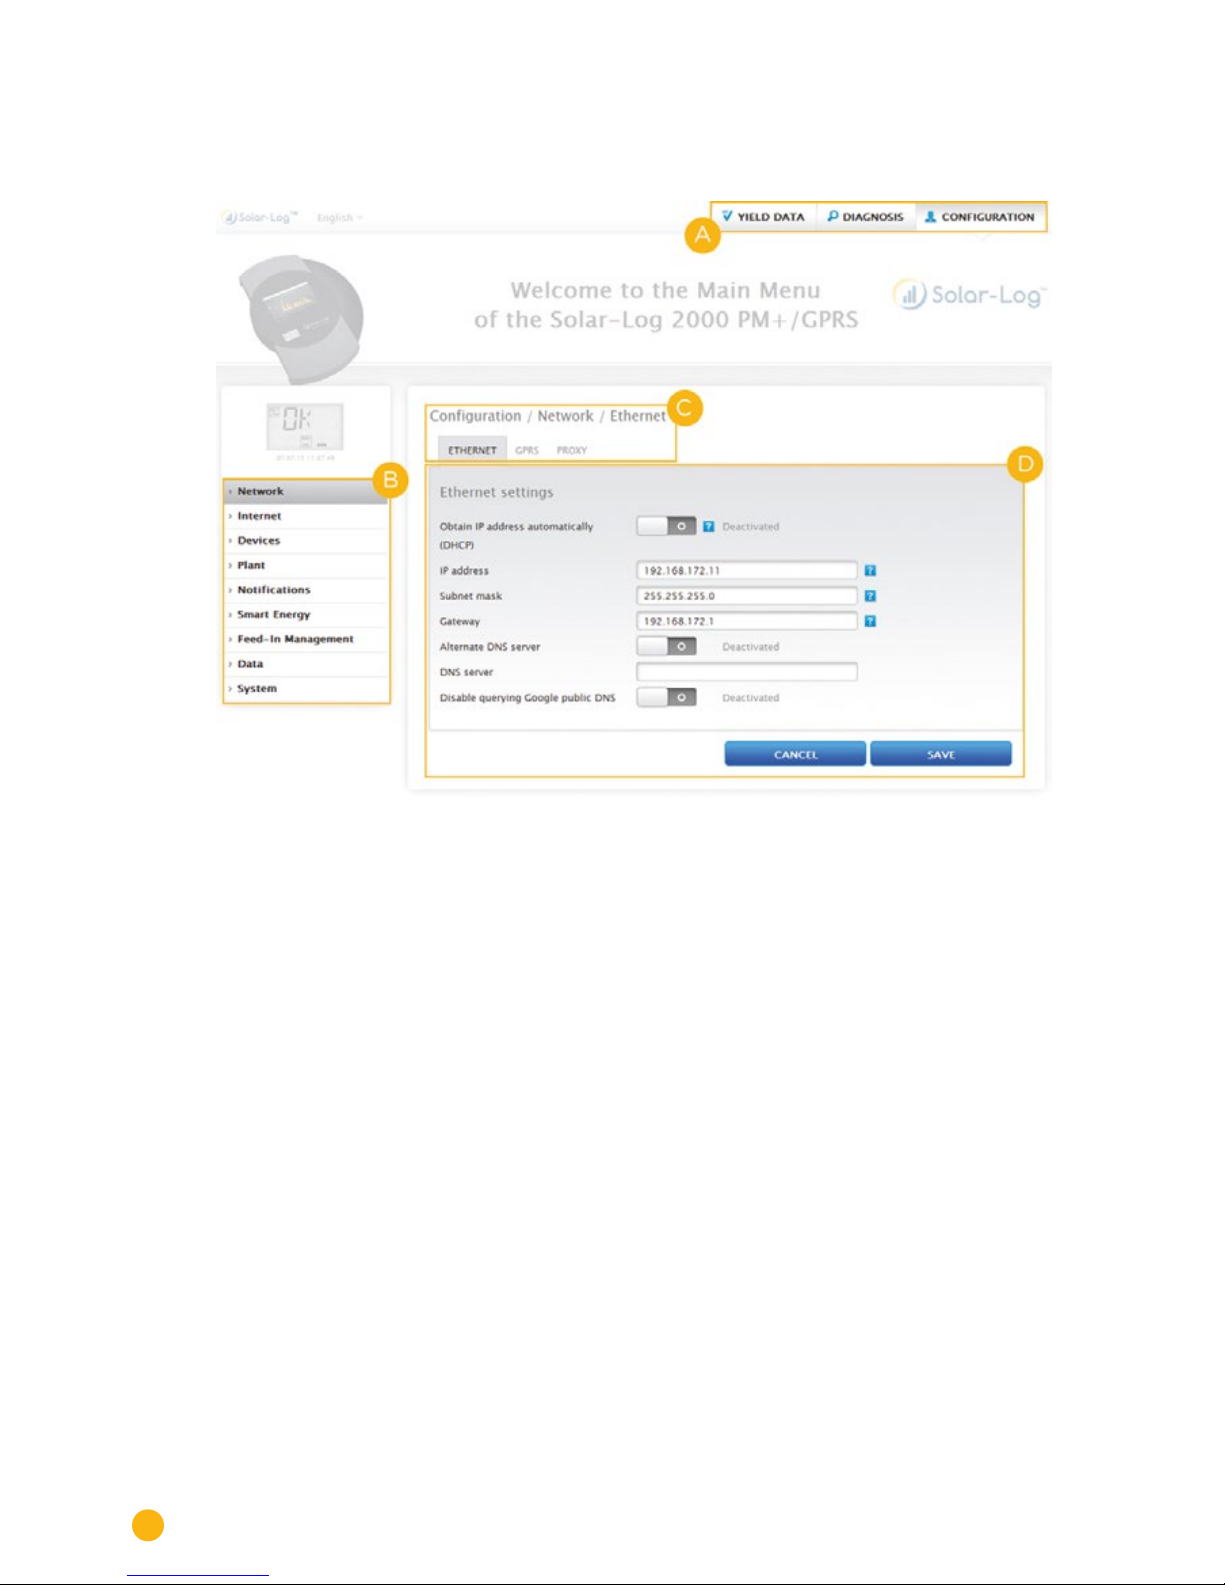
2.2.1 General Navigation.......................................................................................................................................................8
2.3 Accessing the Start page........................................................................................................................................ 13
2.4 Accessing Yield Data ................................................................................................................................................ 15
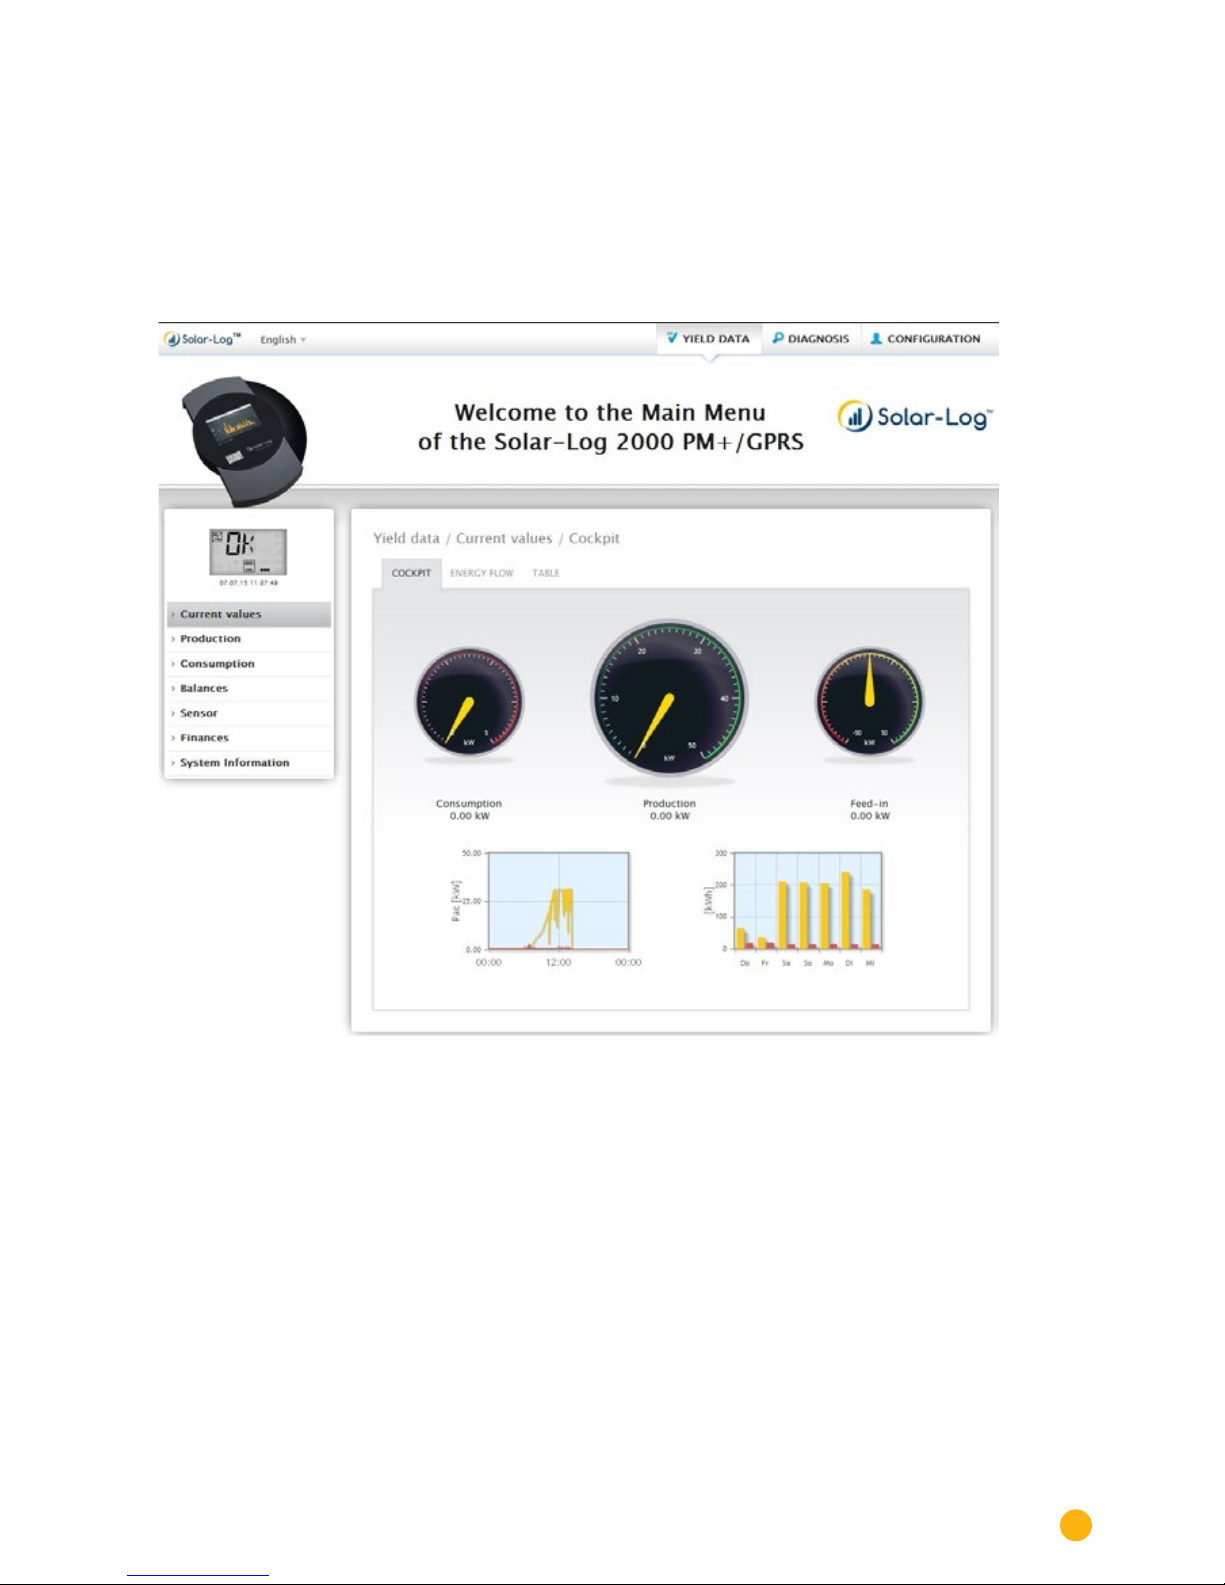
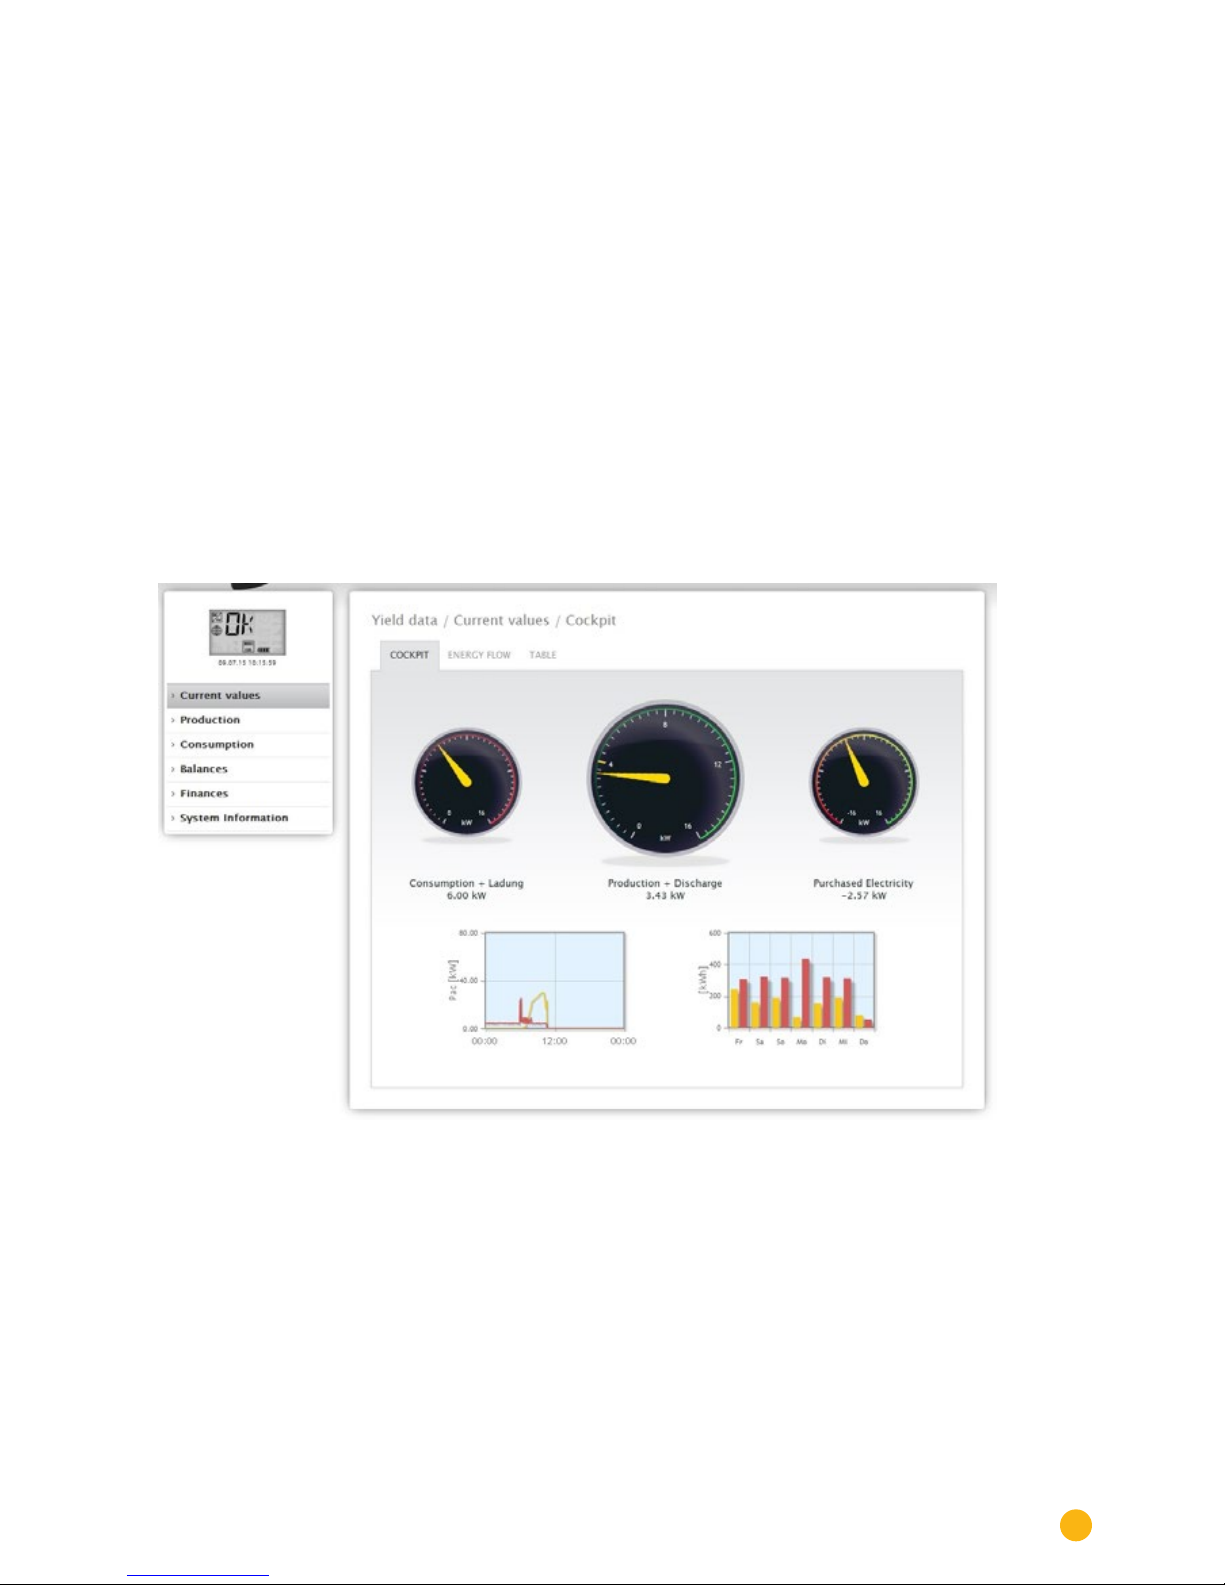
2.4.1 Current values .............................................................................................................................................................. 15
2.4.2 Energy flow ................................................................................................................................................................... 17
2.4.3 Table................................................................................................................................................................................. 18
2.5 Production .................................................................................................................................................................... 19
2.5.1 Day view ........................................................................................................................................................................20
2.5.2 Month view ................................................................................................................................................................... 22
2.5.3 Year view ....................................................................................................................................................................... 24
2.5.4 Total view ...................................................................................................................................................................... 25
2.6 Consumption............................................................................................................................................................... 26
2.7 Balances........................................................................................................................................................................ 32
2.7.1 Day balance.................................................................................................................................................................. 34
2.7.2 Month balance............................................................................................................................................................. 36
2.7.3 Year balance................................................................................................................................................................. 37
2.7.4 Total balance................................................................................................................................................................ 38
2.8 Finances........................................................................................................................................................................ 39
2.9 Sensor............................................................................................................................................................................. 41
2.10 System Information .................................................................................................................................................. 42
2.11 Accessing Diagnostic values................................................................................................................................. 43
2.11.1 Inverter Diagnostic ....................................................................................................................................................43
2.12 Battery Diagnostic.................................................................................................................................................... 47
2.12.1 Accessing Event logs................................................................................................................................................ 52
2.12.2 Accessing Notifications ........................................................................................................................................... 53
2.12.3 Accessing Feed-In Management.......................................................................................................................... 55
2.12.4 Accessing the SCB Monitor (only Solar-Log 2000).....................................................................................64
2.12.5 Accessing components............................................................................................................................................ 65
2.12.6 Smart Energy............................................................................................................................................................... 68
2.12.7 Accessing CSV Export.............................................................................................................................................. 75
2.12.8 Accessing Support..................................................................................................................................................... 75
3 Notifications .................................................................................................................77
3.1 Yield E-mail.................................................................................................................................................................. 77
3.1.1 Explanation of the individual E-mail Functions:............................................................................................. 79

4
3.2 Performance Monitoring......................................................................................................................................... 82
3.2.1 Performance Monitoring Notification.................................................................................................................84
3.2.2 Calculation and Explanation of the Notification............................................................................................ 86
4 Operating the Solar-Log 1200 and 2000 via Touch Display.....................87
4.1 Navigating from the touch screen...................................................................................................................... 87
4.2 Accessing the Dashboard ...................................................................................................................................... 89
4.3 Access Energy flow .................................................................................................................................................. 90
4.4 Accessing the Energy Balance.............................................................................................................................. 91
4.5 Start Smart Energy................................................................................................................................................... 92
4.6 Accessing Forecast................................................................................................................................................... 93
4.7 Accessing Yield history........................................................................................................................................... 94
4.8 Accessing Environmental performance............................................................................................................ 94
4.9 Accessing the USB menu ....................................................................................................................................... 96
5 Pac Correction Factor ..............................................................................................98
5.1 Calculating the PAC correction factor .............................................................................................................. 98
6 Using Solar-Log WEB.............................................................................................100
6.1 Registering for Solar-Log™ WEB "Classic 2nd Edition" ........................................................................... 100
6.2 Accessing Plant data ............................................................................................................................................. 103
6.3 Accessing Yield Data ............................................................................................................................................. 108
6.3.1 How to navigate between dierent overviews............................................................................................. 108
6.3.2 The meaning of the values in the overviews ................................................................................................. 108
6.3.3 Daily Overview .......................................................................................................................................................... 109
6.3.4 Monthly Overview.......................................................................................................................................................111
6.3.5 Annual Overview ........................................................................................................................................................112
6.3.6 Total Overview.............................................................................................................................................................113
6.3.7 Accessing and filtering the Event log ................................................................................................................114
7 Cleaning and care...................................................................................................... 116
7.1 Cleaning tips ............................................................................................................................................................... 116
7.2 Care tips........................................................................................................................................................................ 116
8 Notifications on the LCD Status Display (Solar-Log 300, 1200 and 2000) ....... 117
8.1 Meaning of the symbols on the LCD display.................................................................................................. 117
9 Disposal........................................................................................................................120

5
10 Technical Data (Solar-Log 300, 1200 and 2000).......................................................... 121
11 List of Figures ............................................................................................................ 128

6
General Information
1 General Information
This user manual is intended to assist you in the operation of the Solar-Log™. The yield data from the So-
lar-Log™ can be displayed in several ways:
• via a web browser in a local network (LAN) (Chapter 2)
• via the display (touch screen: only Solar-Log 1000, 1200 and 2000) directly on the device (Chapter
4) or
• via the Internet (Chapter 6)
Our product documentation is being constantly updated and expanded.
The current versions of the documents can be downloaded from our website:
www.solar-log.com.
The descriptions in this manual refer to firmware version 3.5.3
Security informa-
tion!
Update the Solar-Log™ immediately to firmware 3.5.3 build 86 to protect it from
security risks and define a user password.
1.1 The necessary steps for precision monitoring of your PV plant with the
Solar-Log™
• Connecting and detecting inverters, refer to the "Inverter Connection Manual" and the "Configur-
ing Connected Devices" chapter in the Installation Manual.
• Refer to the chapter "Configuring Connected Devices" in the Installation Manual for the configura-
tion of inverters, generator power, MPP trackers and module fields.
• For configuring the notification function and status messages from the inverter, refer to the "Con-
figuring Notifications" chapter in the Installation Manual.
• For activating and configuring performance monitoring, refer to the "Configuring Connected De-
vices" chapter in the Installation Manual.
Note!
The Solar-Log needs a continuous supply of electricity to avoid data loss and to
ensure precision monitoring of the PV plant

7
Operating via a web browser within your own network
2 Operating via a web browser within your
own network
2.1 Requirements
Information
For faster access, enter "solar-log" in the address bar of the web browser and
create a bookmark.
In a local network (LAN)
To operate the Solar-Log™ via a web browser, you will need to be on a computer that is connected to the
same local network (LAN). This computer will also need to have a modern web browser installed on it.
The Solar-Log™ unit also has to be connected to this network with the proper network settings.
Via the Internet
In addition to a computer with a web browser, you need an active Internet connection as well as a user
account on a server.
To set up a user account, please contact your installer or see our website for more information:
http://www.solar-log.com/en/products-solutions/solar-log-web.html
Note!
Requests and control commands are sent to the inverters, battery systems and in-
telligent appliances via the network interface. For this reason, the network should
always be available (24/7). If the Solar-Log™ is connected via WiFi, we recom-
mend deactivating the overnight shutdown function.

8
Operating via a web browser within your own network
2.2 Overview
2.2.1 General Navigation
Fig.: Navigation designations
The start page contains the following sections:
• Header bar (A)
• Left navigation (B)
• Tabs (C)
• Configuration page (D)
Header bar
The header contains three main sections:
• Yield data:
Here you will find your plant's yield overview within certain periods of time such as day, month,
year and the total yield to date.
• Diagnostics:
Here you can view the fault and process messages while filtering them according to specified crite-
ria.
• Configuration:
Here you can change the device settings as required.
Left-side navigation menu
Depending on the tab selected, you can access additional functions from the navigation menu (left-side).

9
Operating via a web browser within your own network
Tabs
Additional configuration sections appear according to the function selected.
Configuration Page
Here you can make necessary configurations for the optimal monitoring and evaluation of your plant. You
can also view information on the power output, yields and the device.
Log in button
You can entered a password protected section by clicking on the log in button (at the bottom right corner
of the screen) and entering your user and password. On the right side on the bottom, there is a blue line
next to the log in button which indicates if you are logged in and with which user level. (Refer to the Ac-
cess Control section for more information)
Fig.: Log in button with selection box
Hide arrow
The "Hide Arrow" (on the right of the header bar) allows you to increase the amount of the page displayed
in the browser by hiding the Welcome header.
Fig.: Header bar with the "Hide Arrow"
New Firmware
A notification is sent via the Web browser when a new firmware is version available; a green triangle with
an exclamation mark is displayed at the top in the status line. (See illustration: Signal for new firmware)
Fig.: Signal for new rmware
Note!
The Automatic Firmware Update Check has to be activated in the Configuration |
System | Firmware menu to use this function. (See illustration: Automatic Firmware
Update Check with notification text displayed)

10
Operating via a web browser within your own network
Fig.: Automatic Firmware Update Check with notication text displayed
The following notification text is displayed by clicking on the question mark:
"This settings allows firmware versions with critical errors to be automatically updated. However, generally,
this setting only indicates that a new firmware version is available (green exclamation mark at the top).

11
Operating via a web browser within your own network
Clicking on the green exclamation mark in the header displays the following window:
Fig.: Window displayed indicating that a new rmware version is available
Selecting "OK" redirects you to the page of the Solar-Log™ for firmware updates. Selecting "Cancel" closes
the window.
Access control
Access protection for different parts of the Solar-Log™ can be configured in this menu. The following
sections can be restricted with a pin code or password.
• Access protection for the display
• Access protection for the browser menu
• Displaying advanced configuration
Access protection for the display (only Solar-Log 1000, 1200 and 2000)
A pin code can be activated to restrict access to the Solar-Log™'s display. The pin code may contain a
maximum of 8 numerical digits.
Access at the display can be restricted for the entire display or just the settings section.
Procedure:
• Enter the pin code.
• Enter the pin code again.
• Select restricted Sectionsby checking them.
• SAVE the settings.

12
Operating via a web browser within your own network
Access protection for the browser menu
In this section, the following parts of the Solar-Log™'s browser menu can be restricted with a password:
• User
General access to the Browser menu
• Installer
Access to the Configuration menu
• Feed-in management
Access to the Configuration | Feed-in Management menu
The default password for access to the Feed-in Management menu is PM. Access for users and installers is
not restricted.
Note
We advise installers to discuss with their customers the scope of the settings in the area
of feed-in management, to block the configuration menu using a password and to assign
an individual password.
Procedure
• Activate the password restriction for the desired menus.
• Enter a secure password for each of the menus.
• Enter the password again.
• SAVE the settings.
Security informa-
tion!
Update the Solar-Log™ immediately to firmware 3.5.3 build 86 to protect it from
security risks and define a user password.

13
Operating via a web browser within your own network
2.3 Accessing the Start page
Start your web browser and enter "solar-log" in the address bar of the web browser or select the book-
mark in the browser's navigation bar. If there are several Solar-Log™ devices connected to the network,
enter http://solar-log-xxxx in the address bar. Here "xxxx" stands for the last 4 digits of the serial number
of the Solar-Log™.
• The welcome screen is displayed.
Fig.: Welcome screen
From the start page, the following navigation menu can be selected from the header bar:
• Yield data
• Diagnostics
• Configuration
The subsections in the in the tabs:
• Cockpit
• Energy flow
• Table
These are also located on the left side of the of the VLCD Display (see "VLCD Display" section for more
details) and in additional sub-menus (depending on connected the devices) and as a selection in the main
navigation menu.

14
Operating via a web browser within your own network
VLCD Display
The VLC Display is located above the left navigation menu and displays the notifications from the So-
lar-Log™in the form of codes and symbols in addition to the date and time. The codes and symbols corre-
spond to those for the LCD display. (Refer to the illustration "VLCD Display" and the chapter "Meaning of
the symbols on the LCD display")
The notifications are in real-time and are identical to those on the Solar-Log™ LCD Display. (Solar-Log 300,
1200 and 2000) (Also refer to the chapter "Notifications on the LCD Status Display")
Fig.: VLCD Display

15
Operating via a web browser within your own network
2.4 Accessing Yield Data
Access the yield data from the header bar.
The following options can be selected from the left-side navigation menu.
• Current values
• Production
• Consumption (only appears when a consumption meter is connected)
• Balances
• Finances
• Sensor (only appears when a sensor is connected)
• System Information
2.4.1 Current values
The Cockpit tab can be automatically selected from the Current values . the Dashboard view of the plant
includes the following values:
Fig.: The plant's current values (cockpit view)
• Consumption (only when consumption meters are connected). This displays the current consump-
tion.
• Production (power generated by the plant) + discharge *only with a connected battery system)
displays the current production and battery discharge.
• Feed-in amount (only when meters are connected). This displays the power output that is currently
being fed into the grid.
There are two graphs located below the Dashboard display:
• The current day curve (graph on the left). There is also the option to display the previous five days
as a curve in this graph. Therefore, just click on the day value in the graph on the right.

16
Operating via a web browser within your own network
• The current day value as well as those from the previous 5 days (graph on the right). Move the
mouse above one of the bars to display the day value. Click on one of the bars to have it display in
the graph on the left as a curve.
Additional tabs can be selected in this view:
• Energy flow
• Table
Note
If the Solar-Log™ is just used as a consumption monitoring tool, the menu is limited
to Current values, Consumption and System information.
All of the other menus are hidden.
Note
When only consumption meters are connected to the Solar-Log™, a large con-
sumption tachometer is displayed instead of the production tachometer in the
Current values | Cockpit menu.

17
Operating via a web browser within your own network
2.4.2 Energy flow
The plant is displayed as a flow graphic in the Energy flow tab.
Fig.: Example of a plant with an energy ow
Depending on the particular devices connected, the following values are displayed in the flow graphic in
real time:
• Production (W)
• Consumption (W)
• Grid fed / purchase from grid (W)
• Battery Status
• Charge Status (%)
• Charge / Discharge Output (W)
Note:
When a battery meter is connected, the value for the battery's charge status cannot be read. That is
why for the presentation of energy flows that the charge status is displayed with n/a and the charge
with 0 W.
Energy Flow Color Key
• Production (W):
• Green, energy is being generated.
• Gray, energy production is not active.
• Consumption (W):
• Red, energy is being consumed.
• Grey, no active consumption.
• Grid fed / purchase from grid (W)
• Red, energy is being purchased from the grid.
• Green, energy is being fed into the grid.
• Gray, no energy transfer in either direction with the grid.
Battery:
• Charge Level (%):
• Red, battery is being charged.
• Discharge (W)
• Green, battery is being discharged.

18
Operating via a web browser within your own network
2.4.3 Table
The output recorded from the connected devices is displayed as a table in Table tab.
Fig.: Table with the recorded output from an example plant
Depending on the particular device connected, the following values are displayed:
• The current output from each individual inverter.
• The total current consumption as measured by the consumption meters.
• The current irradiation per m2 as measured by the sensor.
• The values from the battery with the columns Charge/Discharge, Charge Level (%) and Status.

19
Operating via a web browser within your own network
2.5 Production
You can select a graphic display of your plant's production from the Production menu.
Fig.: Graphic display of the plant's total production
From this display, you can select the following tabs:
• Day
• Month
• Year
• Total
You can select to display the view as a graph or table. The values displayed in the graph or table depend
on the view selected.
Note
The auto scaling option always scales the graphics up as much as possible. The
auto scaling can be manually disabled for the respective graphics. Then the scaling
is done based on the value defined in the device configuration. Please refer to the
the chapter on configuring inverters in the Installation Manual.
The selected section can be enlarged by clicking on the graphic and dragging it.

20
Operating via a web browser within your own network
2.5.1 Day view
The Day tab displays the current day as a curve graph. The values Output (W) and Yield (kWp), on the
top left of the diagram key, can be selected and deselected at anytime with a left-click to display individual
values (curve) or to display or hide all values (curves). With a right-click, all of the values (curves) other
than the one selected can be hidden.
The different values throughout the day can be displayed by moving the mouse along the curve.
Fig.: Daily View of the Production Graph with the Auto Scaling activated
The following data is graphically displayed in the production day:
• Production (kWh) (If the daily yield value is modified with the data correction function, the modifi-
cations are displayed in brackets.)
• Target (kWh)
• Actual (%):
This manual suits for next models
2
Table of contents
Other Solar-Log Measuring Instrument manuals

Solar-Log
Solar-Log PRO380 User manual

Solar-Log
Solar-Log PRO380 User manual

Solar-Log
Solar-Log 200 User manual

Solar-Log
Solar-Log PRO1 User manual

Solar-Log
Solar-Log PRO2 User manual

Solar-Log
Solar-Log PRO380-CT User manual

Solar-Log
Solar-Log 2000 User manual

Solar-Log
Solar-Log PRO380-CT User manual

Solar-Log
Solar-Log PRO1 User manual

Solar-Log
Solar-Log 300 Instruction manual