Making a Recording
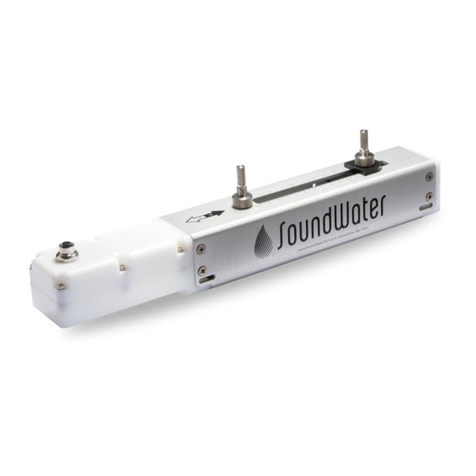
• Connect to the meter with the Orcas App.
• Tap the Data Logging button to access the data logger features.
• Using the slider bar in the app’s data logger setup view,
set the recording time.
(See Explanation of Recording Times on the next page.)
• Tap “REC” to start the recording. Data will start recording on the meter.
You can disconnect the mobile app during recording. The meter will
turn off when done to save power, unless still connected to the app.
• To stop recording prior to completing the time period, connect the
Orcas App to the meter, tap the Data Logging button, and tap “STOP.”
The status of the data logger is indicated by the color and text of the data
logger setup button, located in the measurement view. If data logger is
active, the button is outlined in red, shows a red disk drive, and displays
the text “in progress.” If the data logger is completed, the button is out-
lined in green, shows a green disk drive, and displays the text “complete.”
The data logger setup view also displays the remaining recording time for
conveniently checking progress of data logging.
Uploading Data
Data is stored on the flowmeter and may be retrieved at any time. To
upload data, the data logger must be either complete or stopped and
the app must be connected to the flowmeter. Data is uploaded using the
“Share” button located to the right of the “REC” button. Uploading the
maximum sized data set may take up to / minutes.
If you want to quickly review your data at any time, tap the “share” button,
and then tap Quick Look (iOS devices). This displays the data log in a
spreadsheet for immediate viewing on your mobile device.
Sharing Data
You only need to upload the data log once from Orcas. Once the data
is uploaded, it may be shared any number of times without additional
uploading until a new data log is started.
Tap the “Share” button to share the data by a number of methods: email,
text, AirDrop, etc. Shared data is formatted in a CSV file (comma delimited
file). The file name is unique and contains both the date and time that the
data log was started as well as the location name. Setup information such
as the date and time the data log was started, the number of samples,
sampling period, and location name are located at the top of the data file.
The data is arranged in rows, where each row contains a single flow
measurement including sample number, time stamp, flow rate, velocity,
volume, and quality. The data file can be viewed or printed as a text file
or formatted using most spreadsheet and database programs, such as
Microsoft®Excel or Access.
Operation
Active data logging
session running.
Data logging session
complete.
Upload data by tapping
the “Share” button.
Tap “Quick Look”
for immediate viewing
of your data.
NOTE:
The app must be connected to
the Orcas in order to share the
data or view it with Quick Look.
1-509-899-7838 :: soundwatertech.com


