SpectraCrop Plant Vitality and P-Tester User manual

1
User Manual for
SpectraCrop Plant
Vitality and P-Tester

2
Table of Content
1. Terms and Conditions ............................................................................ 3
2. Introduction........................................................................................... 4
3. SpectraCrop Plant Vitality and P-Tester ................................................. 6
3.1 Flow Chart......................................................................................... 6
4. How to Perform a Measurement ........................................................... 8
5. The SpectraCrop App ........................................................................... 10
5.1 New................................................................................................. 10
5.2 List .................................................................................................. 13
5.3 Map................................................................................................. 18
5.4 User ................................................................................................ 19
6. How to Use the P-tester....................................................................... 21

3
1. Terms and Conditions
The Plant Vitality and P-Tester is a complicated apparatus using sophisticated algorithms to predict
the vitality and P status of plants. Correct interpretation of results requires knowledge to the
possibilities and limitations of the technique.
The P-tester is introduced on the market in a tightly controlled program running in the growing
seasons of 2017-18 and 2018-19, where only a limited number of devices are offered to selected
users. Implementation of a trial and introduction period allows the team behind SpectraCrop to
adapt and improve hardware and algorithms behind the P-tester under variable field conditions
and in different crop and plant species, for the benefit of all future users.
Purchase of the instrument is therefor offered under the following conditions:
1. Use of the instrument must happen in accordance with the user manual and users must be
aware of the limitations of the technique.
2. Data obtained by the P-tester are automatically stored on a server owned by SpectraCrop.
To aid in future development and upgrades of hardware and algorithms, users agree that
all collected data are available to SpectraCrop. Data will not be handed over to any third-
party by SpectraCrop.
3. SpectraCrop cannot guarantee the accuracy of the measurements and cannot be held
responsible for any errors or losses occurring as a result of measurements, obtained by the
P-tester.
4. SpectraCrop cannot guarantee full functionality of the cloud server and users must accept
that down-time periods might occur.
5. Users agree that publication of any result in any format obtained by the P-tester must be
approved by SpectraCrop during the trial and introduction period running until the end of
the growing season 2019 (31/9-2019). Guidance in use and in interpretation of data during
that period is offered as a free service.

4
2. Introduction
Congratulations on your new Plant Vitality and P-Tester from SpectraCrop. With the P-tester, you
can perform measurements on plants directly in the field, and in seconds determine whether the P
nutritional status is adequate. The handheld device transmits the readings directly to your
smartphone (iPhone). With the use of easily understandable graphics, you get instant answers on
essential plant vitality parameters including a P diagnose.
The P-tester records chlorophyll afluorescence which reflects the efficiency of the electron
transport in photosynthesis. Based on the course of these fluorescence transients, important
information is revealed on general plant vitality and P status (Figure 1).
Figure 1: A: A normal chlorophyll afluorescence transient from a healthy plant. B: A fluorescence transient from a healthy control
and a P deficient plant. Note that the x-axis is on a logarithmic scale.
The chlorophyll afluorescence transient is also known as an OJIP curve, where base-line
fluorescence is known as “O”, the two intermediate steps are named “J” and “I” and maximum
fluorescence is called “P”. A healthy plant will always reveal a transient similar the one in Figure
1A. Every reading is visualized in the SpectraCrop app, and any deviations from the healthy
fluorescence transient indicate plant stress.
In addition to commonly used plant vitality measures, the P-tester estimates the bioactive pool of
P in the biophysical processes of photosynthesis. Phosphorus has a very important function in the
formation of ATP, which is used in the cascades of biochemical processes that fix CO2from the air
and convert it into carbohydrates. If P is not present in optimal concentration, key processes in
A
B

5
photosynthesis are affected, and so in-turn is the OJIP curve. Identifying this effect in the OJIP
curve is what allows the P-tester to specifically, and sensitively, measure the nutritional P-status of
a plant. In Figure 1B the fluorescence transient of a healthy control plant and a P deficient plant is
illustrated. It is evident that at the so called “I-step” the two curves are easy distinguishable. It is
based on the deviations within this area, that the P-tester is calculating the P status of the plant.
As the process of photosynthesis is the same for all higher plants, there is no need for correction
and calibration in order to adapt the reading to a specific plant species.
For further informations regarding the scientific approach used in this device see “Frydenvang et
al. (2015): Sensitive detection of phosphorus deficiency in plants using chlorophyll a fluorescence.
Plant Physiology, Breakthrough Technologies, vol. 169, pages 353-361”.

6
3. SpectraCrop Plant Vitality and P-Tester
The SpectraCrop Plant Vitality and P-Tester is accompanied with a handy suitcase which includes
the following items: Handheld P-tester, 10 leaf clips to dark adapt leaves prior to measurements
and 1 power plug (EC standard; Figure 2).
Figure 2: The P-tester is accompanied with a handy suitcase.
3.1 Flow Chart
The flow of data after a measurement with the P-tester is presented in Figure 3. Leaf
measurements are transferred via Bluetooth to the SpectraCrop app on your Iphone, where four
plant vitality parameters immediately are present. The P-diagnose is calculated on an external
server, and will first be available when the data has been sent and received via the app. Note that
your phone must send and receive data to obtain the P-diagnose.

7
Figure 3: Flow chart of the use of the P-tester. Bluetooth connection ensures transfer of the measurements to the SpectraCrop app,
whereas the phone must send and receive data to obtain the P-diagnose from the external server.

8
4. How to Perform a Measurement
Dark adaption:
The leaf needs to be dark adapted for a minimum of 25 minutes prior to performing the
measurement. Mount the leaf clip –OBS: Remember to close the shutter when the clip is
positioned correctly - on the midsection of a leaf to dark adapt the area that will be probed by the
P-tester. This can be done directly on the plant without detaching the leaf (Figure 4).
Figure 4: Left: Mounted leaf clip with open shutter. Right: Mounted leaf clip with closed shutter to begin dark adaption period.
Perform measurement:
After a >25 minutes dark adaption the measurement can be performed (not a problem if it takes
longer). Place the device onto the clip with the shutter closed. After a tight fit between clip and
device has been obtained, open the shutter and perform the measurement by pressing “measure”
on the P-tester. The measurement will take 3 seconds (Figure 5). You can remove the leaf clip
when “measuring” is no longer displayed. The measurement is saved on the P-tester until it is
transferred to the SpectraCrop app.

9
Figure 5: The P-tester attached to a leaf clip and ready for measurement. It is critical that the shutter is not opened before a tight fit
between the device and the clip is obtained.

10
5. The SpectraCrop App
The SpectraCrop app is acquired free of charge from the Apple App Store by searching for
‘SpectraCrop’ in the App store search pane. Notice that the app is currently only available for
iPhone and iPad.
When opening the app, you will see four main menu-items along the bottom of the screen: “New”,
“List”, “Map”, and “User” (Figure 6).
Figure 6: Left: SpectraCrop app from Apple App store. Right: The appearance of the app including the 4 menus at the bottom.
5.1 New
In the “New” menu, you can establish Bluetooth connection with the P-tester. Make sure to turn
on Bluetooth from your phone and press “Find device”. A few seconds later, the Bluetooth
connection is confirmed (Figure 7).

11
Figure 7: Left: The appearance when Bluetooth connection is not established. Right: After establishment of Bluetooth connection.
Five actions are made available after Bluetooth connection:
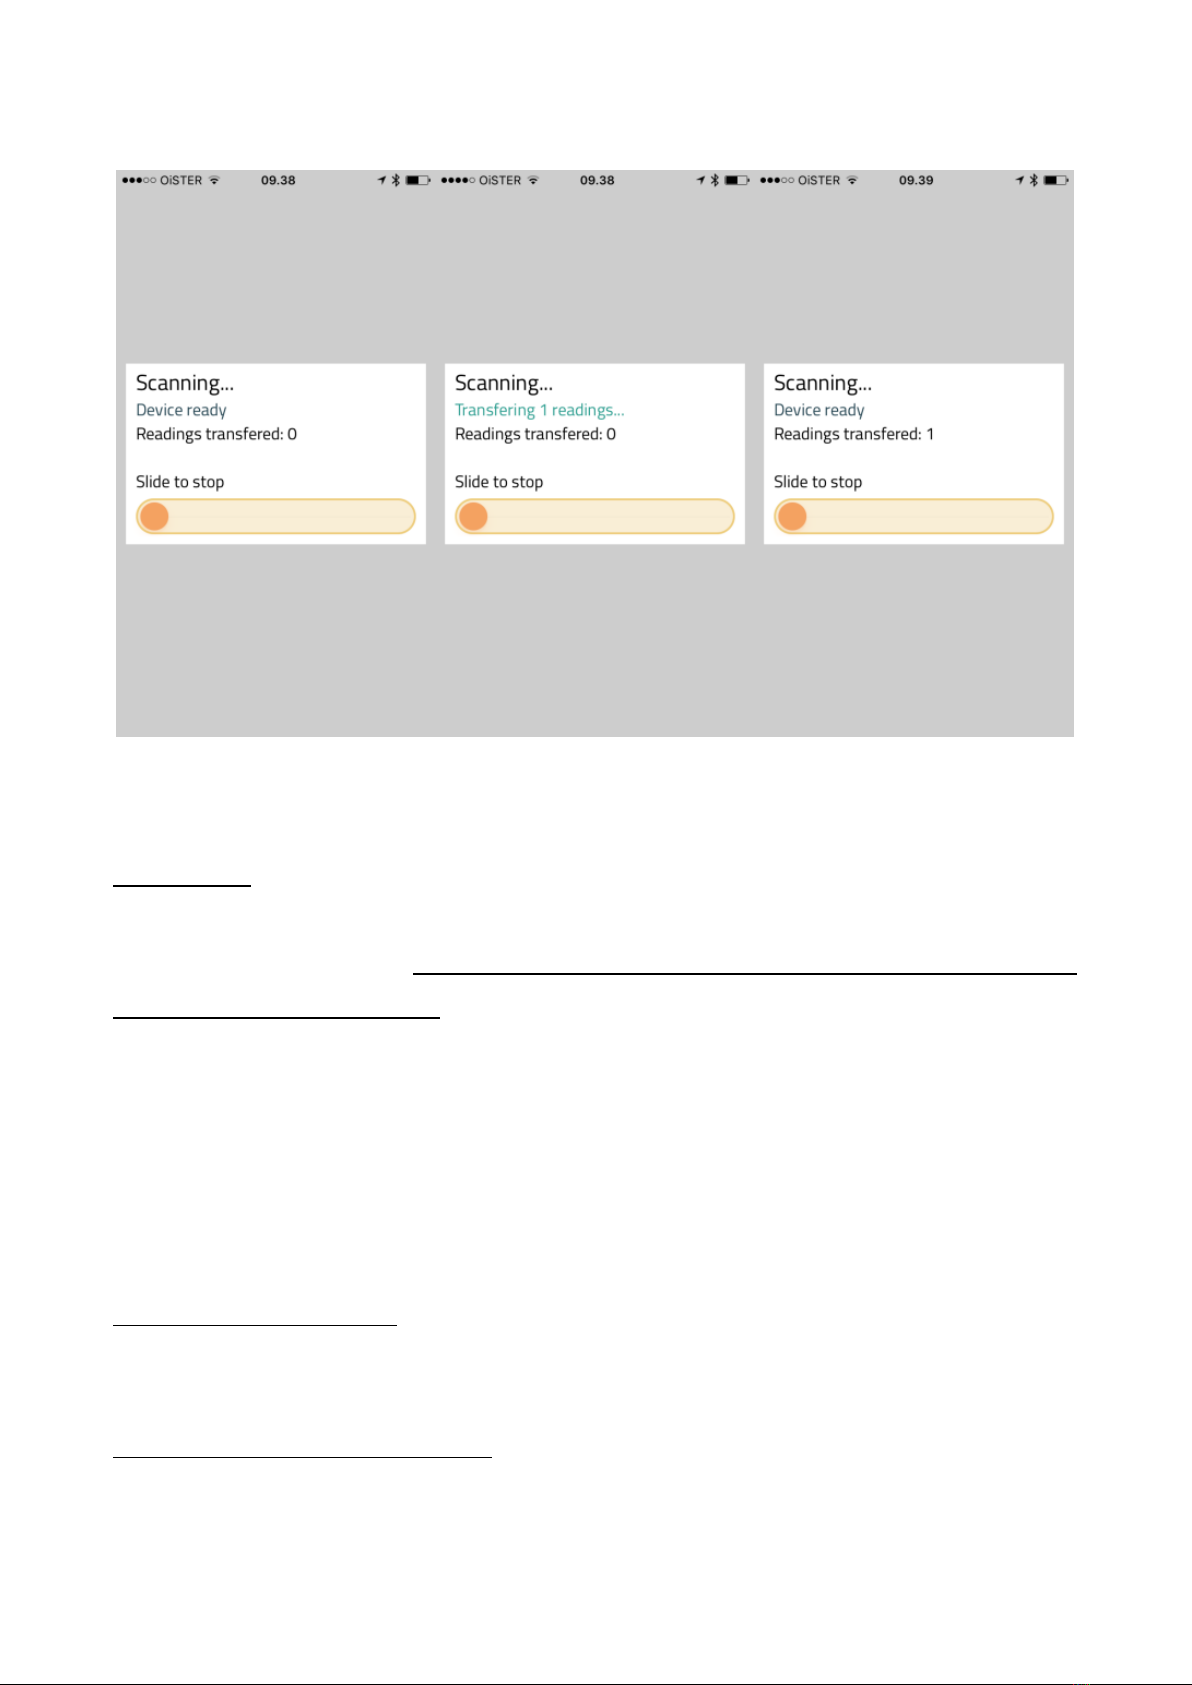
Automatic readings: If the “Start”button is pressed under automatic readings, the app will
transfer any reading from the P-tester every 10 seconds until stopped (Figure 8). When a reading
is transferred it will be notified on the app. Please note that if you perform a new measurement
while the app is transferring the prior reading, it might delay the transferring. It is therefore
recommended to wait until transferring of a reading is finished, before taking a new one. When
data is transferred to the phone, the GPS location of the phone is assigned to the measurements.
Note that if multiple readings are transferred at the same time, they will obtain the same GPS
recording. When a reading is successfully transferred to the app, it will automatically be deleted
from the P-tester.
12
Figure 8: Left: Screenshot when the app is set for automatic reading. Middle: Screenshot when the app is transferring a reading.
Right: Screenshot after the reading has been transferred. Note that the automatic reading is still in progress.
New reading: If you don’t want to transfer your readings continuously, or you don’t have the
phone near you when measuring, you can transfer your readings manually by pressing the
“Transfer readings” button. Please note it will take approximately 5.5 seconds for each
measurement to be transferred. If you have 20 measurements it will take close to two minutes,
50 measurements will take 5 minutes, 100 measurements will take 9 minutes and 200
measurements will take 18 minutes for completing the transferring. Note that GPS recording is
performed by the phone, so all the readings you transfer manually, will be assigned the GPS
coordinates of your phone at the time you transfer the readings. After a successful transfer, you
can either keep your measurements on the P-tester or delete them.
Synchronize time on device: Press “Set time” to synchronize the time on your phone with the P-
tester. Usually only necessary prior first-time use.
Delete readings without transferring: If you want to delete all readings on the P-tester without
transferring them to the app press ”Delete readings”.

13
Reset current connection with device: If the connection is unstable you can press “Reconnect”, to
re-establish Bluetooth connection with the P-tester.
5.2 List
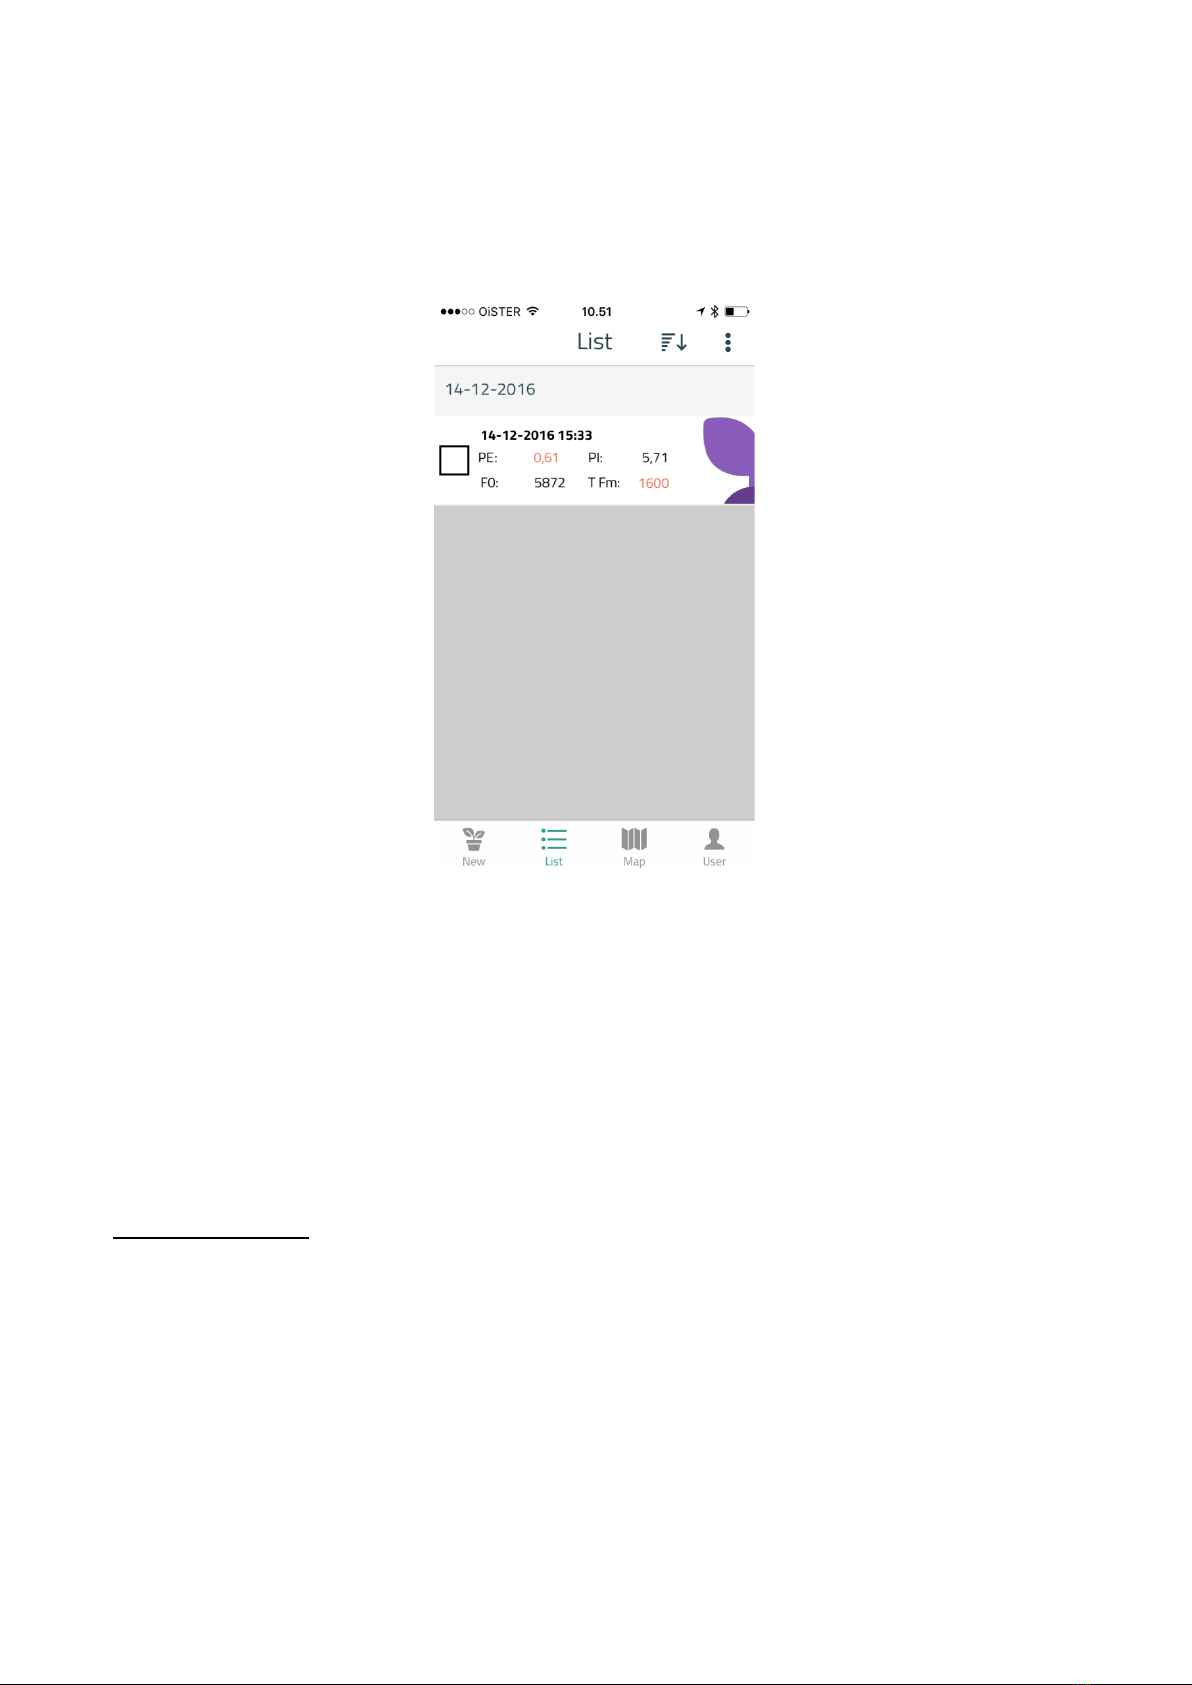
In the “List”menu, all the transferred readings are listed and ready for inspection. Two plant
vitality parameters are immediately available: Photosynthetic efficiency (PE) and plant vitality-
index (PI), including two additional parameters describing the fluorescence transient: Baseline
fluorescence (F0) and time for reaching maximum fluorescence (T Fm). Finally, the P diagnose is
revealed by the colour of the plant leaf at the far right (Figure 9). Note that the P diagnose is
calculated on a server, and will first be available when the data has been sent and received via the
app.
Figure 9: The appearance of a newly transferred reading in the list menu. Note the immediately available plant vitality parameters
and fluorescence transient parameters. The grey colour of the leaf to the far right is the P diagnose, which is yet to be calculated.

14
Photosynthetic efficiency (PE): This parameter is one of two important plant vitality parameters.
In a non-stressed plant, regardless of plant species, the value of PE ranges between 0.75-0.85. If
the value is less than 0.75, it reveals that the light is not used optimally in photosynthesis and
plant growth is weakened as a result. If PE remains low over time, the plant will become
susceptible to diseases, develop leaf symptoms (necrosis) and crop yield and quality of the crop
will decrease. PE is an unspecific parameter that provides no information on which stressor might
affect the photosynthetic activity, but it provides an overall indication of whether the plant is
healthy or not. If the value is less than 0.75 a systematic approach for finding the cause of the
plant stress must be implemented and initiatives must be taken to restore vitality through good
farming practice. Photosynthetic efficiency is a very useful and sensitive parameter that provides
the opportunity to follow plant vitality and optimize the growth conditions, and is one of the
strongest parameters, the plant grower have available to optimize productivity. If the PE value is
below 0.65, the plant is too affected to allow a P diagnosis and no data will be returned from the
server, as it will not reflect the true P concentration in the leaf.
Plant vitality-index (PI): This parameter represents an additional plant vitality parameter, and is a
measurement of the energy transfer between the two photosystems (photosystem II and I) in
plants. The PI value of a healthy plant will always be larger than 2.5 - If the value is smaller, it
indicates that the plant is exposed to stress. Often the PI value follow PE (see above), but PI has
been shown to be more sensitive to certain kinds of stress, such as drought and heat. Therefore, PI
is a very useful additional parameter to PE, in order to optimize plant productivity.
Baseline fluorescence (F0): This parameter reveals baseline fluorescence which provides
information about the fluorescence being emitted from chlorophyll not exposed to photosynthetic
light. If the background fluorescence is too high, it indicates that too much energy is leaving the
system without being used in photosynthesis.
Time for reaching maximum fluorescence (T Fm): This parameter describes the course of the
fluorescence curve. If a plant is stressed, or the measurements are performed in too cold or hot
conditions, the plateaus of the fluorescence curve are shifted, which makes the reading too

15
unreliable for a P diagnosis. If T Fm is above 700, the P diagnose will not be performed, as it might
not reflect the true P concentration in the leaf.
P diagnosis:To obtain a diagnosis of the P nutritional status, the readings need to be transferred
to an external server via the app (see more under the “user” menu). After receiving a P diagnosis
from the server, the result will be displayed with different colourations of the plant leaf (Figure
10). At first, the leaf will appear grey, which means that the P diagnose hasn’t been calculated yet.
After the readings have been processed by the server, the P diagnose will be divided into 3
categories: Green colour means healthy, yellow colour means intermediate and red colour means
P deficient.
Figure 10:The three different P diagnoses. Green colour means healthy, yellow colour means intermediate and red colour means P
deficient.
Bad measurements: The two parameters PE and T Fm are used to evaluate if the fluorescence
transient is suitable for further analysis on the server to obtain a P diagnosis. If PE is below 0.65
and/or T Fm is above 700, the font of the parameters turn red and a P diagnosis will not be
16
performed. Instead, the leaf colour will turn purple to indicate that a bad measurement has been
performed (Figure 11).
Figure 11: Both PE and T Fm are off limit and highlighted in red. This implies a bad measurement, and the leaf colour turns purple,
meaning that the P diagnose cannot be performed.
Climatic conditions are known to have an impact on the parameters, especially T Fm. High
temperatures followed by high solar radiation will typically result in T Fm values above 700. If
multiple purple coloured measurements are obtained, it might be necessary to perform the
measurements early morning or late afternoon.
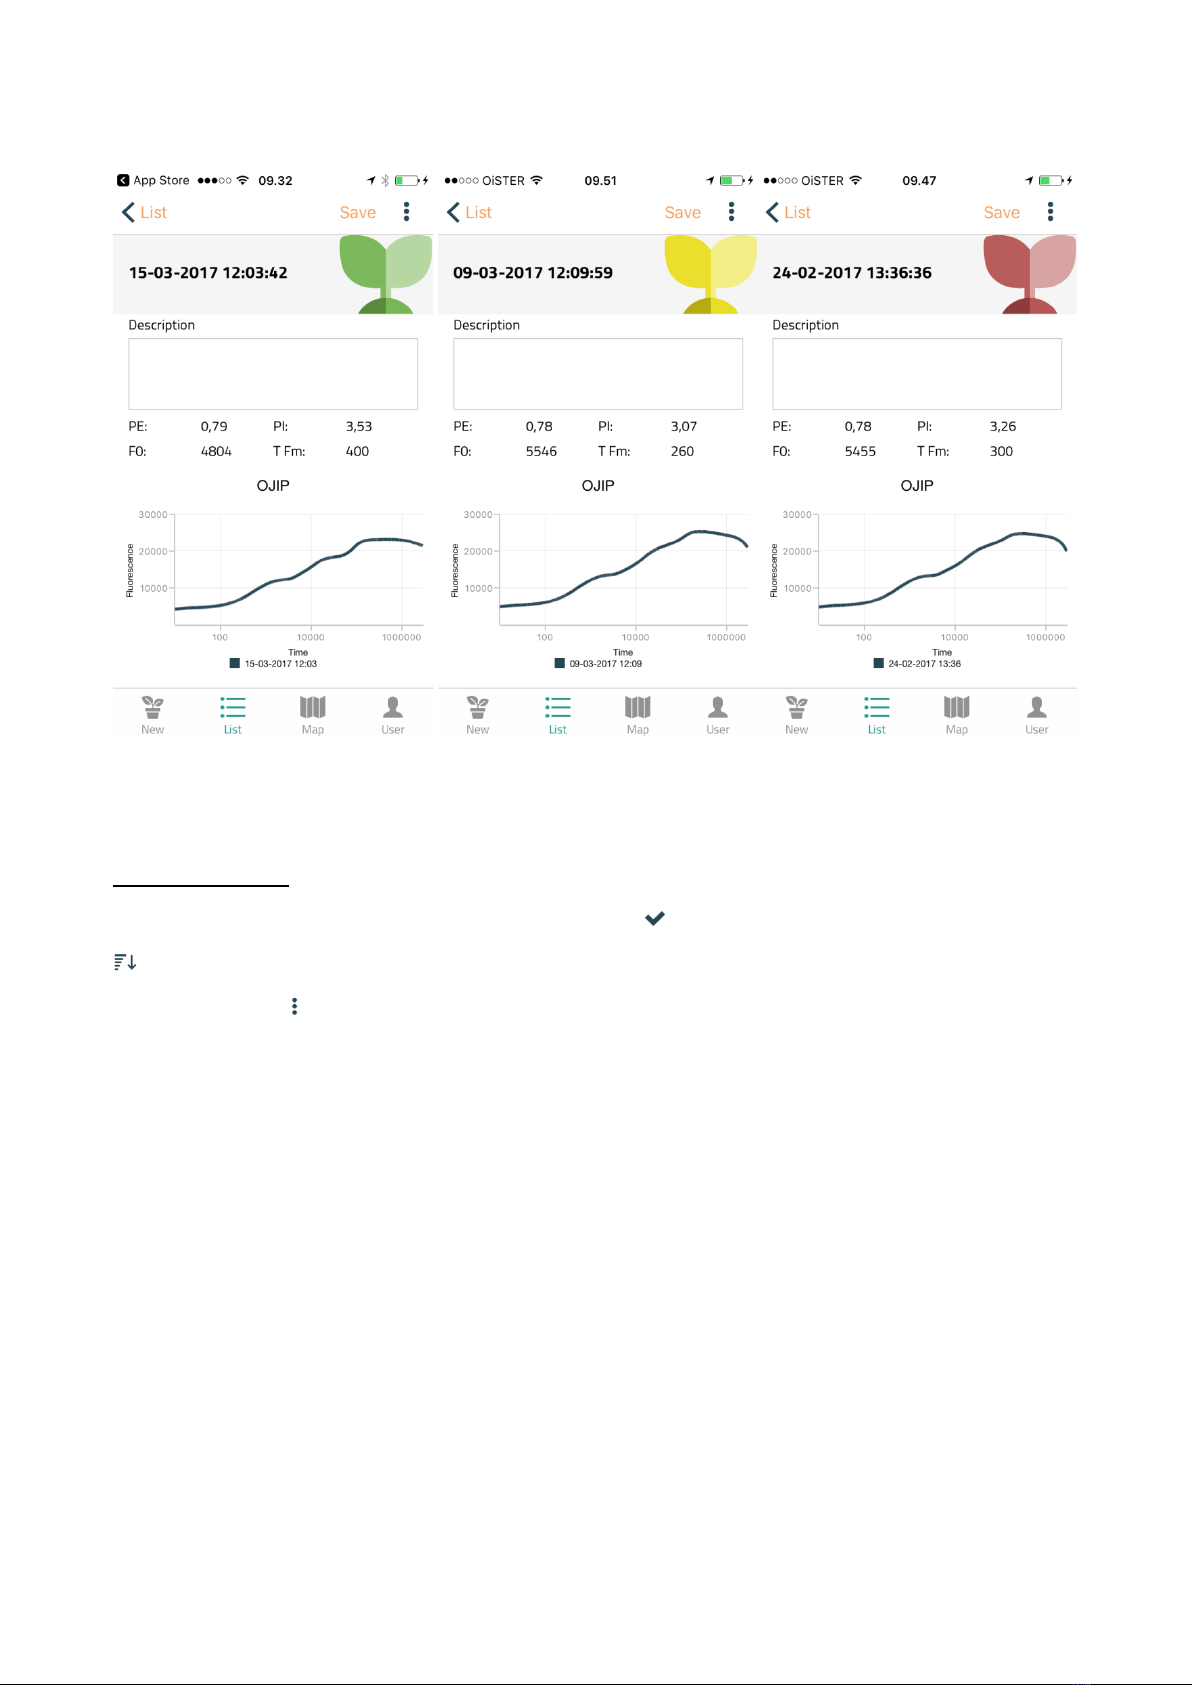
The Kautsky curve: The Kautsky curve can be closely inspected by pressing on each individual
reading (Figure 12). Please note that by turning your phone sideways, the plot will change
accordingly, making it easier to compare individual curves.
17
Figure 12: Screenshot of the Kautksy curve off three different readings with corresponding P diagnose. Note the difference at the I-
step which corresponds to the three different P diagnoses.
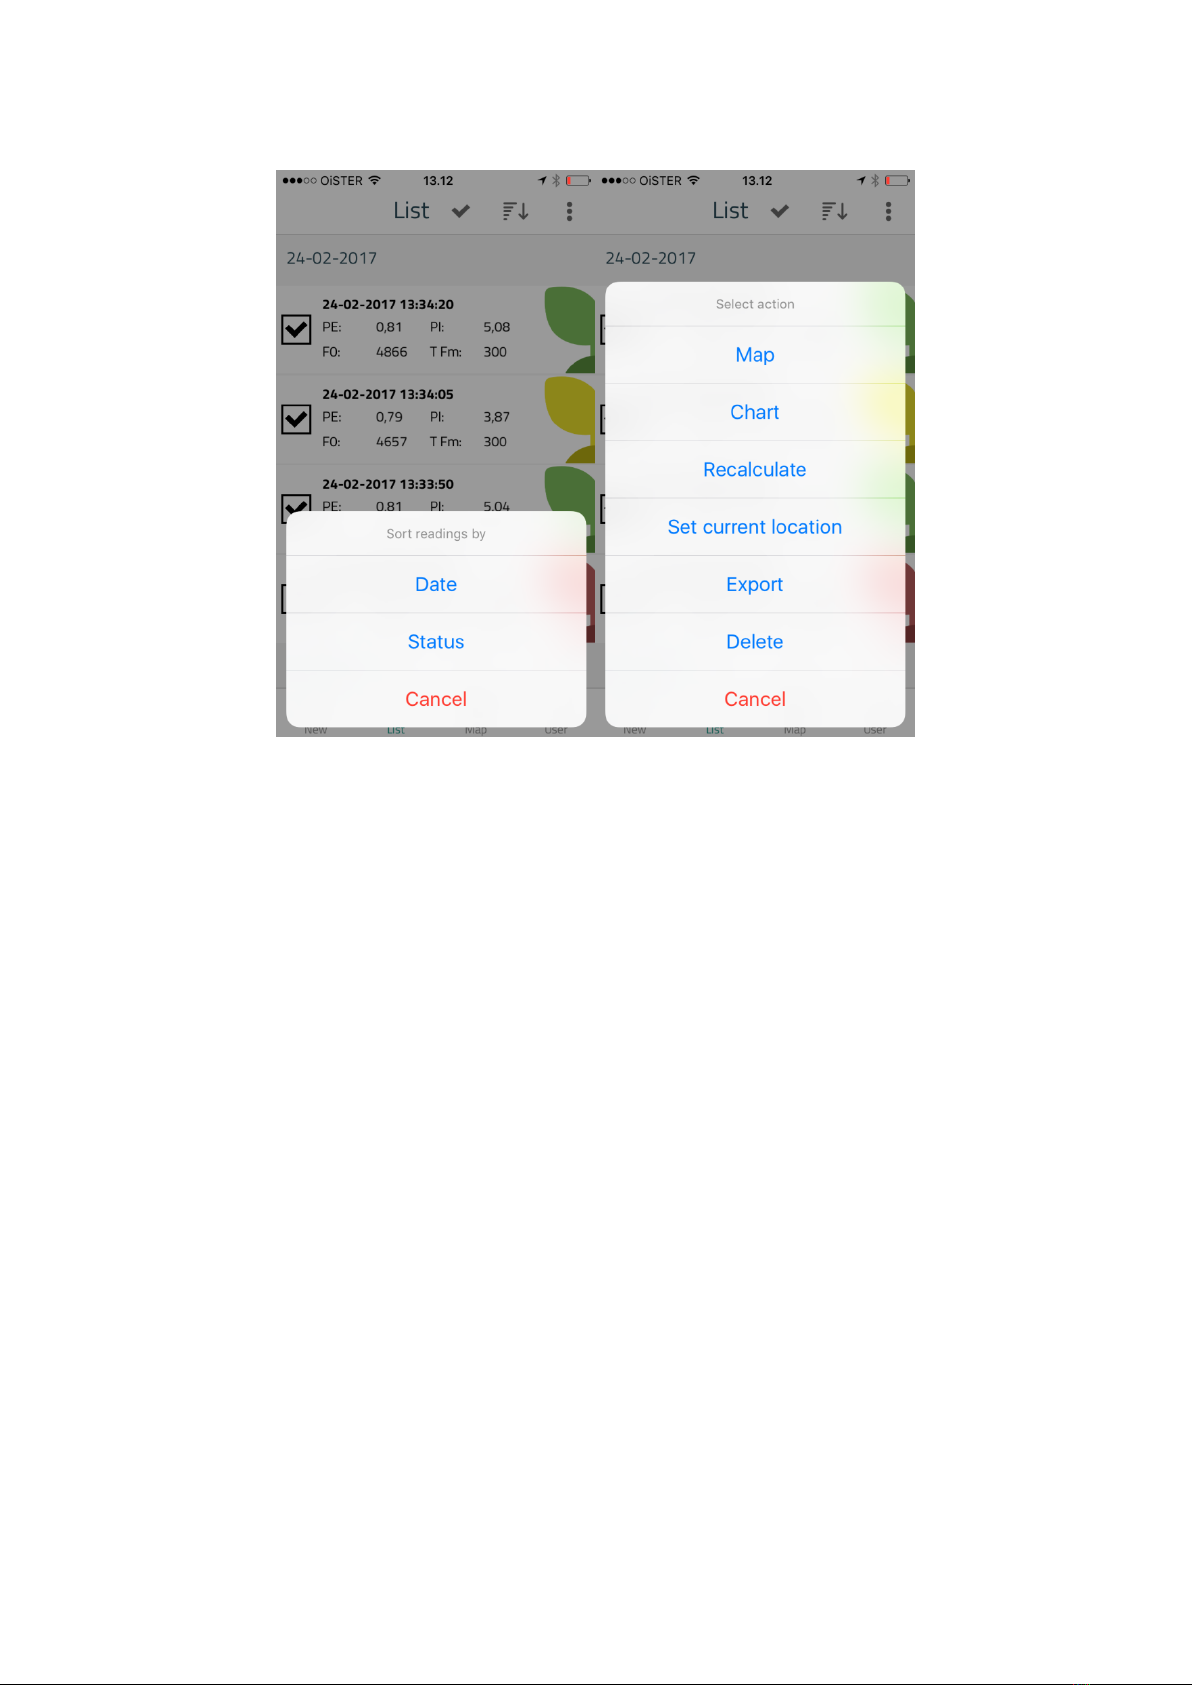
Handling of data: You can mark individual readings by ticking the square box to the left of each
reading. To mark/unmark all readings you can press “ ” in the upper panel. To sort data, press ”
”in the upper right. This enables you to sort the readings by either date or P diagnosis (Figure
13). By pressing “ ” a number of actions are made available. Marked readings can be shown on a
map, or their fluorescence curve can be compared by the chart function. The values can
furthermore be recalculated, the GPS marking can be changed to your current location, and you
can export your readings as a .csv file. When reading the .csv file in a data handling program,
please set the x-axis to a logarithmic scale (log10), if visualization of the curves are needed. Finally,
you can delete the marked readings.
18
Figure 13: Screenshots to sort data (left) or perform different actions with the marked readings (right).
5.3 Map
In the “Map” menu, the readings appear based on their associated GPS coordinates, including the
colour code from the P diagnose (Figure 14). This gives a quick overview of potential local
variations in the P availability.

19
Figure 14: Screenshot of seven readings plotted on a map by their GPS recording. The map-function reveals a potential P problem
in the corner of the field.
5.4 User
In the “User” menu, you can get access to the server and synchronize your readings to obtain the
P diagnosis. As a first-time-user you need to create a user profile to connect to the server. Press
the “Synchronize readings” button and wait a moment to allow synchronization (Figure 15). After
successful transfer, your readings are now updated with a P diagnosis. Note that the phone needs
to send and receive data to complete the P diagnosis.

20
Figure 15: Left: Screenshot of the ”User” menu. As a first time user, you need to create a user before you have access to the server.
Middle: Screenshot when you have logged. Right: Screenshot when the synchronization is completed.
Table of contents
Popular Test Equipment manuals by other brands


Champion
Champion UH330 ADA Installation & operation manual

Klein Tools
Klein Tools Ranger TDR VDV501-090 instruction manual

American DJ
American DJ Strobe Ball User instructions

Tektronix
Tektronix DPO7AFP instructions

marposs
marposs Testar Quick Read quick start guide

ELBRO
ELBRO TESTER 2550LCD operating instructions


