Spectro Scientific wilks InfraCal 2 User manual
Rev. 1.1, June 2013
InfraCal 2 Analyzer
Operations Manual
InfraCal and Wilks are registered trademarks of Spectro Scientific
Copyright 2013 Wilks, East Norwalk, CT
WilksIR.com

Table of Contents
1. InfraCal 2 Overview...........................................................................................................3
1.1. Introduction................................................................................................................................3
1.2. Basic measurement concept .......................................................................................................3
1.3. Analyzer description...................................................................................................................3
1.3.1. Location ..............................................................................................................................4
1.3.2. Power requirements.............................................................................................................4
1.3.3. Warm up time......................................................................................................................4
1.4. External ports .............................................................................................................................4
1.4.1. Communications ports.........................................................................................................4
1.4.2. External memory ports........................................................................................................4
1.5. Power on-off...............................................................................................................................5
1.6. Touch screen interface description.............................................................................................5
2. System Indicators .............................................................................................................5
2.1. Analysis table icons....................................................................................................................5
2.2. Navigation buttons: ....................................................................................................................5
2.3. PIN entry pad .............................................................................................................................5
3. User Interface Navigation.................................................................................................6
3.1. Tables.........................................................................................................................................6
3.2. Drop down menus ......................................................................................................................6
3.3. Radio buttons and check boxes ..................................................................................................6
3.4. Text entry boxes.........................................................................................................................6
4. System Screens.................................................................................................................6
4.1. Main screen................................................................................................................................6
4.1.1. Setup screen: ..................................................................................................................7
4.1.2. History screen ....................................................................................................................7
4.1.3. Zero button:.........................................................................................................................8
4.1.4. Analysis screen creating or editing an analysis...................................................................8
4.1.5. Zero button: information section........................................................................................9
5. Service and Customer Support .....................................................................................10
6. Product Specifications ...................................................................................................10
List of Figures
Figure 1: The InfraCal 2 Layout.....................................................................................................................3
Figure 2: Touch Screen Layout.......................................................................................................................4
Figure 3: Main Menu......................................................................................................................................6
Figure 4: Setup Screen....................................................................................................................................7
Figure 5: Setup screen/security button............................................................................................................7
Figure 6: Create New User .............................................................................................................................7
Figure 7: History Screen adjust table..............................................................................................................7
Figure 8: Analysis Screen...............................................................................................................................8
Figure 9: Analysis Screen...............................................................................................................................8
Figure 10: Analysis Screen/Timers/Expirations..............................................................................................8
Figure 11: Analysis Screen Min/Max Ranges.................................................................................................8
Figure 12: Analysis Screen Alarm Limits.......................................................................................................8
Figure 13: Calibration Table...........................................................................................................................9
Figure 14: Value Button Running Calibration Standards need run listing......................................................9
3
________________________________________________________________________
1. InfraCal 2 Overview
1.1. Introduction
The InfraCal 2 Analyzer is a filter based mid infrared analyzers with pre-selected filters for up to three
discrete wavelengths. The sample stage is also preset for either transmission or ATR (Attenuated Total
Reflection)
1.2. Basic measurement concept
The InfraCal 2 Analyzer makes use of the fact that most molecules absorb at specific infrared frequencies
that are characteristic of their structure. The amount of energy absorbed is proportional to the
concentration of the specific molecule. A calibration table converts the infrared absorbance into the
desired units of measure.
The InfraCal 2 touch screen display includes the capability for multiple calibrations, a wizard guide for
calibration, multiple level user database, multiple languages with user preference selection, high/low
alarm and control limits, and measurements stored in a history table for recall or export to a flash or
serial port.
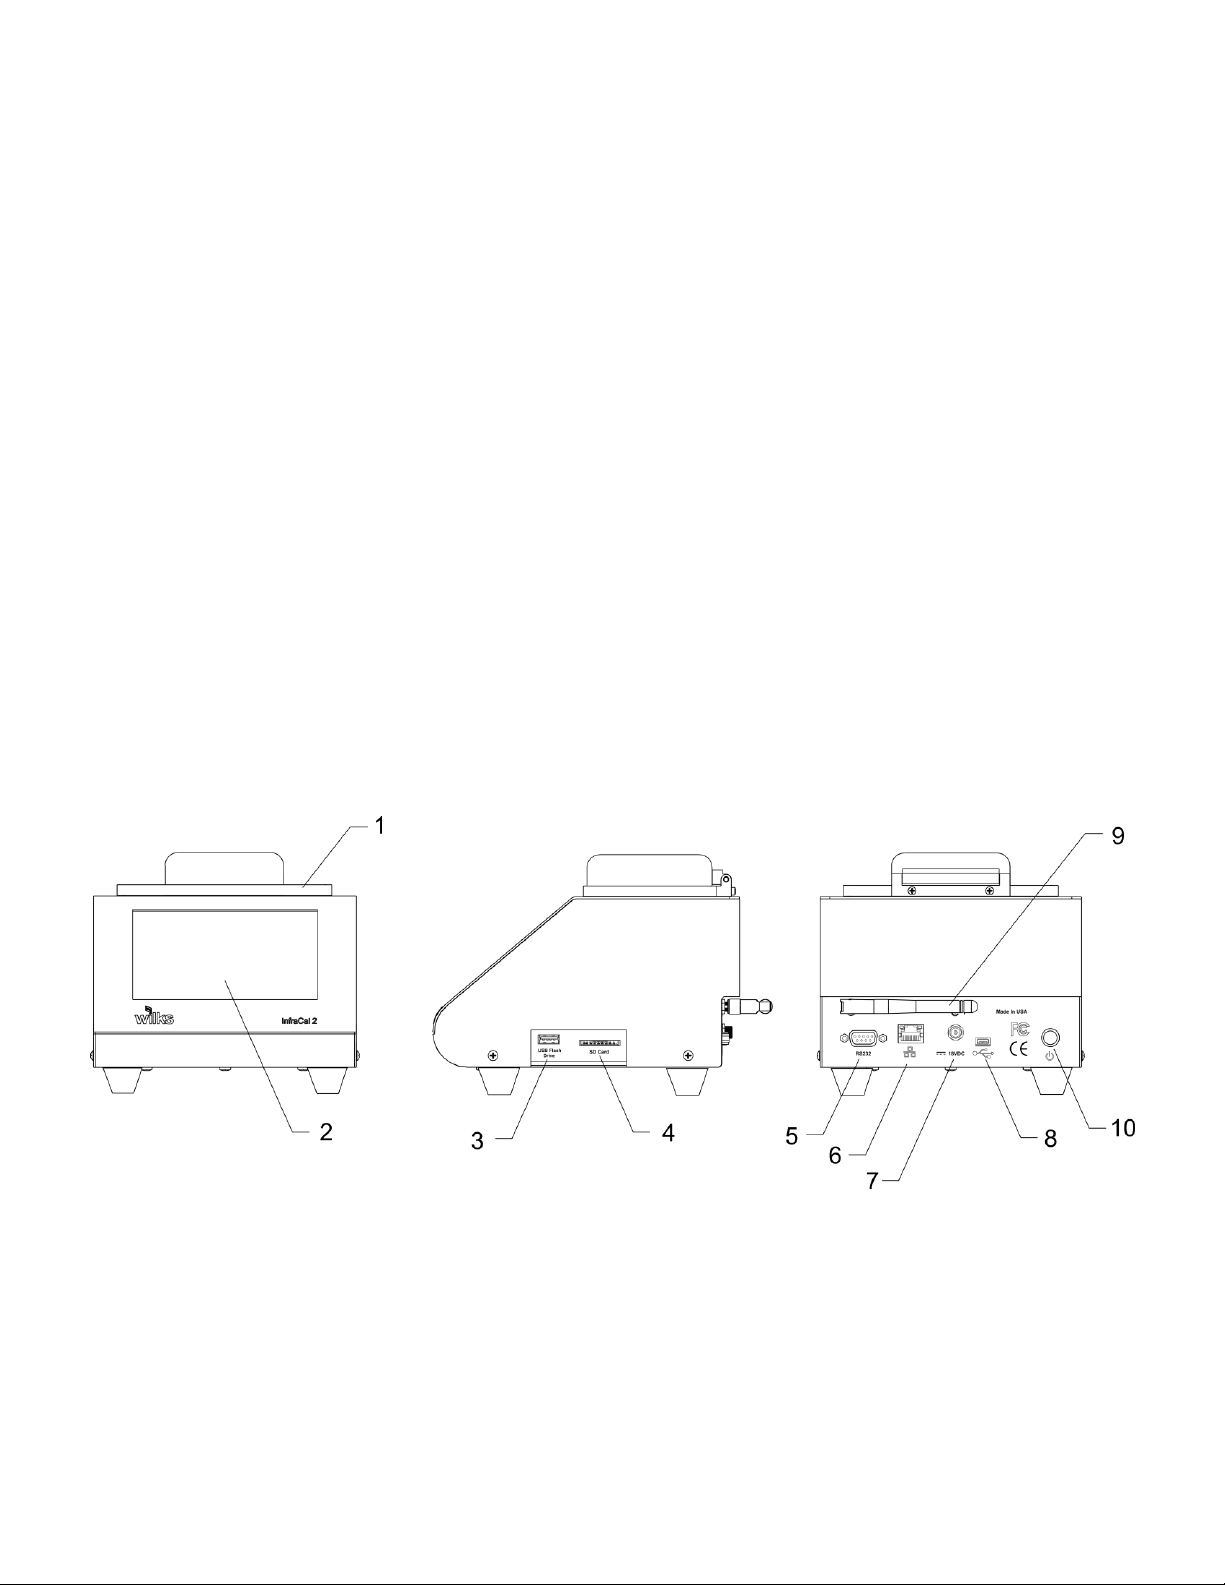
1.3. Analyzer description
Figure 1: The InfraCal 2 Layout
1. Transmission sample stage with cover 6. Optional Ethernet port
2. LCD touch screen 7. 18 VDC input
3. USB flash drive port 8. USB Mini-B
4. SD Card 9. WiFi antenna (optional)
5. RS232 port 10. On/Off push button

4
Figure 2: Touch Screen Layout
1.3.1. Location
The InfraCal 2 Analyzer is designed for on-site measurements and is relatively insensitive to vibration
and ambient temperature changes. For more sensitive readings below 1 ppm, it is best to avoid dramatic
temperature changes such as direct sun or a location in the direct air flow of a heating or air conditioning
vent.
1.3.2. Power requirements
A standard 18 volt power supply is provided with the analyzer and an optional internal battery pack is
available at the time of purchase. The analyzer may be operated from any grounded A.C. outlet (line
power requirements: 100 - 250 VAC, 50-60 Hz, 0.5-0.3 amps). When operating, the InfraCal 2 Analyzer
uses 0.5 amps and up to 2.1 amps with the internal battery charging.
Note: Use of any other power supply than the one provided with the analyzer will void the instrument
warranty.
1.3.3. Warm up time
For normal operation, it is recommended that the instrument be allowed to warm up for 1 hour prior to
use. The InfraCal 2 Analyzer draws very little power and, if used daily, it can be left on at all times
(unless operated from the internal battery pack).
1.4. External ports
1.4.1. Communications ports
RS232 Port –DB-9F DCE connector for connection to host computer (DTE) with a straight through
cable.
USB Port –USB 2.0 mini B connector for connection to host computer
Ethernet Port –RJ45 connector-future option
1.4.2. External memory ports
USB 2.0 Type A connector –for standard USB memory devices
SD Card Port –secure data port-future option

5
Calibration selectable
Calibration table has
expired
1.5. Power on-off
Press the ON/OFF button to turn the instrument on. Press again to turn the instrument off. If the
instrument fails to turn off, press and hold the ON/OFF button until the instrument powers down
(about 5 seconds). No settings will be lost.
1.6. Touch screen interface description
The LCD is a resistance type touch screen. Commands are best activated with a resistance screen stylus, pencil
eraser or tip of the finger or fingernail. Do not use sharp objects. Damage to the LCD touchscreen by the use of
sharp objects is not covered by the InfraCal 2 warranty. While resistant to many chemicals, it is best to avoid
chemical contact on screen surface. Surface can be cleaned with a soft cloth and if necessary with some plastic
surface cleaner applied to the cloth.
_________________________________________________________________________
2. System Indicators
Power supply is powering analyzer
and optional internal battery pack
2.1. Analysis table icons
2.2. Navigation buttons: Different user levels as well as available options will
determine which buttons are active
2.3. PIN entry pad
Optional internal battery is powering the
analyzer-bars display discharge status
Action required
Incorrect entry or error has occurred
Calibration not selectable
because it is incomplete or
contains an error
Blue-selectable,
suggested next action
Gray-selectable,
optional next action
Dark Gray-not selectable
Button inactive
Esc Cancels and returns to previous screen
CClears PIN code area
<Backspace
= Enters selection
6
All
None
_________________________________________________________________________
3. User Interface Navigation
3.1. Tables
To view entries that are not visible in the table window, touch
the data field and slide your finger up or down, left or right to
scroll the table.
The blue arrow icons can also be tapped to scroll left or right.
3.2. Drop down menus
Tap the drop down arrow to reveal available options.
Press and hold to scroll through more available
options.
Touch an option to select it.
3.3. Radio buttons and check boxes
Tap to select or deselect
3.4. Text entry boxes
Tap the text entry box to reveal the keyboard. Press enter to transfer the contents of the keyboard
display to the text box or press ESC to close the keyboard display.
4. System Screens
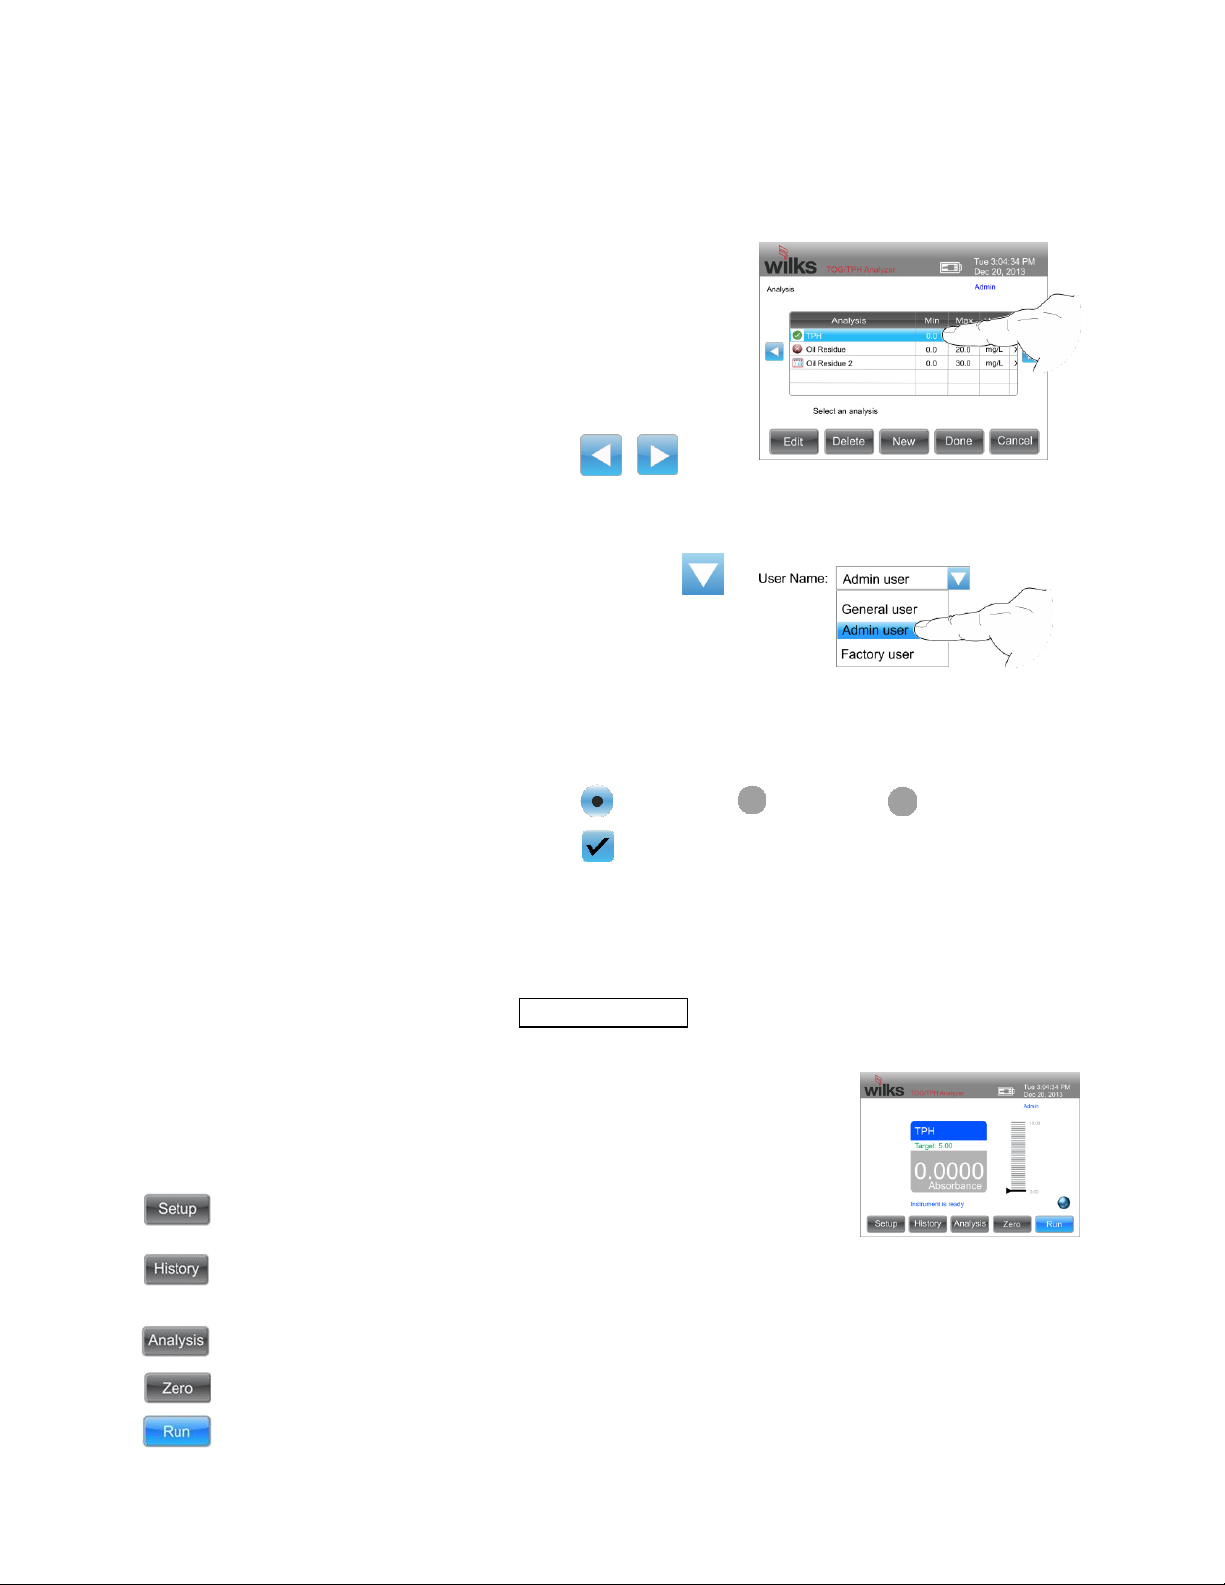
4.1. Main screen
Select the current user, language and display brightness. Set
the clock date/time and display format
View and delete measurements, download to USB flash or
serial ports.
Select a calibration analysis. Create or edit an analysis
Zero the instrument
Perform a measurement
User Name:
None
Admin
Daylight Saving Time
Figure 3: Main Menu

7
4.1.1. Setup screen: This is where a user is created or changed.
Select the current user, language and display
Set the clock date/time and select display format. Select
Daylight Saving Time and format. Tap the cell to
highlight then use the up and down arrows to adjust.
Select “Update” then “Done” to return to Setup Screen.
Add, edit or delete a user. “PIN Required” radio buttons
designates who will need to enter a PIN
to begin use of the analyzer as well as access to different
user levels.
To create a new user, tap the “User Name” cell
to enter name.
PIN: Optional
Type: Determines user level
User levels:
General user: Restricted access to settings—cannot
create or edit calibrations
Admin user: Can create and edit calibrations
Certified user: Access for certified calibrations
Language: select English, Spanish, French, Portuguese, Arabic
or Chinese
Timeout: Determines how long a user has access before re-
entry of PIN
Change a user’s name, PIN, etc.
4.1.2. History screen to view and delete past measurements, download
to a USB flash or serial ports
Will only be highlighted if measurements were taken in
continuous mode. Options in the details are minimum,
maximum and average.
Icon next to “analysis” shows details are available.
Tap the desired cell to highlight and delete button will become active.
Activated when flash drive is inserted into port. Exports all measurements to the
USB flash drive
Exports all measurements to the RS232 and USB Mini-B serial ports
Radio buttons select formatted or CSV (comma separated values) for exporting data
Figure 4: Setup Screen
Figure 5: Setup screen/security
button
Figure 6: Create New User
Figure 7: History Screen
Delete

8
Figure 9: Analysis Screen
Name/Precision/Units of Measure
Figure 10: Analysis
Screen/Timers/Expirations
4.1.3. Zero button:
Zero the analyzer prior to collecting calibration data with the
appropriate zero for the analysis
Select “Zero” and “Done”when satisfied with
zero
4.1.4. Analysis screen creating or editing an analysis
Select a calibration for an analysis.
Add edit or delete an analysis
Select to create new calibration. Tap the textbox to add
analysis name. Select the number of digits to display to
the right of the decimal point. Select the units of measure.
Select run countdown time. Start of measurement is delayed by
the selected time.
Select zero countdown time. Start of zero measurement is
delayed by the selected time.
Select measurement average time. 10-30 seconds.
Select calibration expiration time.
Check “Today” to calculate the expiration time from today’s date
Select filter wavelengths (not adjustable) as Analytical,
Reference 1 and Reference 2.
Enter maximum calibration range
Enter minimum calibration range
If desired, alarm limits can be set for each application
Tap textbox to activate check box.
Upper alarm limit: Tap cell to adjust limit. Readings
above or below will display in red and red on the bar
graph.
Upper control limit: Tap cell to adjust limit. Readings
above or below will display in yellow and yellow in the
bar graph.
Target: Tap cell to adjust limit. Readings above or
below will display in white and green in the bar graph.
Lower alarm limit: Tap cell to adjust limit. Readings
above or below will display in yellow and yellow in the
bar graph.
Lower alarm limit: Tap cell to adjust limit. Readings above or below will
display in red and red in the bar graph.
Beep: Tap text/box to activate check box for audible alarm
Figure 8: Analysis Screen
Figure 12: Analysis Screen
Alarm Limits
Figure 11: Analysis Screen
Min/Max Ranges

9
Opens table for calibration points. Calibration data can be
entered directly into this table.
Press when last point is entered
Select “Curve” if calibration standards need to be tested for
absorbance values.
Zero the analyzer prior to collecting calibration data with the
appropriate zero for the analysis
Enter Calibration standard value using the keypad. It is best to go from the lowest
calibration value to the highest.
Introduce lowest standard and select “Run”. It is
suggested that each standard is run at least three times.
Re-introduce the standard and select run again. The absorbance
values for each run is shown on the left side of the display
Point: Displays the current number of the standard
being measured by the instrument starting at 1.
Value: Displays calibration standard value
Under “Value”are the results from repeated runs of
the calibration standard. If one value is significantly different from the other
values, it should not be used as part of the calibration curve. Tap on the
text/box to deselect and remove that run from the average calculation.
After a satisfactory number of measurements of a standard have been made, select
“Add”and the average absorbance will be entered into the table along with the
calibration standard value.
Repeat this sequence for each standard.
When the last calibration standard has been tested (or at any point during the
calibration) select “Back” to view the calibration table. If any values need to be
adjusted, select the cell that needs adjustment and enter the correct value using the
keypad.
To return back to the calibration procedure, select “Curve”.
To complete the calibration procedure, select “Done”.
4.1.5. Zero button: information section
“Info” button: Instrument and company contact information
“More”button: Installed components screen
“Next”button: Diagnostics screen
“Details”button: Shows detector settings
“Offset”Button: Shows detector offsets
“Signal”button: Shows detector signals
Figure 14: Value Button
Running Calibration Standards
Add
Figure 13: Calibration Table

10
5. Service and Customer Support
Your InfraCal®TOG/TPH Analyzer may have been purchased either directly from Wilks Enterprise or
from a local dealer or representative. If you have a technical question relative to the operation of the
instrument or relative to the analysis, please contact Wilks Enterprise at the contact address provided
below:
Customer Services Department
Wilks
25 Van Zant Street, Suite 8F
East Norwalk, CT 06855
USA
Telephone: (203) 855-9136
FAX: (203) 838-9868
E-mail:tech@WilksIR.com
Service and Repair
During the warranty period, Wilks Enterprise, Inc. offers free factory service for all failures that occur
from normal instrument usage. The user is only required to cover the cost of shipping the instrument to
the factory. After the warranty period, the user is required to cover the factory’s cost of servicing plus all
shipping charges. For extended service contracts or factory service charges, please contact Wilks
Enterprise, Inc. for details.
6. Product Specifications
Type: Fixed filter infrared analyzer
Dimensions: 6.7 x 7.8 x 5.2” (17 x 19.8 x 13.2 cm)
Weight: 5.8 lbs (2.6 kg)
Power requirements:
0.5A @ 18 VDC input
2.1A @ 18 VDC input with battery charge
Power Sources:
Power cube P/N: 403-1075 (use Wilks provided power cube only)
Input: 100 - 250 VAC, 50-60 Hz
Output: 18 VDC, 3.3A max.
Output Power: 60W max.
Optional internal 12V battery pack
Operating Temperature Range
40oF (4oC) to 110oF (45oC)
Humidity, 90% non-condensing
Table of contents
Other Spectro Scientific Measuring Instrument manuals

Popular Measuring Instrument manuals by other brands

Tokyo Keiso
Tokyo Keiso FT-1000 Technical guide

Powerfix Profi
Powerfix Profi 291710 Operation and safety notes

PCE Instruments
PCE Instruments PCE-DC 41 manual

Multimetrix
Multimetrix MMXI-200 instruction manual

Desco
Desco SCS-73627 Installation, operation and maintenance

Ellisys
Ellisys SerialTek Gen5 POD SSAS Assembly

Keysight Technologies
Keysight Technologies N9030B Installation note

Velleman
Velleman DEM400 user manual

AFRISO
AFRISO Unitop AdBlue operating instructions

Ryobi
Ryobi E49CM01 Operator's manual

Gamry
Gamry Reference 3000 Operator's manual

Endress+Hauser
Endress+Hauser Deltapilot S FMB70 Functional safety manual


