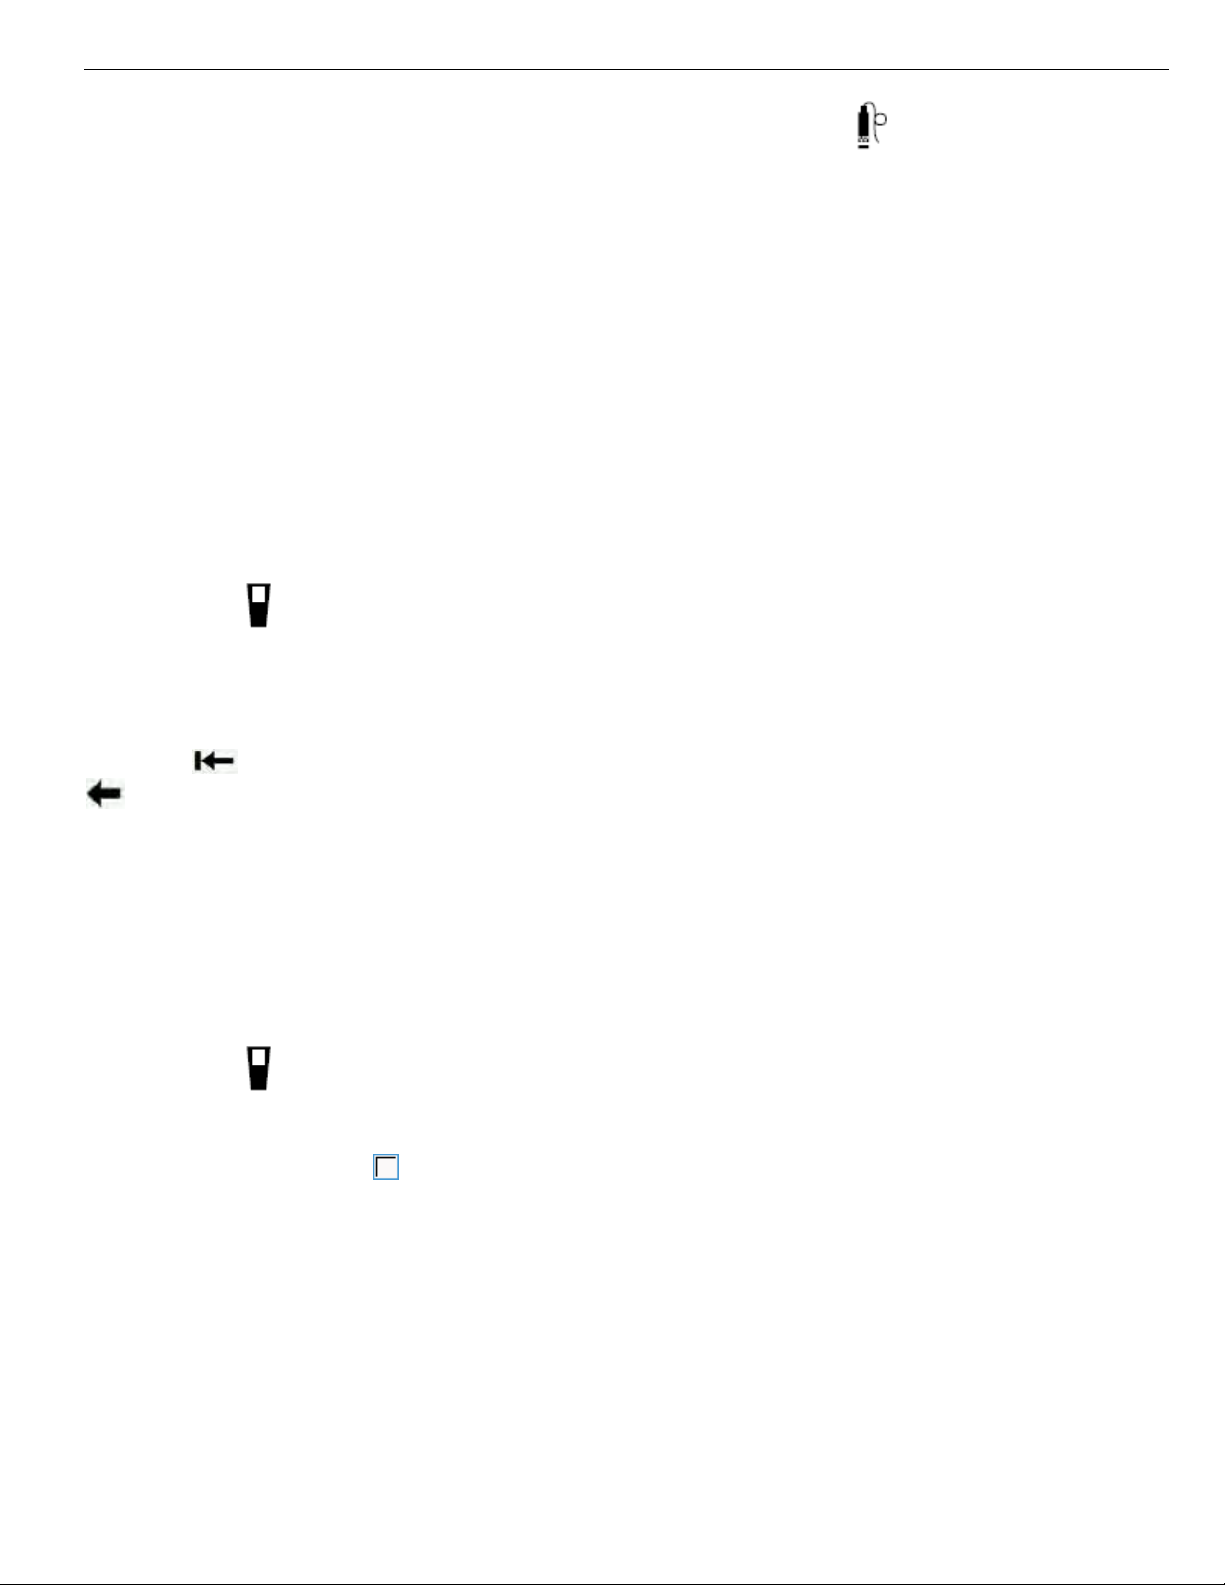
a) From the Run Screen, select the
System
button .
b) Scroll down and select Logging. In the
Logging menu, select Data ID and select
Replicate.
c) Exit back to the Run Screen and collect
and record a second reading (same as
above). NOTE: Don’t forget to switch
the
Data ID
back to Primary in preparation
for the next site.
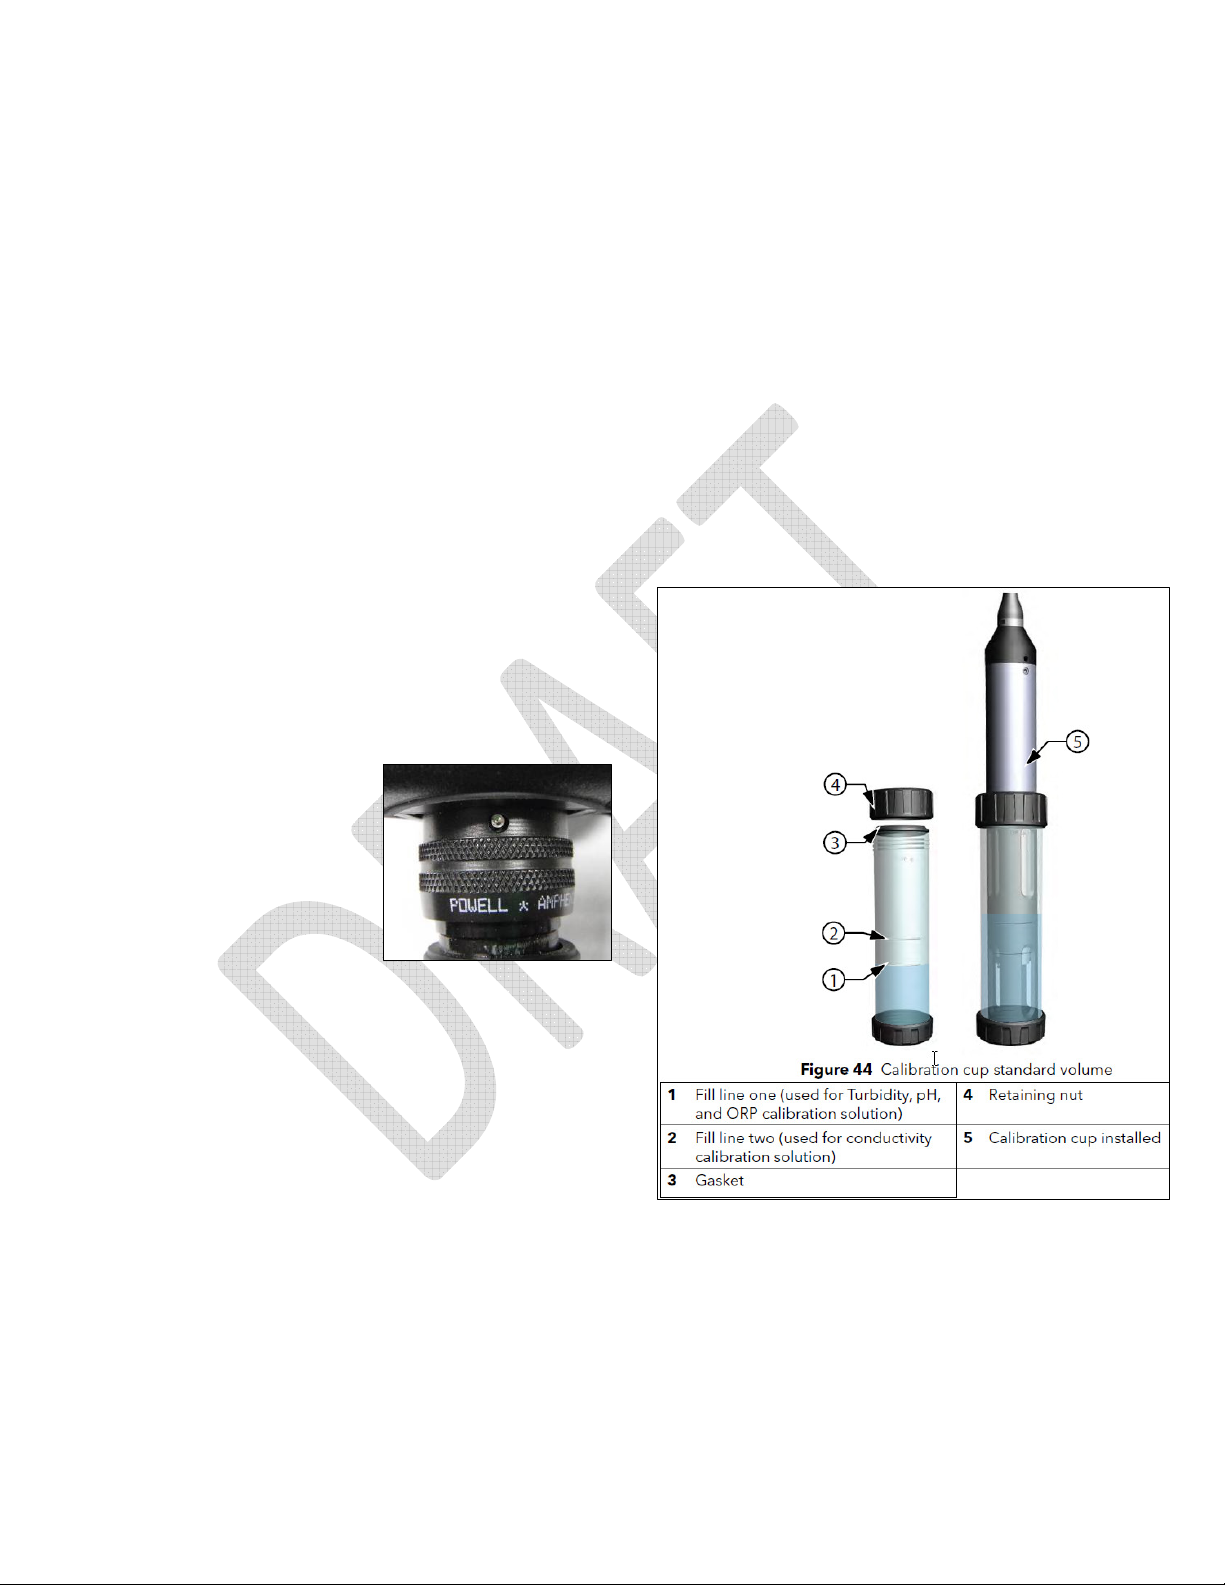
4. Remove the probe from the stream. Fill the
calibration cup with ~2” of clean water
(stream water if clear, purified if not) and
tighten. If you plan to do a DO drift check,
loosely screw the cup onto the bulkhead to
allow for atmospheric venting and keep the
probe in an upright position in the shade.
5.
Record t e meter number
, if the data
sheet directs you to do so. If you are not
submitting the data to Clallam County, record
the latest calibration dates for DO (“Winkler”),
pH, conductivity, turbidity, and temperature.
Select the
File button
, select View GLP,
and scroll through to see when the
instrument was last calibrated.
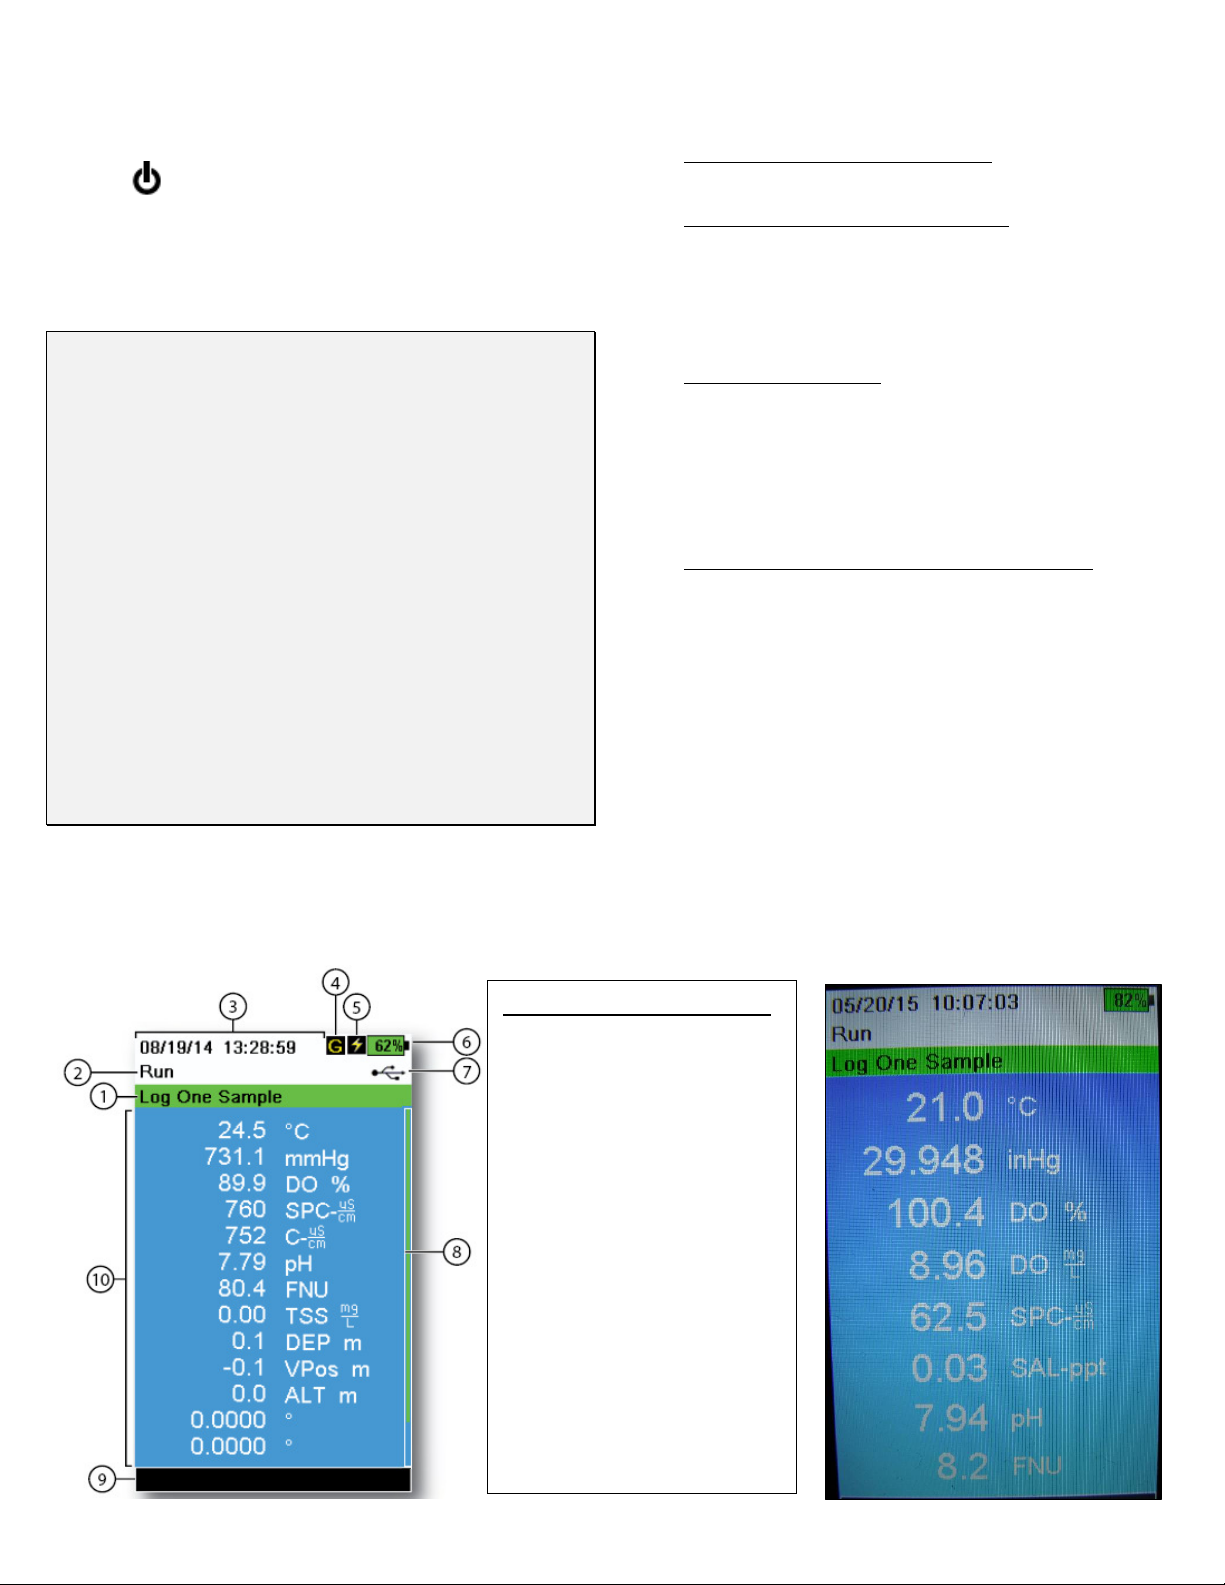
6.
Record t e data:
Select the
File
button
and then select View Data and Show
Data. (If no data is displayed, make sure you
have the right date and time entered at the
bottom.) Scroll down until you find the
proper site and data ID (Primary Sample or
Replicate). Then record the readings on your
data sheet, in the following order, using our
rounding convention as necessary (see
Quality Assurance protocol):
a)
Temperature:
to nearest .1°C
b)
Pressure:
to nearest . 1 inHg
c)
DO % Saturation:
to nearest .1%
d)
DO Concentration:
to nearest .1 mg/L
e)
Specific Conductivity:
to nearest whole
µS (microSiemens)
f)
Salinity:
to nearest .1 ppt (parts per
thousand)
g)
pH:
to nearest .1
h)
Turbidity:
to nearest whole FNU
7. If you performed replicates, record those
readings as well, and check the “Water
Chemistry—General” protocol to see if your
pairs of readings are within the acceptable
precision limits; resample as needed.
8. Record time and full initials of a single
sampler taking responsibility for the data; this
should be someone who has been properly
trained (see “Quality Assurance” protocol).
9.
DO drift c eck—optional, but desirable to
perform while “getting to know” the instru-
ment, until we’re completely confident in it:
a) Hit Esc to return to the “Run” Screen to
view the DO% saturation. If you haven’t
already, fill the calibration cup with ~2” of
clean water (stream or purified), and allow
the probe to stabilize:
STABILIZATION CRITERION:
During
a period of 2 minutes, bot DO Sat %
and temp (°C) stay wit in 0.1 of t eir
initial readings.
b) Do NOT hit any buttons on the meter.
When stabilization is reached, you’ll want
the DO % Saturation reading to be
between 98-1 2%; if not, you’ll need to
re-calibrate the meter and re-take the
readings, or your data may be flagged as
“estimated” or “rejected”.
c) If the stabilized DO % Saturation reading
is satisfactory, record it to the nearest
.1%.
d) Record the time and sampler’s initials.
1 .Turn off t e meter, fully tig ten t e
calibration cup and place the unit in the
field bag.
COMMON SENSE AND EXPECTED RANGES:
Please compare your readings with the
expected ranges on the datasheet. If you’re outside
the expected range, consider re-sampling or
troubleshooting with your fellow samplers.
Conductivity readings in particular have a
nasty habit of being wacky. Stream conductivity is
rarely lower than 25 µS. If your readings are lower
than this, you might not have held the probe
completely underwater. Try taking another set of
readings.