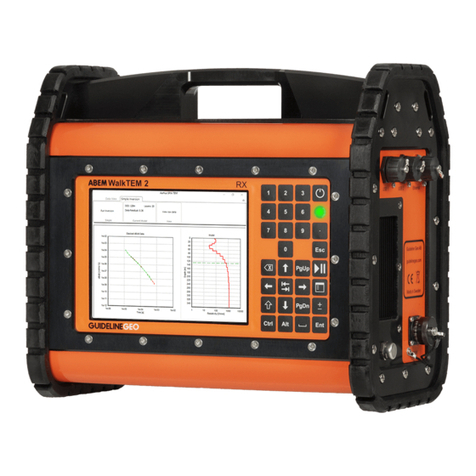
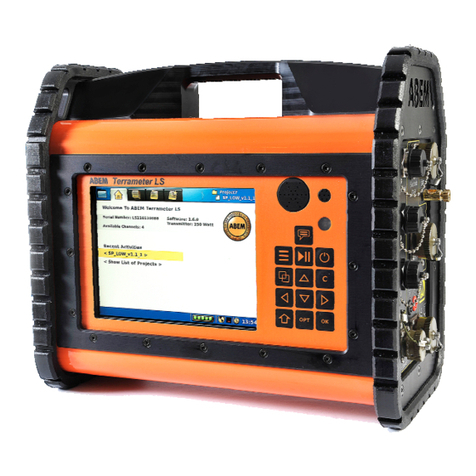
abem Terrameter SAS 4000 User manual

__________________________________________________
ABEM Product Number 33 0020 26 ABEM Printed Matter GGEO-100049
2018-08-28
Instruction Manual
Terrameter SAS 4000 / SAS 1000

ABEM Terrameter SAS 1000 / SAS 4000
- ii -
Information in this document is subject to change without notice and constitutes
no commitment by ABEM Instrument AB.
ABEM Instrument AB takes no responsibility for errors in the document or
problems that may arise from the use of this material.
© Copyright 2018 ABEM Instrument AB. All rights reserved.
ABEM Instrument AB
Löfströms Allé 6a
S-172 66 Sundbyberg
Sweden
Phone: +46 8 557 613 00
Internet: http://www.guidelinegeo.com

ABEM Terrameter SAS 1000 / SAS 4000
- iii -
WARNING! Deadly hazard!
The ABEM Terrameter SAS 4000 / SAS 1000 delivers high
voltages and currents. Always consider all cables and electrodes
connected directly or indirectly to the Terrameter to carry
current.
Stay away from cables and electrodes while the system is
operating. Wear electrically insulating boots and gloves during
field work. Disconnect cables from Terrameter / Electrode
Selector before connecting / disconnecting electrodes to / from
cables.
The operator must always keep all parts of the equipment
including instrument, electrode selector, electrode cables,
electrodes etc. under control for unauthorized persons and stray
animals while the system is operating to avoid accidents!

ABEM Terrameter SAS 1000 / SAS 4000
- iv -
1INTRODUCTION 1
1.1 UNPACKING AND INSPECTING 1
1.1.1 SHIPPING DAMAGE CLAIMS 1
1.2 WARRANTY 1
1.3 REPACKING AND SHIPPING 2
1.4 COMPLIANCE 2
2GENERAL 3
2.1 TERRAMETER SAS 4000 -THE SYSTEM 4
2.2 TERRAMETER SAS 1000 –THE SYSTEM 4
2.3 TERRAMETER SAS 1000 /4000 -GENERAL 4
2.4 TYPES OF MEASUREMENT SUPPORTED 5
2.4.1 RESISTIVITY MEASUREMENTS 5
2.4.2 INDUCED POLARIZATION MODE -CHARGEABILITY 6
2.4.3 NEGATIVE READINGS? 10
2.4.4 DC POTENTIAL MEASUREMENT (SP) 11
2.5 TECHNICAL LAYOUT OF THE SAS 1000 /4000 11
2.5.1 CURRENT AND POTENTIAL CONNECTORS 12
2.6 ACCESSORIES 12
2.6.1 THE LUND RESISTIVITY IMAGING SYSTEM 12
2.6.2 TERRAMETER SAS LOG 300 13
3OPERATING THE SAS 1000 / 4000 14
3.1 CONTROLS AND TERMINALS 14
3.1.1 CONTROLS 14
3.1.2 SPECIAL KEY SEQUENCES 15
3.1.3 MULTI CHANNEL ADAPTER (MCA) 15
3.2 WARNINGS 17
3.2.1 SAFETY 17
3.2.2 LIGHTNING 17
3.2.3 HEAT 17
3.3 MANAGING THE CONTROLLING PROGRAM 18
A tour through the SAS 1000 / 4000 program 18
3.4 MEASURING MODES OF THE SAS 1000 /4000 20
3.4.1 STATISTICAL DESCRIPTION -MEAN OR MEDIAN 20
3.4.2 VOLTAGE MEASURING MODE (SP) SURVEYS 21
3.4.3 RESISTIVITY SURVEYING MODE 21
3.4.4 INDUCED POLARIZATION SURVEYS 22

ABEM Terrameter SAS 1000 / SAS 4000
- v -
3.5 ACQUISITION TIMER 23
4POWER SUPPLY 24
4.1 BATTERY PACK 24
Safety precautions 24
4.2 EXTERNAL 12 V BATTERY ADAPTER 25
5ELECTRODES AND CABLES 26
5.1 ELECTRODES 26
5.1.1 STEEL ELECTRODES 26
5.1.2 NON-POLARISABLE ELECTRODES 26
5.1.3 IMPORTANT REMARKS CONCERNING CURRENT ELECTRODES 27
5.2 CABLE SETS 28
6LUND IMAGING SYSTEM 29
6.1 INTRODUCTION 29
6.1.1 WELCOME TO 2D AND 3D RESISTIVITY SURVEYING 29
6.1.2 POWERFUL FEATURES 30
6.1.3 ELECTRODE SELECTOR /LUND IMAGING SYSTEM 31
6.2 DATA ACQUISITION PROCEDURE 32
6.2.1 PREPARATIONS FOR FIELD SURVEYING 32
6.2.2 ESSENTIAL EQUIPMENT 32
6.2.3 RECOMMENDED ADDITIONAL EQUIPMENT 33
6.2.4 FIELD PROCEDURE FOR 2D ELECTRICAL IMAGING 33
6.2.5 USING THE LUND IMAGING SYSTEM SOFTWARE 37
6.2.6 ELECTRODE TEST 40
6.2.7 SPEED UP THE FIELD PROCEDURE 41
6.2.8 DATA COVER 42
6.2.9 AREA COVER /3D ROLL-ALONG 43
6.2.10 3D RESISTIVITY SURVEYING BY MEANS OF A NUMBER OF 2D LAYOUTS 43
6.2.11 BOREHOLE MEASUREMENTS 44
6.2.12 POSSIBLE SOURCES OF ERROR 45
6.2.13 THE ALARM CONNECTOR 46
7TERRAMETER SAS LOG 300 47
7.1 CONTROLS,TERMINALS AND LOGGING CABLE 47
7.2 OPERATING THE LOGGING SYSTEM 48
7.3 TEMPERATURE &SP LOGGING 50

ABEM Terrameter SAS 1000 / SAS 4000
- vi -
Proceed as follows: 50
7.4 RESISTIVITY AND IP LOGGING 51
7.5 THE RESISTIVITY AND IP MODES ARE EXPLAINED BELOW 51
SHORT NORMAL LOGGING 51
LONG NORMAL LOGGING 51
LATERAL LOGGING 52
7.6 FLUID RESISTIVITY AND ESTIMATION OF TDS 52
Concentrations by weight 52
7.7 PLOTTING OF LOGGING DATA 52
8UTILITY SOFTWARE 54
8.1 TERRAMETER SAS1000/SAS4000 UTILITY SOFTWARE 54
8.1.1 COMMUNICATION BETWEEN TERRAMETER AND PC COMPUTER 54
Setting the SAS 1000 / 4000 in communication mode 54
Install software on the SAS 1000 / 4000 55
Import data from the Terrameter 55
8.1.2 DATA CONVERSION 56
8.1.3 CONVERSION PROGRAM ON PC -S4KCONV.EXE 57
8.1.4 MEASUREMENT PROTOCOL GENERATION AND MANAGEMENT 58
Error Codes in MPFC program 59
8.1.5 FORMAT OF LUND IMAGING ADDRESS,PROTOCOL AND LOCATION FILES 60
Cable Description Files (Address Files) 60
Protocol Files 61
Geometry Files 62
8.1.6 FORMAT OF VES PROTOCOL FILES 63
8.2 ERIGRAPH 64
8.2.1 DATA CONVERSION 64
8.2.2 PSEUDOSECTION PLOTTING 65
8.2.3 2D AND 3D MODEL INTERPRETATION 67
8.2.4 DATA QUALITY CHECKING AND EDITING 68
9SERVICING THE EQUIPMENT 70
9.1 GENERAL PRECAUTIONS 70
9.2 DATA STORAGE MEMORY 70
9.3 ERROR CODES 70
9.4 STORAGE AND HUMIDITY 70
9.5 PERIODIC CHECKS 71
9.5.1 TERRAMETER SAS 1000 /4000 -CHECK 71

ABEM Terrameter SAS 1000 / SAS 4000
- vii -
9.5.2 QUICK CHECK OF SAS 1000 /4000 72
9.6 TESTING OF LUND EQUIPMENT 73
9.6.1 FAST CONTINUITY TEST OF CABLE AND RELAY SWITCH 73
9.6.2 SPECIAL CHECKS IN THE MODULE “TEST SOFTWARE”74
Check Cable Isolation. 74
Auto Relay Test 74
Manual Relay Switching 74
9.6.3 TERRAMETER SAS LOG 300 -CHECKS 75
10 APPENDIX A. BASIC PRINCIPLES OF RESISTIVITY SURVEYING 76
10.1 GENERAL 76
10.1.1 RESISTIVITITY OF NATURAL MATERIALS 76
10.1.2 MEASUREMENT PRINCIPLES 78
10.2 MULTIPLE GRADIENT ARRAY SURVEYING 80
10.2.1 SURVEYING PRINCIPLES 80
10.2.2 PSEUDOSECTION PLOTTING 81
10.3 REFERENCES 81
11 APPENDIX B. TERRAMETER ERROR CODES 83
12 APPENDIX C. MPFC ERROR CODES 86
13 APPENDIX D. ES464 / ES10-64 ADDRESS, TAKE-OUT AND PIN CONNECTOR
RELATION 88
14 APPENDIX E. ADDRESS AND PROTOCOL FILES 90
14.1 EXAMPLE ADDRESS FILES 90
Example Address Files for CVES 90
Example Address Files for Areal/3D Cover 91
14.2 EXAMPLE PROTOCOL FILES 92
Example: Wenner Array Protocol File 92
Example: Dipole-dipole Array Protocol File 92
Example: Gradient Array Protocol File 93
Example: Pole-pole Array Protocol File using one channel 93
Example: Pole-pole Array Protocol File using three channels (POL3SS) 93
14.3 EXAMPLE LOCATION /GEOMETRY FILE 94
14.4 WENNER_L +WENNER_S: 1-CHANNEL WENNER CVES WITH 4ELECTRODE
CABLES96
14.5 GRAD4L(X)8 +GRAD4S8: 4-CHANNEL MULTIPLE GRADIENT ARRAY CVES WITH 4
ELECTRODE CABLES 97

ABEM Terrameter SAS 1000 / SAS 4000
- viii -
14.6 DIPDIP4L +DIPDIP4S: 4-CHANNEL DIPOLE-DIPOLE ARRAY CVES WITH 4
ELECTRODE CABLES 98
14.7 POLDIP4L +POLDIP4S: 4-CHANNEL POLE-DIPOLE ARRAY CVES WITH 4ELECTRODE
CABLES99
14.8 GRAD3L6 +GRAD3S6: 3-CHANNEL MULTIPLE GRADIENT ARRAY CVES WITH 4
ELECTRODE CABLES 100
14.9 GRAD1L7 +GRAD1S7: 1-CHANNEL MULTIPLE GRADIENT ARRAY CVES WITH 4
ELECTRODE CABLES 101
14.10 WEN32SX: 1-CHANNEL WENNER CVES WITH 2ELECTRODE CABLES 102
14.11 POL3SS: 3-CHANNEL POLE-POLE CVES WITH 2ELECTRODE CABLES 103
14.12 POL3L: 3-CHANNEL POLE-POLE CVES WITH 4ELECTRODE CABLES 104
14.13 SQUARE2A, SQUARE2B AND SQUARE2C: SQUARE ARRAY AREA COVER WITH
TWO ELECTRODE SPACINGS 105
14.14 POL8X8: POLE-POLE IN 8X8SQUARE GRID 106
14.15 POL21X7A-F: 3CHANNEL POLE-POLE 3D ROLL-ALONG SURVEYING 108
14.16 POLDIP_A AND POLDIP_O: 4CHANNEL POLE-DIPOLE 2D TO 3D SURVEYING 109
15 APPENDIX F. S4KCONV 110
15.1 DESCRIPTION 110
15.2 SYNTAX 110
-F:type 110
-options 110
wildcard 111
@filename 111
15.3 EXAMPLES 111
15.4 ERROR CODES S4KCONV 112
16 APPENDIX G. AMP FILE FORMAT 113
16.1 BASIC PRINCIPLES 113
16.2 DETAILS,LINE BY LINE 113
16.3 HEADER 114
Index coordinate type 114
XYZ:0|1|2|3 115
16.4 DATA 115
16.5 TOPOGRAPHY 116
General Topography Information 116
Electrode Locations 117
16.6 REMARKS 117
16.7 EXAMPLES 119

ABEM Terrameter SAS 1000 / SAS 4000
- ix -
17 APPENDIX H. ERIGRAPH FILE FORMATS 123
17.1 INTRODUCTION 123
17.2 PSEUDOSECTION PLOTTING AND FILE FORMAT 123
17.3 INVERTED MODEL PLOTTING AND FILE FORMAT 123
17.4 TOPOGRAPHY 124
17.5 USER DEFINED TEXT 125
17.6 LEVEL MARKERS 125
17.7 REFERENCE DATA 126
18 APPENDIX I. TECHNICAL SPECIFICATIONS 127
18.1 TERRAMETER SAS 1000 /4000 -SPECIFICATIONS 127
18.2 ELECTRODE SELECTOR ES464 -SPECIFICATIONS 129
18.3 ELECTRODE SELECTOR ES10-64C(E)-SPECIFICATIONS 129
18.4 TERRAMETER SAS LOG 300 -SPECIFICATIONS 130
19 APPENDIX J. REMOTE CONTROL 131
19.1 COMMUNICATION PARAMETERS 131
19.2 COMMANDS AND SYNTAX 131
19.2.1 DELETE 131
DEL filename(s) 131
19.2.2 DIR 131
DIR path 131
19.2.3 EXIT 131
EXT 131
19.2.4 INSTALL SOFTWARE 132
INS filename 132
19.2.5 SEND SERIAL NUMBER 132
GID 132
19.2.6 SEND VERSION STRING 132
VER 132
19.2.7 SET DATE AND TIME 132
STM yyyy/mm/dd hh:mm:ss132
19.2.8 SET DEFAULT 132
DFL 132
19.2.9 SET ERROR CHECKING 133
SEC err4,err5,algorithm,speed133
19.2.10 SET IP 133

ABEM Terrameter SAS 1000 / SAS 4000
- x -
STI ImA , Imode , fs, tOn/Off , tD, t0(index) , mult , N133
19.2.11 SET MODE 134
OPM mode134
19.2.12 SET RESISTIVITY 134
STR ImA, Imode, fs, tD, tAcq134
19.2.13 SET SP 135
STS t135
19.2.14 SETSTACK 135
SAS Nmin, Nmax, Elimit, Norm 135
19.2.15 SOUND 135
SND freq, freq, freq.135
19.2.16 CONTACT TEST 135
TST 135
19.2.17 TRIG 136
TRG 136

ABEM Terrameter SAS 1000 / SAS 4000
- 1 -
1INTRODUCTION
This Instruction Manual covers operation, maintenance and, where appropriate, reduction of
data. A careful study of this manual is recommended before starting to work with the
equipment.
ABEM products are carefully checked at all stages of production and are thoroughly tested
before leaving our factory. They should provide many years of satisfactory service if handled
and maintained according to the instructions given in this manual.
ABEM will be pleased to receive occasional reports from you concerning your use of and
experience with the equipment. We also welcome your comments on the contents and
usefulness of this manual. In all communication with ABEM be sure to include the instrument
types and serial numbers. Contact details:
Address: ABEM Instrument AB, Löfströms Allé 6a 1, S-172 66 Sundbyberg, Sweden.
Phone number: +46 8 557 613 00
Information about ABEM:s product range is available on internet:
http://www.guidelinegeo.com. Also the most recent version of interpretation software are
available on: www.guidelinegeo.com.
In general, e-mail correspondence gives the fastest response.
In view of our policy of progressive development, we reserve the right to alter specifications
without prior notice.
IMPORTANT
It is important that you as a user of the instrument notify ABEM about your name and
address. This allows us to keep you updated with important information about the instrument
and e.g. upgrades of the built-in software and documentation. Please send your name and
address directly to ABEM, utilize the Warranty Registration Card delivered along with the
instrument.
1.1 UNPACKINGAND INSPECTING
Use great care when unpacking the instrument. Check the contents of the box or crate against
the packing list that is included. Inspect the instrument and accessories for loose connections
and inspect the instrument case for any damage that may have occurred due to rough handling
during shipment.
1.1.1 Shipping damage claims
File any claim for shipping damage with the carrier immediately after discovery of the
damage and before the equipment is put into use. Forward a full report to ABEM, making
certain to include the ABEM delivery number, instrument type(s) and serial number(s).
All packing materials should be carefully preserved for future re-shipment, should this
become necessary.
1.2 WARRANTY
ABEM warrants each instrument manufactured by them to be free from defects in material
and workmanship. ABEM's liability under this warranty is limited in accordance with the
terms of General Conditions for the Supply of Mechanical, Electrical and Associated

ABEM Terrameter SAS 1000 / SAS 4000
- 2 -
Electronic Products (ORGALIME). It covers the servicing and adjusting of any defective
parts (except tubes, transistors, fuses and batteries). The Warranty is effective for twelve (12)
months after the date of Bill of Lading or other delivery document issued to the original
purchaser, provided that the instrument is returned carriage paid to ABEM, and is shown to
ABEM's satisfaction to be defective. If misuse or abnormal conditions have caused the fault,
repairs will be invoiced at cost.
Should a fault occur that is not correctable on site, please send full details to ABEM. It is
essential that instrument type and serial number is included and, if possible, the original
ABEM delivery number. On receipt of this information, disposition instructions will be sent
by return. Freight to ABEM must be prepaid. For damage or repairs outside the terms of the
Warranty, ABEM will submit an estimate before putting the work in hand.
Be sure to fill in the warranty registration card (included with the equipment) correctly and
return it to ABEM promptly. This will help us process any claims that may be made under the
warranty. It will also help us keeping you informed about e.g. free software upgrades. ABEM
welcomes your response at any time. Please let us know your name and address, and the serial
number of the instrument.
1.3 REPACKINGAND SHIPPING
ABEM packing is designed for the instruments concerned and should be used whenever
shipping becomes necessary. If original packing materials are unavailable, pack the
instrument in a wooden box that is large enough to allow some 80 mm of shock absorbing
material to be placed all around the instrument. This includes top, bottom and all sides. Never
use shredded fibers, paper or wood wool, as these materials tend to pack down and permit the
instrument to move inside its packing box. Do not return instruments to ABEM until
shipping instructions have been received from ABEM. Contact ABEM via
1.4 Compliance
The Terrameter SAS 4000 / SAS 1000 and the accessories are in conformity with the essential
requirements in the Low Voltage Directive 73/23/EEG, 93/68/EEG and the Electromagnetic
Compatibility Directive 89/336/EEG of the EC.

ABEM Terrameter SAS 1000 / SAS 4000
- 3 -
2GENERAL
The Terrameter SAS system consists of a basic unit called the Terrameter SAS 1000 or SAS
4000 which can be supplemented as desired with accessories such as the ABEM LUND
electrode systems and the ABEM SAS LOG 300 borehole logging unit. This manual covers
the operation of SAS 1000 and SAS 4000 as well as these accessories.
SAS stands for Signal Averaging System - a method whereby consecutive readings are taken
automatically and the results are averaged continuously. SAS results are more reliable than
those obtained using single-shot systems.
•SAS 1000 / 4000 can be used for resistivity surveys, IP surveys and self-potential surveys.
•The ABEM LUND system is an automatic electric imaging system, suited for automatic
resistivity, IP and SP profiling.
•The SAS Log 300 (optional) provides an efficient, simple way of extending your survey
into wells and drill holes. It consists of a 300m cable with logging probe, electrodes,
temperature transducer, water level indicator and resistivity cell, all mounted on a
backpacking frame.
The applicability of the different resistivity and IP methods supported by the SAS 1000 /4000
is summarized in table 2-1 below.
Object of search or investigation
SP
VES
Imaging
IP
Archeological sites
x
Cavities in subsurface
x
Clays, peat and soil
x
x
Dam safety and leakage
x
(x)1
Fissures in rock
x
Fracture zones in rock
x
Groundwater in crystalline rock
x
Groundwater in sedimentary areas
x
x
Groundwater / clay distinction
x
x
Groundwater flow
x
Ores in hard rock areas
x
x
x
Overburden thickness
x
x
Pollution of soil and groundwater
x
Saltwater invasion
x
x
x
Waste mapping / characterisation
x
x
1
Monitoring.
2
Parasnis, D. S., Principles of Applied Geophysics, 5 edition, 1997. Chapman & Hall.
Table 2-1: Applicability of different resistivity and IP methods. Modified from Parasnis
(1997)2. SP=Self Potential, VES=Vertical Electrical Sounding, Imaging=Profiling
(with different electrode separations), IP=Induced Polarization.

ABEM Terrameter SAS 1000 / SAS 4000
- 4 -
2.1 TERRAMETER SAS 4000 - THE SYSTEM
The Terrameter SAS 4000 system consist of the following components:
•SAS 4000 instrument with four input channels, including clip-on battery tray
•External Battery Connector
•RS 232 cable (with KPT connector to SAS 4000 and DSUB connector to PC)
•Documentation kit (two sets of Operators Manual, Warranty Registration Card)
•CD with software
2.2 TERRAMETER SAS 1000 –THE SYSTEM
The Terrameter SAS 1000 system consist of the following components:
•SAS 1000 instrument with one input channel
•External Battery Connector
•RS 232 cable (with KPT connector to SAS 4000 and DSUB connector to PC)
•Documentation kit (two sets of Operators Manual, Warranty Registration Card)
•CD with software
2.3 TERRAMETER SAS 1000 / 4000 - GENERAL
The Terrameter SAS 1000 / 4000 can operate in three modes:
•In the resistivity surveying mode, it comprises a battery powered, deep-penetration
resistivity meter with an output sufficient for a current electrode separation of 2000 meters
under good surveying conditions. Discrimination circuitry and programming separates DC
voltages, self potentials and noise from the incoming signal. The ratio between voltage and
current (V/I) is calculated automatically and displayed in digital form in kiloohms, ohms or
milliohms. If array geometry data is available, apparent resistivity can be displayed. The
overall range thus extends from 0.05 milliohms to 1999 kiloohms.
•In the Induced Polarization mode the SAS 1000 / 4000 measures the transient voltage
decay in a number of time intervals. The length of the time intervals can be either constant
or increasing with time. The IP effect is thus measured in terms of chargeability [msec
V/V].
•In the voltage measuring mode, the SAS 1000 / 4000 comprises a self potential instrument
that measures natural DC potentials. The result is displayed in V or mV. Optional non-
polarisable electrodes are available for e.g. self potential surveys.
A useful facility of the Terrameter SAS 1000 / 4000 is its ability to measure in four channels
simultaneously. This implies that as well resistivity and IP measurements as voltage
measurements can be performed up to four times faster. The electrically isolated transmitter
sends out well-defined and regulated signal currents, with a strength up to 1000 mA and a
voltage up to 400 V (limited by the output power 100 W). The receiver discriminates noise
and measures voltages correlated with transmitted signal current (resistivity surveying mode
and IP mode) and also measures uncorrelated DC potentials with the same discrimination and
noise rejection (voltage measuring mode). The microprocessor monitors and controls
operations and calculates results.
In geophysical surveys, the SAS 1000 / 4000 permits natural or induced signals to be
measured at extremely low levels, with excellent penetration and low power consumption.

ABEM Terrameter SAS 1000 / SAS 4000
- 5 -
Moreover, it can be used in a wide variety of applications where effective signal/noise
discrimination is needed.
It can be used to determine the ground resistance of grounding arrangements at power plants
and along power lines and (in a pinch) it can even be used as an ohmmeter. The strength of
the SAS 1000 / 4000 is its ability - thanks to the induced polarization mode - to distinguish
between geological formations with identical resistivity, e.g. clay and water.
Some of the highlights in the specifications characterizing the SAS 1000 / 4000 Terrameter
are listed below:
•Resolution 1 V (at 0.5 sec integration time)
•Bitstream A/D conversion
•Three automatically selected measurement ranges (250 mV, 10 V and 400 V)
•Dynamic range as high as 140 dB at 1 sec integration time, 160 dB at 8 sec integration
time
•Precision and accuracy better than 1% over whole temperature range
•Galvanic separated input channels (SAS 4000)
•Built-in PC compatible microcomputer
•More than 1,000,000 data points can be saved on the internal flash disk
•Fast and highly time-efficient data acquisition
2.4 TYPES OF MEASUREMENT SUPPORTED
The transmitted current is commutated in a waveform suitable either for resistivity surveying
or for induced polarization measurements.
2.4.1 Resistivity measurements
The receiver measures the response voltage signal (plus self-potential and ground noise) at
discrete time intervals when the eddy currents, the induced polarization and the cable
transients have decayed to low levels.
The operator can select between different time scales. Under most conditions a cycle time of
approximately 2.6 sec (which corresponds to an acquisition delay of 0.2 sec and an
acquisition time of 0.3 sec) will work fine. However, under extreme depth and resistivity
conditions the corresponding time cycles should be increased. Under normal conditions the
measuring technique is equivalent to pure DC surveying.

ABEM Terrameter SAS 1000 / SAS 4000
- 6 -
The current amplitude is set automatically by the instrument, but can also be controlled by the
operator to suit the actual survey conditions. It can be set to values from 1 mA up to 1000
mA. The maximum voltage at the current electrodes is 400 V. It is recommended to use the
AUTO setting, which implies that the instrument sets the optimum value.
In the resistance measuring mode, the Terrameter SAS 1000 / 4000 measures voltage
responses created by the transmitter current while rejecting both DC (SP) voltage and noise.
The ratio V/I is automatically calculated and displayed digitally in kiloohms [k], ohms []
or milliohms [m]. The relevant receiver resistance range is automatically selected.
The result is displayed to 3 or 4 digits. When the transmitter is operating at 500 mA, the
Terrameter SAS 1000 / 4000 has a resolution of 0.02 mfor a single reading.
To take full advantage of the outstanding capabilities of the Terrameter SAS 1000 / 4000, care
must be observed in the arrangement of cables and electrodes used in the field. Current
leakage and creep can substantially reduce the attainable accuracy and sensitivity and thus the
depth penetration.
2.4.2 Induced polarization mode - Chargeability
In IP mode the current is transmitted symmetrically, i.e. that the positive and negative
polarities are of equal length. A complete cycle consist of one positive part of length T (called
current on) and one negative part of the same length T (current off). This time can be set to
the following values: 1, 1.5, 2, 2.5, 3, ... sec in steps of 0.5 sec.
Period
Current
Voltage
Receiving intervals
Figure 1. Timing diagram of the Terrameter SAS 1000 / 4000 in resistivity mode. The full-
drawn curve shows the transmitted current, and the dotted curve an example of
the measured voltage in the presence of noise. The three receiving intervals are
shown at the bottom line.

ABEM Terrameter SAS 1000 / SAS 4000
- 7 -
As in resistivity mode the current amplitude is set automatically by the instrument, but can
also be controlled by the operator. It can be set to values from 1 mA up to 1000 mA. The
maximum voltage at the current electrodes is 400 V.
In the induced polarization mode (IP) the SAS 1000 / 4000 measures the transient decay of
the voltage when the transmitted current is turned off. The voltage is integrated over a number
of time intervals, and the SAS 1000 / 4000 can measure in up to ten such time intervals. The
total integration time is limited to 8 sec. The first interval starts after the initial time delay
td
. The length of the different time intervals can be expressed by the relation
t n f t
ii
= −10
where
•
t0
is the fundamental time interval (20 msec in areas with 50 Hz main power frequency,
respectively 16.67 msec in areas with 60 Hz power frequency)
•nis a multiplying factor (default = 1)
•f = 1 or 2 (default f = 2) is an incremental exponent
•i is the time window index (1, 2, ... , 10)
Four parameters are needed in order to specify the way SAS 1000 / 4000 measures the
induced polarization:
•The initial time delay (10, 20, 30, .... msec). Default is 10 msec. Maximum is 10 sec.
•The length of the first time window (column one in the tables below). Default is 100 msec.
•The number of time windows (from one to ten). Default is 1.
•The incremental factor: 1 corresponding to the first of the tables below, 2 corresponding to
the last of the tables.
Period
Current
Voltage
Measuring intervals
Figure 2. Timing diagram of the Terrameter SAS 1000 / 4000 in IP mode. The full-drawn
curve shows the transmitted current, and the dotted curve an example of the
measured decaying voltage in the presence of noise. In this example there is almost
no IP effect. The two receiving intervals are shown at the bottom line. Each
measuring interval can consist of up to ten time windows.

ABEM Terrameter SAS 1000 / SAS 4000
- 8 -
Window number (incremental factor = 1)
1
2
3
4
5
6
7
8
9
10
20*
20*
20*
20*
20*
20*
20*
20*
20*
20*
100
100
100
100
100
100
100
100
100
100
200
200
200
200
200
200
200
200
200
200
500
500
500
500
500
500
500
500
500
500
1000
1000
1000
1000
1000
1000
1000
1000
Window number (incremental factor = 2, power line frequency = 50 Hz)
1
2
3
4
5
6
7
8
9
10
20
40
80
160
320
640
1280
2560
100
200
400
800
1600
3200
200
400
800
1600
3200
500
1000
2000
4000
1000
2000
4000
Window number (incremental factor = 2, power line frequency = 60 Hz)
1
2
3
4
5
6
7
8
9
10
16.7
33.3
67
133
267
533
1067
2133
100
200
400
800
1600
3200
200
400
800
1600
3200
500
1000
2000
4000
1000
2000
4000
Table 2-2: The length of each of the time window (measured in msec) when the incremental
factor is 1. The * indicates that in countries with 60Hz power line frequency, the
value is 16.67 msec in stead of 20 msec.
Table 2-3: The length of each of the time window (measured in msec) when the incremental
factor is 2. This table is valid in countries with 50Hz power line frequency.
Table 2-4: The length of each of the time window (measured in msec) when the incremental
factor is 2. This table is valid in countries with 60Hz power line frequency.

ABEM Terrameter SAS 1000 / SAS 4000
- 9 -
Whenever the sum of the time windows in use exceeds the current on (off) time T, this time is
extended so that the current off time exceeds the sum of the active time windows plus the
initial time delay. Observe, that the total integration time cannot exceed 8 sec. This explains
the "white" area in the tables above.
The SAS 1000 / 4000 measures the time-domain quantity called chargeability Mtiti+1 defined
in the following way:
( )
MVV t dt
t t t
t
i i i
i
+
+
=
1
1
1
0
[msec] (1)
where V(t) is the decaying voltage, tiand ti+1 is the start and stop time of the interval, and V0is
the voltage measured before the current is turned off. The terminology refers to figure 2. The
chargeability is measured in the unit msec. Alternatively, the chargeability can be presented as
mV/V:
( ) ( )
dttV
ttV
Mi
i
ii
t
t
ii
tt +
+−
=
+
1
110
1
[mV/V] (2)
For further reference on the chargeability, see e.g. Parasnis
3
chapter 5.
3
D. S. Parasnis, Principles of Applied Geophysics, 5. edition, 1997. Chapman and Hall.
t1
t2
t3
t4
time
Current is
turned off at
time t=0
Transient
voltage decay
curve
Figure 3. The IP decay curve. The chargeability is measured as the area between two time
values. For example M20,40 represents the chargeability measured in the interval
between 20-40 msec. The delay before the measurements starts are denoted by tD=
t1

ABEM Terrameter SAS 1000 / SAS 4000
- 10 -
-20
0
20
40
60
80
100
120
0
10
20
30
40
50
60
70
80
90
100
110
120
130
Time [msec]
Figure 3 is a synthetic example illustrating the noise reduction effect of the chargeability. In
the figure is shown an exponential decay curve 100exp(-t/) with the decay constant =25
msec. Also shown is the decay curve with added harmonic power-line voltage (50 Hz, 10V)
and normal distributed noise with standard deviation 10V.
Integration over a time window, e.g. 10-30 msec, shows that the chargeability is only little
affected by the noise. In this particular example the deviation is 2.3% between the true
exponential decay curve and the curve superimposed with noise.
2.4.3 Negative readings?
Negative resistivity readings can occur, but in general, these are not caused by geological
formations if standard electrode arrays are used. Hence, negative resistivity readings are
normally a sign of serious measurement quality problems, and the cause should be
investigated. Typical causes are poor electrode grounding resulting in low transmitted power
and possible capacitive coupling. If the ground is dry the electrode contact must be improved
by e.g. watering and possibly connecting several electrodes to each electrode point. Inspect all
connectors and cable jumpers for dirt, oxide and damage that may cause data quality
problems. High noise level or the influence from close-by objects like fences or steel pipes in
electrical contact with the ground might also cause non-expected results.
Negative IP readings, on the other hand, are to be expected in many cases, even though the
intrinsic chargeability never can become negative. On a stratified ground negative IP readings
can occur in certain cases when the subsurface layer is more conducting relative to the upper
Figure 4. Synthetic example illustrating the noise reduction effect in the chargeability. In
this example the difference between the chargeabilities M10,30 measured from 10
msec to 30 msec on the smooth exponential decay curve and the "noisy" curve is
only 2%.
Exponential decay
curve with added
harmonic voltage (50
Hz, 10V) and normal
distributed noise
(StDev=10V)
Time
window
This manual suits for next models
1
Table of contents
Other abem Measuring Instrument manuals
Popular Measuring Instrument manuals by other brands

BRONKHORST
BRONKHORST MASS-STREAM D-6200 instruction manual

Helios
Helios CO2 AP-A Installation and operating instructions

ThermoWorks
ThermoWorks BlueDOT TX-1400 Function guide

Balluff
Balluff BML SL1-ALZ-ZZ Series Condensed guide

Apogee Instruments
Apogee Instruments MQ-620 owner's manual

Kimo
Kimo LV 130 user manual