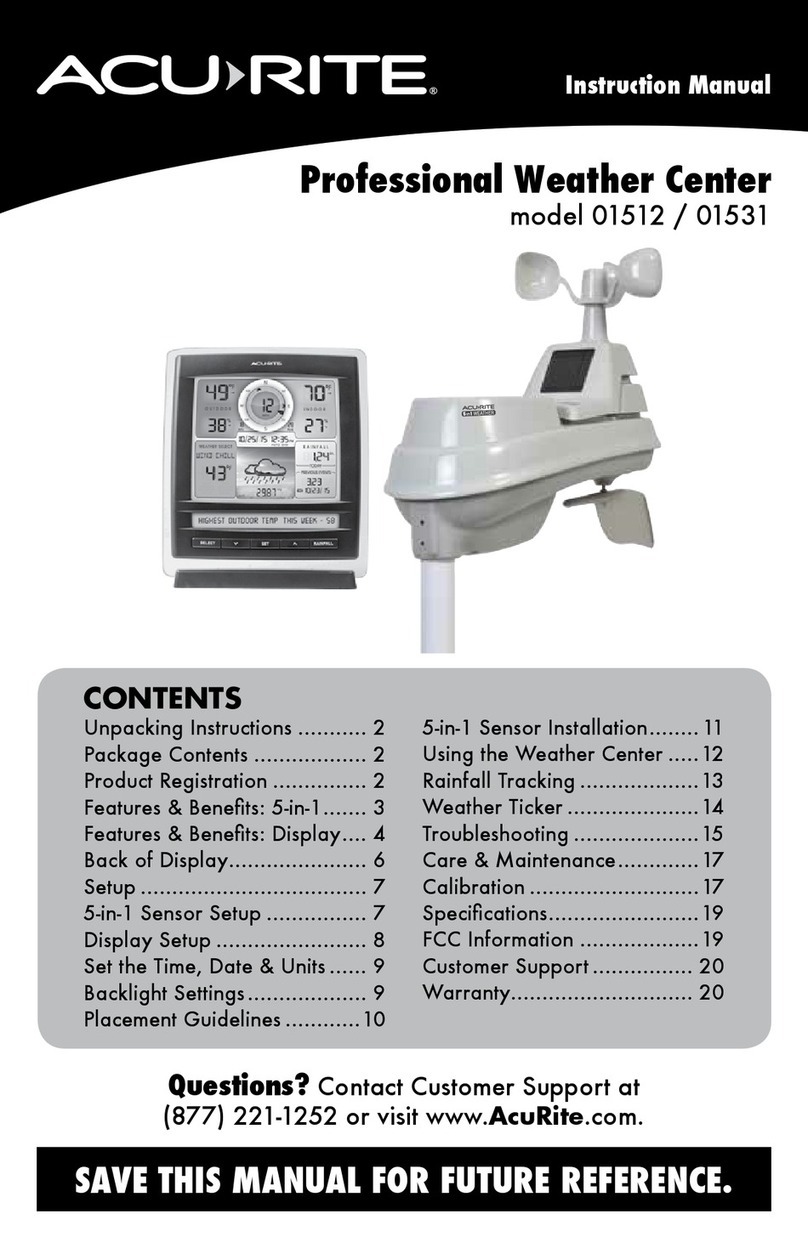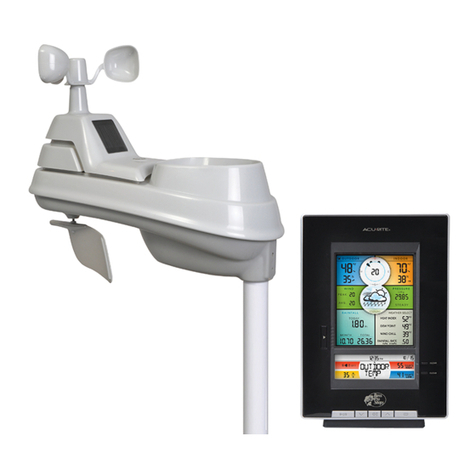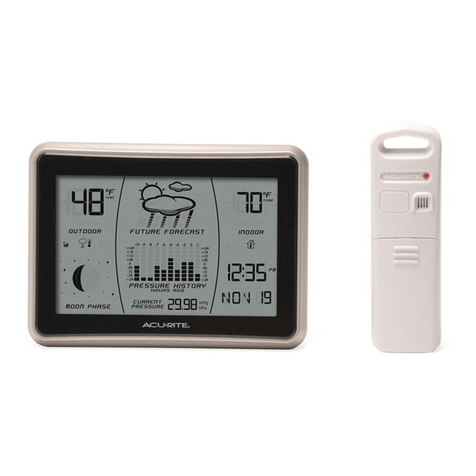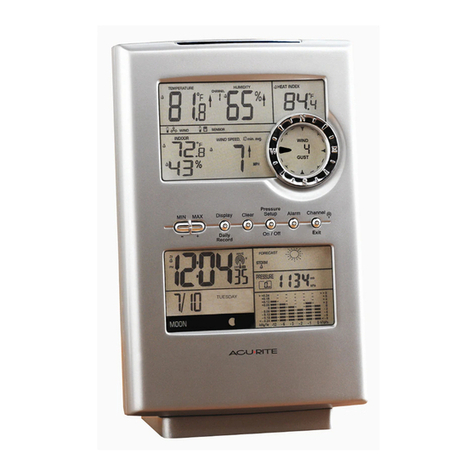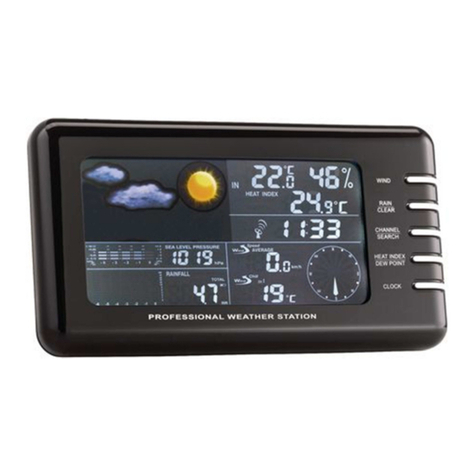
7 MAIN UNIT FEATURES
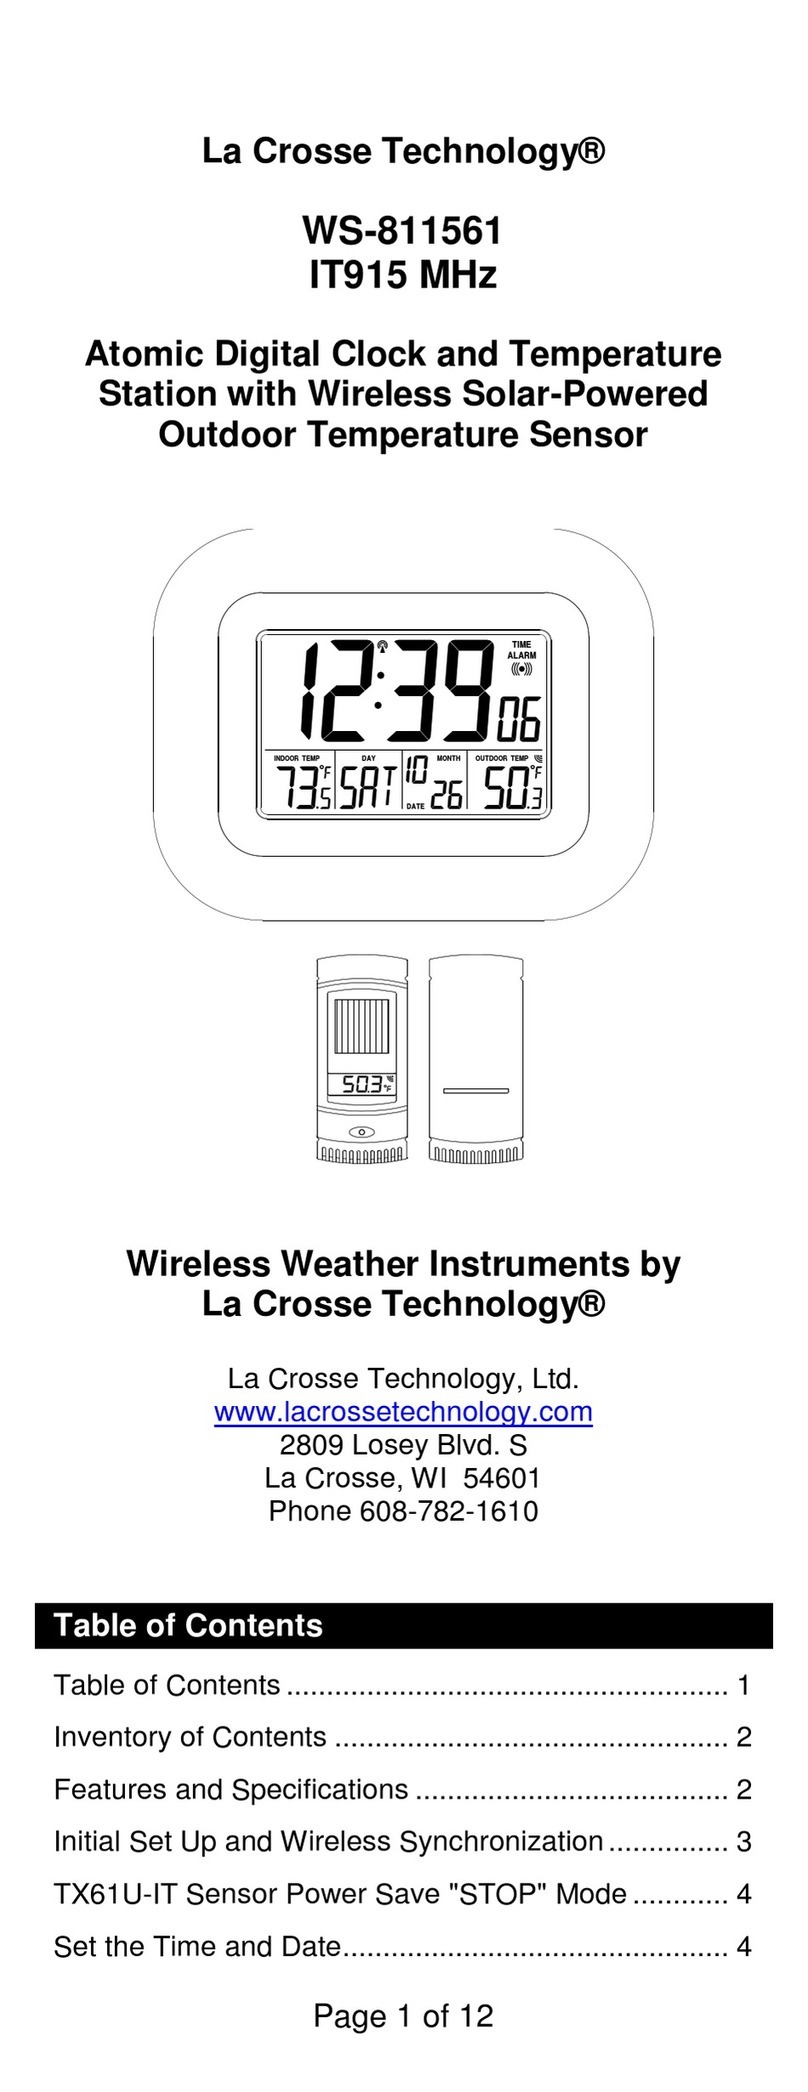
Radio-controlled Clock : The unit starts synchronizing the clock after the 1stchannel
of the wireless sensor begins to send its information to the main unit. (This is called
registration.) The built-in antenna receives the official time signal from the US
Government's National Institute of Standards and Technology. A microchip translates
the time signal and adjusts the time display for the correct time, and date.
NOTE: You cannot change any settings manually if the clock is attempting to synchro-
nize. Allow the clock to finish the cycle, and then manual changes can be made if the
clock has not automatically acquired the signal and set itself to the correct time.
Time Zone:
Note: Default setting is Pacific Time. If you live outside of the Pacific Time Zone, you will
need to set your Time Zone using the following procedure:
1)Press and hold the - (minus) button on the front of the clock for three seconds. The
area of the clock where the seconds are usually displayed will be replaced with the letter
for the time zone it is currently set in.
2) If set to the default setting, you will see a flashing letter "P" on the screen after
pressing and holding the - (minus) button. Pressand release the - (minus) button until
the letter shown corresponds to your time zone:
P =Pacific M =Mountain C =Central E =Eastern
Once your zone is displayed, there is nothing more you need to do. After about 3
seconds, the seconds will once again be displayed on your clock.
The antenna icon will flash on and off during synchronization. If the icon disappears, this
indicates that the radio signal is not available. If you are unable to obtain a signal after a
long period of time, try placing the base unit away from sources of interference such as
computers, televisions, cordless phone bases,and other electronic items.
Note: The synchronization process can take 24-72 hours.
Manually setting the time and date:
1)Press and hold the set button, and the year display will flash on the screen. Using the
+ and - buttons set the year. When the correct year is entered, press and release the set
button to confirm the setting.
2) Once you have confirmed the year, follow the same procedure to set the month, date,
hour, minute, 12or 24-hour time preference, and DST(Daylight Saving Time).
Celsius/Fahrenheit:
Pressand release the - (minus) button. A beep is heard, and the display will change - to
either Fahrenheit or Celsius.
Barometer Set Up:
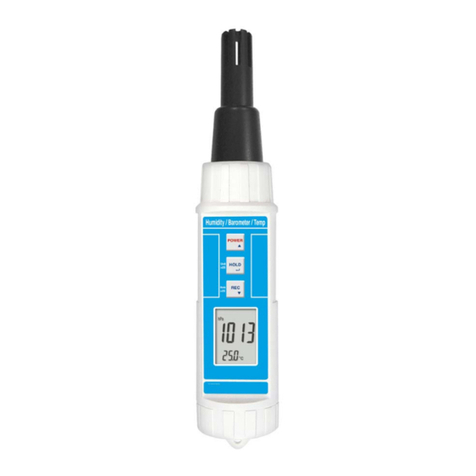
When the main unit power comes on, the pressure section will display 1013for 60
seconds. The digital barometer will calculate and forecast the weather conditions. Your
instrument will not provide a reliable forecast unless your current barometric pressure
is set.
6
Adjust the barometric pressure to reflect your current conditions:
NOTE: Please see http://weather.unisys.com/surface/sfc_con_pres.htmlto helpset
andadjust the barometric pressure.
1)Hold PRESSUREbutton for 3 seconds
2) Press P+, and/or P-to adjust the air pressure according to the current pressure.
3) Press the PRESSUREbutton to confirm the setting
Moon Phase: • } DOO OG{
The moon phase will automatically display based on the calender date. The moon phase
display will scroll from left to right, and pause for about 5 seconds to display the current
moon phase. NOTE:the moonphase will not be correct unless the date and year are
programmed correctly.
( OTHER ADJUSTMENTS
Changingthe Pressure Scale: To change the scale between mb (milibars) hPA
(hectoPascals) and inHg (inches of mercury), hold the P- button for three seconds.
)
View Pressure History: Toview air pressure from O(current) to the past 12hours,
press the PRESSUREbutton. The hour is displayed in the small box in the pressure
portion of the upper display. Eachtime you press PRESSURE,the value changes to that
of the previous hour.
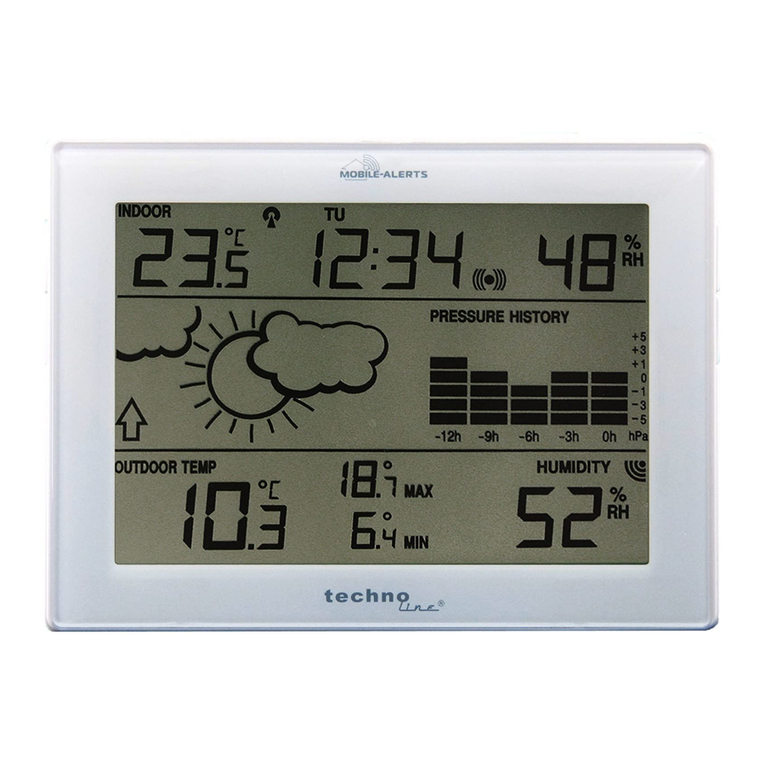
NOTE: The sample base station Upper Display (illustrated in section 5) shows what the
pressure is, the current hour being zero (0). This pressure history is available only after
the barometer has operated and kept pressure data for 12continuous hours.
Barometer History Graph:The bar chart just below the air pressure display, shows the
pressure readings (range from +0.24 inHg to -0.24 inHg/ -8 hPa mb to +8 hPa mb) of
the current and past 1,2, 3, 6 and 12hour periods.
WEATHER FORECASTING
The main unit predicts weather conditions of the next 12- 24 hours based on the
changes in atmospheric pressure. The coverage area is approximately 19-31miles (30 -
50 km). The weather forecast is based on atmospheric pressure changes and is approxi-
mately 70-75% correct. As weather conditions cannot be 100% correctly forecasted, we
cannot be responsible for any loss caused by an incorrect forecast.
SUNNY PARTLY CLOUDY CLOUDY RAIN/SNOW STORMY
cDD
Trend Indicators: (FLASHES)
Arrow indicators beside the upper display outdoor temperature and humidity readings
show: Rising Steady Falling
■
t
The arrow icons will indicate rising, steady or falling if the temperature or humidity
change is more than 1unit (degree/percent) within an hour.
7

