AMS TMF882X User manual

Document Feedback
TMF882X
Content Guide
Demo Kit Manual •PUBLIC
UG000495 •v4-00 • 2021-Dec-01
33 │2
Content Guide
1Introduction ................................... 3
1.1 Kit Content....................................................3
1.2 Ordering Information ....................................4
2Setting Up the EVM ....................... 5
2.1 Setting Up the EVM Hardware.....................5
3Using the EVM Software............... 8
3.1 Controls for All Tabs...................................10
3.2 EVM GUI "Main" Tab..................................14
3.3 EVM GUI "3D" Tab.....................................20
3.4 EVM GUI "Interrupt" Tab............................21
3.5 EVM GUI "File Upload" Tab.......................22
3.6 Automation of Measurements.....................23
4Drivers ..........................................28
5Schematics, Layers and BOM.....29
5.1 Daughter Card............................................29
6Revision Information...................32
7Legal Information.........................33

Document Feedback
TMF882X
Introduction
Demo Kit Manual •PUBLIC
UG000495 •v4-00 • 2021-Dec-01
33 │3
1 Introduction
The Time-of-Flight (hereafter referred to as ‘ToF’) EVM demonstration kit provides a way to evaluate
ToF optical sensor(s) from ams AG. This document is a basic user guide to the setup and operation of
the ToF EVM software.
1.1 Kit Content
Below is a checklist of what is included in the ToF EVM kit.
●ToF sensor EVM enclosure and sample glass (some EVMs come without an enclosure)
●USB type A to micro-USB cable(s)
●USB flash drive with EVM GUI software
●EVM documentation (including this guide)
Figure 1:
Kit Content

Document Feedback
TMF882X
Introduction
Demo Kit Manual •PUBLIC
UG000495 •v4-00 • 2021-Dec-01
33 │4
1.2 Ordering Information
Ordering Code
Description
TMF8821-EVM
TMF8821 EVM
TMF8828-EVM
TMF8828 EVM
As TMF8821 is a superset of the functions of TMF8820, ams recommends to use the TMF8821 EVM
for evaluating the performance of TMF8820 and TMF8821.
The TMF8828 is a superset of the TMF8821, ams recommends to use the TMF8828 EVM for
evaluating the performance of TMF8820, TMF8821, and TMF8828.

Document Feedback
TMF882X
Setting Up the EVM
Demo Kit Manual •PUBLIC
UG000495 •v4-00 • 2021-Dec-01
33 │5
2 Setting Up the EVM
This section describes the setup steps necessary to start using the EVM software.
2.1 Setting Up the EVM Hardware
The ToF sensor enclosure is already assembled and ready to plug in to a PC. The EVM with the
enclosure exposes only one micro-USB connector:
Figure 2:
EVM with Enclosure
On EVMs without enclosure (or if the enclosure has been removed) plug in the micro-USB connector
to the USB connector closer to the center of the Raspberry PI Zero W board (see Figure 3)

Document Feedback
TMF882X
Setting Up the EVM
Demo Kit Manual •PUBLIC
UG000495 •v4-00 • 2021-Dec-01
33 │6
Figure 3:
EVM Without Enclosure –Front Side (TMF882X facing to table)
The TMF882X is shown when placing the Raspberry PI Zero W on the backside (see Figure 4)
Figure 4:
EVM Without Enclosure –Back Side (TMF882X facing to ceiling)
2.1.1 Install the EVM USB Windows (one-time only)
When the EVM is plugged into the PC Windows should recognize the EVM as a “Removable Disk”. If
your PC does not automatically install the necessary USB driver, the mountable drive contains USB
drivers for both Windows and Mac. Install this necessary USB driver:
●ams_raspirndis_setup.exe
This step is only necessary during first-time setup, but will need to be repeated if using the EVM
software on a new PC.

Document Feedback
TMF882X
Setting Up the EVM
Demo Kit Manual •PUBLIC
UG000495 •v4-00 • 2021-Dec-01
33 │7
2.1.2 Installing the EVM Graphical User Interface
The ToF EVM GUI software is included on the USB flash drive. Launch the Windows installer and
choose the desired installation options. The EVM graphical user interface executable is titled
TMF882X_EVM_GUI.exe.

Document Feedback
TMF882X
Using the EVM Software
Demo Kit Manual •PUBLIC
UG000495 •v4-00 • 2021-Dec-01
33 │8
3 Using the EVM Software
This section describes the operation and capabilities of the EVM Graphical User Interface (EVM GUI).
Figure 5:
EVM GUI Overview in 3x3, 3x6, and 4x4 Pixel Mode
1Main Tab Selector (see section 3.1.2)
2Histogram Display Selector (see section
3.1.3)
6Distance Bar Chart (see section 3.2.1)
7Histograms Plot (see section 3.2.1)
8“Histograms” Box (see section 3.2.2)
3“Control” Box (see section 3.1.4)
4“Data Logging” Box (see section 3.1.5)
5Connection Status Indicators (see section
3.1.6)
9“Display” Box (see section 3.2.2)
10 “Information” Box (see section 3.2.2)
11 “Measurement” Box (see section 3.2.2)
1
2
3
4
5
6
7
8
9
10
11

Document Feedback
TMF882X
Using the EVM Software
Demo Kit Manual •PUBLIC
UG000495 •v4-00 • 2021-Dec-01
33 │9
Figure 6:
EVM GUI Overview in 8x8 Pixel Mode
1Main Tab Selector (see section 3.1.2)
3“Control” Box (see section 3.1.4)
4“Data Logging” Box (see section 3.1.5)
5Connection Status Indicators (see section
3.1.6)
6Distance Bar Chart (see section 3.2.1)
10 “Information” Box (see section 3.2.2)
11 “Measurement” Box (see section 3.2.2)
1
3
4
5
6
10
11

Document Feedback
TMF882X
Using the EVM Software
Demo Kit Manual •PUBLIC
UG000495 •v4-00 • 2021-Dec-01
33 │10
3.1 Controls for All Tabs
3.1.1 Menu
The global menu contains these entries:
"File" Menu
●"Save Configuration" - save all EVM GUI settings (control values)
●"Load Configuration" - loads all EVM GUI settings (control values)
●"Exit" - leave the EVM GUI
"Help" Menu
●"About Dialog" - shows version information and copyright notices
3.1.2 Main Tab Selector [1]
Select your view context here:
●The "Main" tab shows histograms (also in a histogram matrix) and data for the object in the
sensor's field of view as a bar chart (distance and confidence)
●The "3D" tab shows a 3D graphical representation the same object data(distance and
confidence)
●The "Interrupt" tab is similar to the 3D tab and allows you to set object detection parameters
(e.g. relevant object distance)
●You can update the firmware on the EVM module with the "File Upload" tab
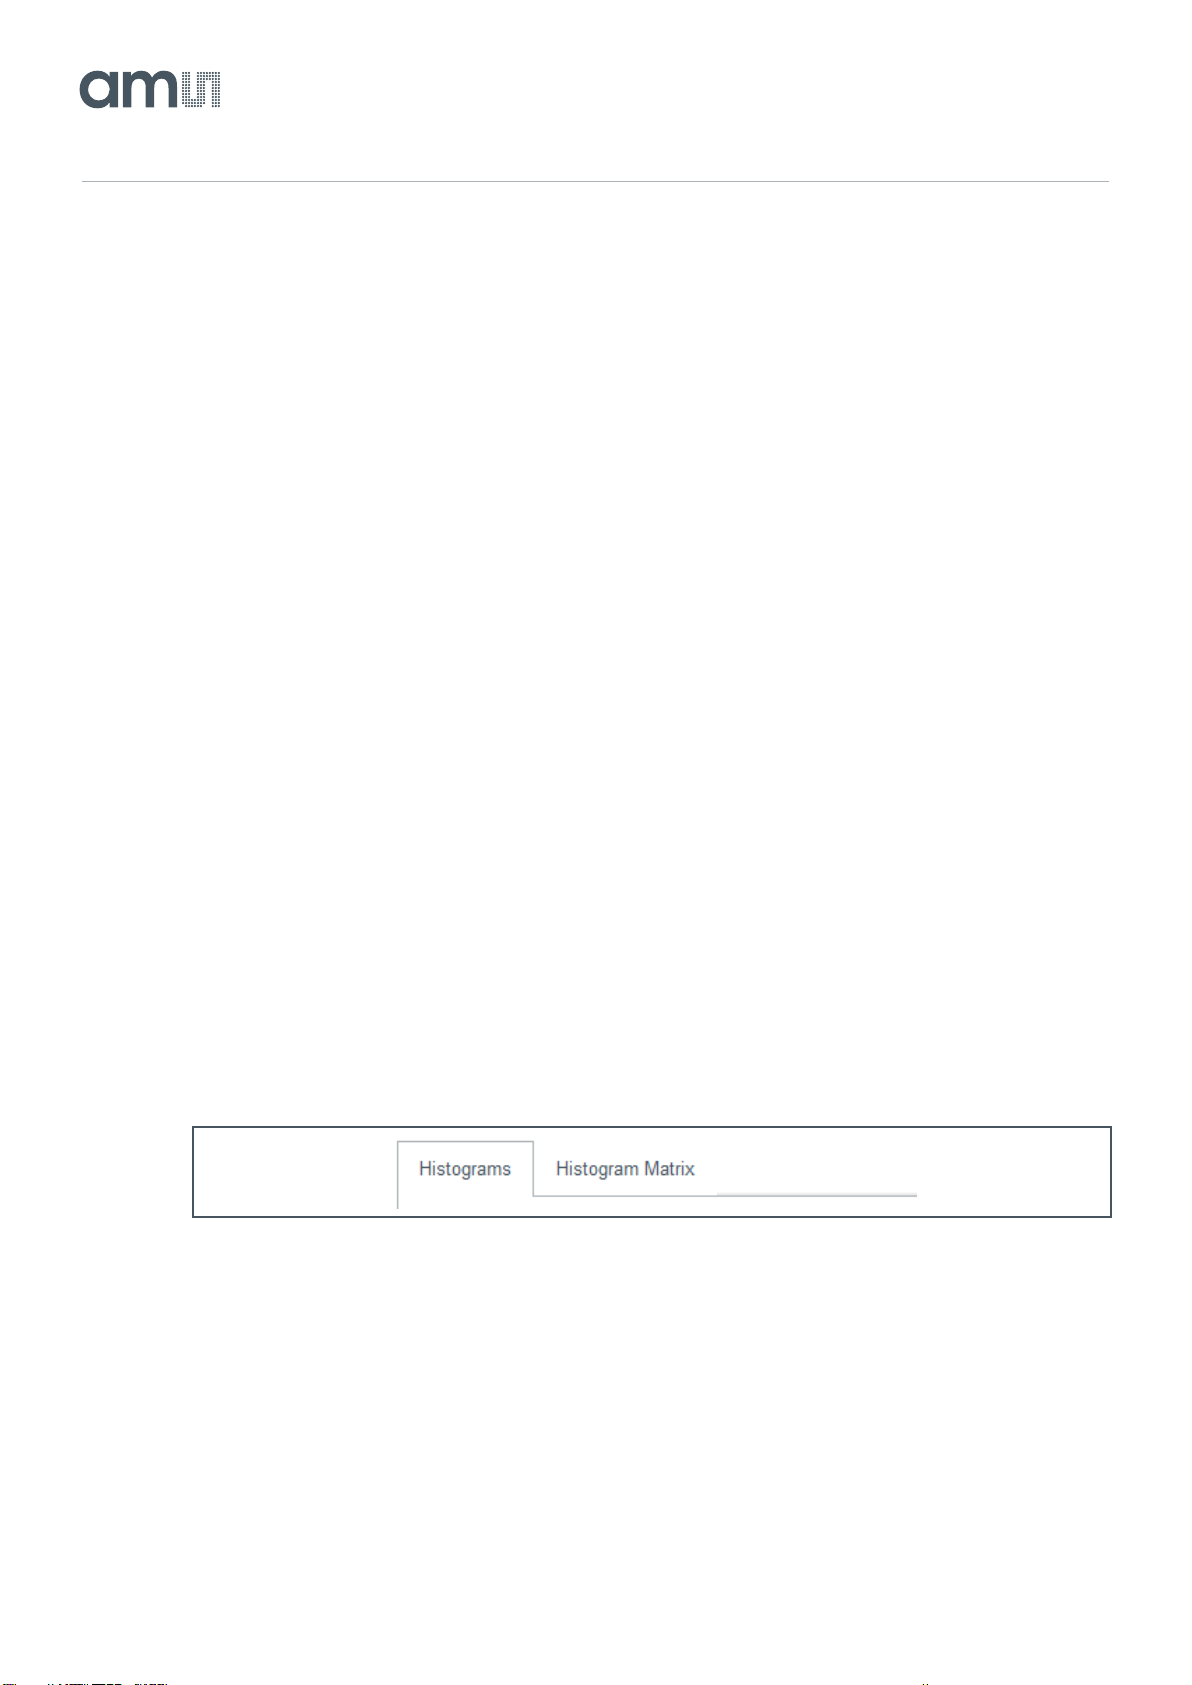
3.1.3 Histogram Display Selector [2]
Figure 7:
Histogram Display Selector
You can display histograms either in a combined graph as shown above or separately for each of the
channels by selecting "Histogram Matrix".

Document Feedback
TMF882X
Using the EVM Software
Demo Kit Manual •PUBLIC
UG000495 •v4-00 • 2021-Dec-01
33 │11
Information
The 8x8-histogram view is not enabled in the EVM GUI. It automatically hides this element in 8x8
mode.
3.1.4 "Control" Box [3]
Figure 8:
Control Box
“Pixels” Combo Box
The TMF882X detects objects in more than one zone. Select the zone setup here.
Select one of these:
●3 x 3 - divides the field of view into nine zones, arranged in a 3 by 3 rectangle
●4 x 4 - divides the field of view into sixteen zones, arranged in a 4 by 4 rectangle
●3 x 6 - divides the field of view into eighteen zones, arranged in a 3 by 6 rectangle
●8 x 8 - divides the field of view into 64 zones, arranged in a 8 by 8 rectangle
"SPAD Map" Combo Box
Define the field of view with the entries in this combo box. For a narrow field of view, select e.g.
"33°x32°".
For a wide field of view, select e.g. "41°x52°" - 41° horizontal, 52° vertical.
For 8 x 8 zones, the SPAD Map is fixed to a “Custom Map” that cannot be changed.

Document Feedback
TMF882X
Using the EVM Software
Demo Kit Manual •PUBLIC
UG000495 •v4-00 • 2021-Dec-01
33 │12
"Mode" Combo Box
This control is available for 3 x 3, 4 x 4, and 3 x 6 zones. It selects three predefined parameter sets for
iterations and threshold:
●Default Mode - 550000 iterations, the TMF882X runs with a measurement frequency of 30 Hz in
this mode
●Low Power Mode - 50000 iterations, the TMF882X runs with minimal power consumption in this
mode
●High Performance Mode - 4000000 iterations, used for detecting objects with maximum range
In all three modes, the default value for the object detection threshold is 6. This is the minimum
confidence required to display an object in the distance bar chart and the 3D graphs.
"Iterations" Spin Box
Select the number of iterations in a single target measurement here. If you increase the number of
iterations for a single measurement the overall measurement frequency will decrease.
For 8 x 8 zones, the EVM GUI will display the frame rate depending on the number of iterations. The
maximum framerate is 15 samples/second.
"Threshold" Spin Box
Select the minimum confidence threshold for target detection here. If the calculated target detection
confidence is below this level, the GUI will not display the corresponding object in the graphs.
"Run" Check Box
Enable this check box to run target measurements continuously.
Sequence Controls
The sequence spin box and the sequence button enable you to run a defined number of target
measurements. With the default setting clicking the sequence button will trigger 10 measurements.
After that, the EVM GUI will stop requesting new measurement results. This is especially useful for
logging an exactly defined number of measurements.
Calibration Controls
The EVM needs to be calibrated for precise measurements. The factory calibration indicator (the dot
left of the "Calibrate" button) shows if the EVM was calibrated for the current operation mode (e.g.
3 x 3) and the selected SPAD map.
Without calibration data, the ToF possibly also detects the cross-talk peak caused by the cover glass
on the EVM case as valid object.

Document Feedback
TMF882X
Using the EVM Software
Demo Kit Manual •PUBLIC
UG000495 •v4-00 • 2021-Dec-01
33 │13
To initiate a new factory calibration you have to click on the "Calibrate" button. It is recommended to
set “High performance mode” before starting the calibration.
To clear the existing calibration data and to set the EVM back to the uncalibrated mode you have to
click on the "Clear Calibration" button.
Both calibration and clearing the calibration take approximately 1 - 2 seconds to complete. During this
short time, the device is reset and all graphs will stop updating until the reset is complete.
Information
When performing factory calibration no object should be within 400 mm of the ToF sensor’s field of
view and use low ambient light (avoid high IR content).
3.1.5 "Data Logging" Box [4]
Figure 9:
Data Logging Box
To log measurement data to a file you need to:
●Click on the button "Select File" to select an existing log file or enter the file name for a new file.
The EVM GUI then displays the log file name in the text field below.
●Enable the check box "Save Data To File". From now on the EVM GUI logs all measurement
results and configuration changes to the selected log file. Please note that logging is only done
on enabled objects –for full logging please enable histogram display.
●After all measurements are done you have to disable the check box "Save Data To File".
Access to the log file with e.g. MS Excel is now possible.
Please refer to the separate documentation for the EVM GUI log file format for more details.
Information
Be careful when logging with multiple data options selected over a long period. With all histograms
enabled and continuous logging, the resulting log file can be in the gigabyte range for size in 1 –2
hours.

Document Feedback
TMF882X
Using the EVM Software
Demo Kit Manual •PUBLIC
UG000495 •v4-00 • 2021-Dec-01
33 │14
3.1.6 Connection Status Indicators [5]
Figure 10:
Connection Status Indicators
These are connection status indicators between the EVM GUI software and the TMF882X EVM
software running in the enclosure.
"Control HID" is the connection status with the enclosure software
●A red label indicates there is no working connection with the enclosure software.
●A green label means the connection is working
"Module HID" is the connection status with the TMF882X demo software
●A red label indicates that there is a problem communicating with the TMF882X demo software
or an internal software error.
●A green label means the TMF882X software connection is working
A third indicator displays the type of the ToF sensor the EVM contains. Either “TMF8820”,
“TMF8821”, or “TMF8828”.
3.2 EVM GUI "Main" Tab
3.2.1 Main Tab Graphs
Distance Bar Chart [6]
Figure 11:
Distance Bar Chart

Document Feedback
TMF882X
Using the EVM Software
Demo Kit Manual •PUBLIC
UG000495 •v4-00 • 2021-Dec-01
33 │15
This is a plot of the detected objects' distance vs the confidence value (range 0 –255) of the current
detection (measurement). The X-axis indicates the distance in millimeters and the Y-axis indicates the
confidence value. The GUI displays up to 36 bars here (6 x 3 mode, two objects per zone).
The legend of this chart has four entries:
●Photon Count Object - this value increases with the reflectivity of the target object surface
●Photon Count Reference - related to the optical reference channel, not influenced by the target
object
●Background Light - related to the (IR only) ambient light, the TMF882X sensor sees
●Temperature - the temperature of the TMF882X sensor (on-chip SPAD sensor array
temperature)
Histograms Plot [7]
Figure 12:
Histograms Plot
This is a plot of the TDC histogram information based off the selections in the "Display" box and the
"Histograms" box.
The X-axis indicates the "time buckets" in 100-picosecond increments, and the Y-axis indicates the
number of photonic triggers/hits at the given time interval.

Document Feedback
TMF882X
Using the EVM Software
Demo Kit Manual •PUBLIC
UG000495 •v4-00 • 2021-Dec-01
33 │16
Histogram Matrix
Figure 13:
Histogram Matrix
This is a plot of the TDC histograms for each of the zones (pixels) in the field of view.
Information
The 8x8-histogram view is not enabled in the EVM GUI. It automatically hides this element in 8x8
mode.

Document Feedback
TMF882X
Using the EVM Software
Demo Kit Manual •PUBLIC
UG000495 •v4-00 • 2021-Dec-01
33 │17
3.2.2 Main Tab Controls
"Histograms" Box [8]
Figure 14:
Histograms Box
The controls in this box influence the display of the histograms in the histograms plot and the
histogram matrix:
●Switch on the histogram legend with the check box "Show Legend".
●Enable automatic scaling for the Y-axis with the check box "Auto Scale Y axis". If this check box
is disabled the histogram plots use the value of the check box "Y Axis" as maximum value.
●As default the histogram graphs are linear in x direction and y direction. You can change the
scaling for the Y-axis to logarithmic. This allows to better observe very low values in the first few
bins and in the (object and cross-talk) peak tails.
Information
The 8x8-histogram view is not enabled in the EVM GUI. It automatically hides this element in 8x8
mode.
"Display" Box [9]
Figure 15:
Display Box

Document Feedback
TMF882X
Using the EVM Software
Demo Kit Manual •PUBLIC
UG000495 •v4-00 • 2021-Dec-01
33 │18
Select which histograms you are interested in with the controls in this box:
●The "Reference" check box tells the GUI to display the optical reference histograms. The optical
path for this histogram is entirely within the sensor package. The target objects in the field of
view of the sensor do not influence this histogram.
●The "Measurement" histograms show the reflected light from the objects in the field of view of
the sensor.
The Histogram "Snapshot" button allows the user to "freeze frame" the current histogram plot while
still plotting the measurement histograms concurrently. This gives you the ability examine two
histogram plots (one current, the other one a snapshot) at the same time in the histogram plotting
area. Releasing the "Snapshot" button deletes the saved snapshot histograms.
Information
The 8x8-histogram view is not enabled in the EVM GUI. It automatically hides this element in 8x8
mode.
Information
To get fastest ranging time, disable all histogram display check boxes here.
"Information" Box [10]
Figure 16:
Information Box
This box contains information about the hardware and software in the EVM enclosure:
●The serial number is the unique hardware ID of the TMF882X sensor
●Below that you can find the revision of the embedded sensor firmware
●The driver revision refers to the software on the controller board (a Raspberry Pi Zero W) in the
EVM enclosure

Document Feedback
TMF882X
Using the EVM Software
Demo Kit Manual •PUBLIC
UG000495 •v4-00 • 2021-Dec-01
33 │19
You can find the version of the current EVM GUI in the "About" dialog in the main menu –“Help /
About Dialog”. The EVM GUI also writes this information into the first lines of each generated log file.
Please refer to the separate documentation for the EVM GUI log file format for more details.
"Measurement" Box [11]
Figure 17:
Measurement Box
The controls in this box allow you to select one zone in the field of view. For this zone, the GUI
displays the current object data values.
●"Zone" - select the zone you are interested in
●“Dist 1." - distance to the first object in the selected zone
●"Conf 1." - confidence for the object detection of the first object in the selected zone
●"Dist 2." and "Conf 2." provide the current data for the second object in the selected zone
The sensor did not detect objects if confidence 1 or 2 is equal zero.

Document Feedback
TMF882X
Using the EVM Software
Demo Kit Manual •PUBLIC
UG000495 •v4-00 • 2021-Dec-01
33 │20
3.3 EVM GUI "3D" Tab
Figure 18:
3D Tab
This graph shows the detected objects in all the zones (pixels) in the field of view of the sensor. As
you can see in the screenshot, the sensor detects up to two objects in each zone. Each object is
shown as a plate above the base plane. If the calculated detection confidence is high, the object plate
is fully colored. If the confidence is low, the plate becomes transparent.
In the example screenshot, the sensor sees a close target (at around 20 cm) in all zones. In addition, it
detects the ceiling above the test setup at around 250 cm. The ceiling does not reflect much light. The
confidence values for detecting the ceiling are low because of that.
You can freely rotate and zoom this graph with your mouse:
●Click and hold the right mouse button
●Now move the mouse around and observe how the graph is rotated
●Use the mouse scroll well to zoom in and out
You can set the maximum distance for this graph with the spin box in the "3D" box.
Table of contents
Other AMS Motherboard manuals

AMS
AMS TSL2540 EVM User manual

AMS
AMS AS7058 User manual

AMS
AMS AS5 Series User manual

AMS
AMS TMF8821-SHIELD User manual

AMS
AMS TMF882X-SHIELD User manual

AMS
AMS AS5601-SO_EK_ST User manual

AMS
AMS AS5047P-TS_EK_AB User manual

AMS
AMS USB I&P Box User manual

AMS
AMS JetCis 130 User manual

AMS
AMS TCS3707 EVM User manual

AMS
AMS TCS3 7 Series User manual

AMS
AMS AS703X_EVALKIT_BT User manual

AMS
AMS TCS3414 EVM2 User manual

AMS
AMS AS3956 User manual

AMS
AMS CCS811 User manual

AMS
AMS AS621 Series User manual

AMS
AMS AS1119 User manual

AMS
AMS AS3933 Operating and installation instructions

AMS
AMS TSL2541 User manual

AMS
AMS TMD2636 EVM User manual